


 marketing
Similar presentations:


SMM Report February 2021
1.
SMM REPORTFebruary 2021
2.
General Statistics3.
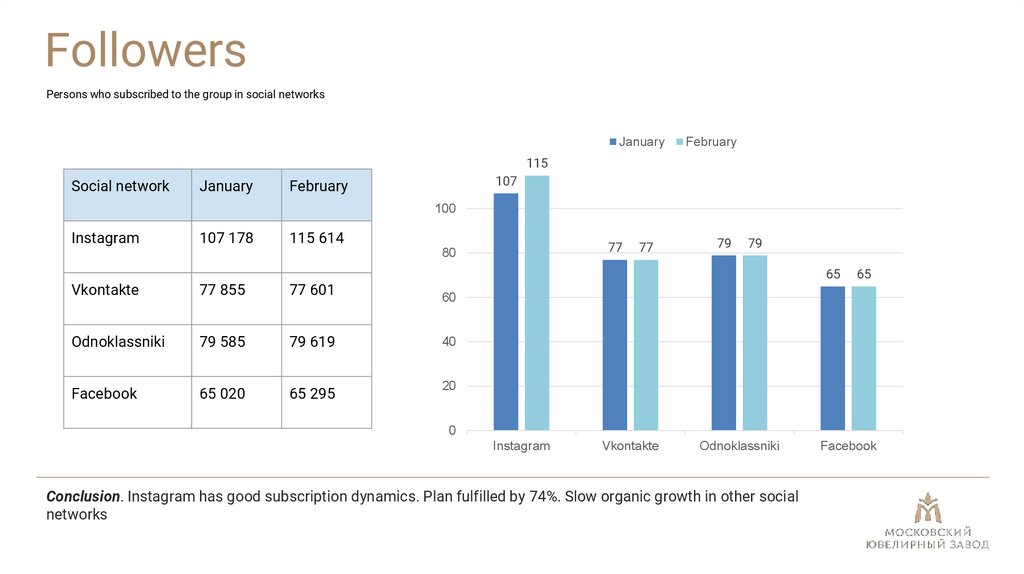
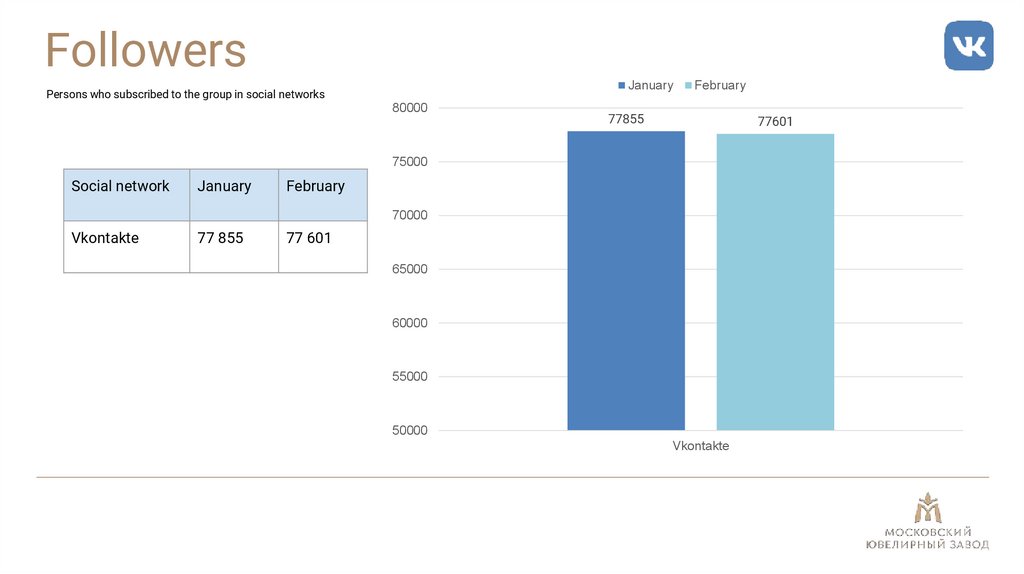
FollowersPersons who subscribed to the group in social networks
January
February
115
Social network
January
107
February
100
107 178
115 614
77
80
77
79
79
65
Vkontakte
77 855
77 601
60
Odnoklassniki
79 585
79 619
40
65 020
65 295
20
65
0
Vkontakte
Odnoklassniki
Conclusion. Instagram has good subscription dynamics. Plan fulfilled by 74%. Slow organic growth in other social
networks
4.
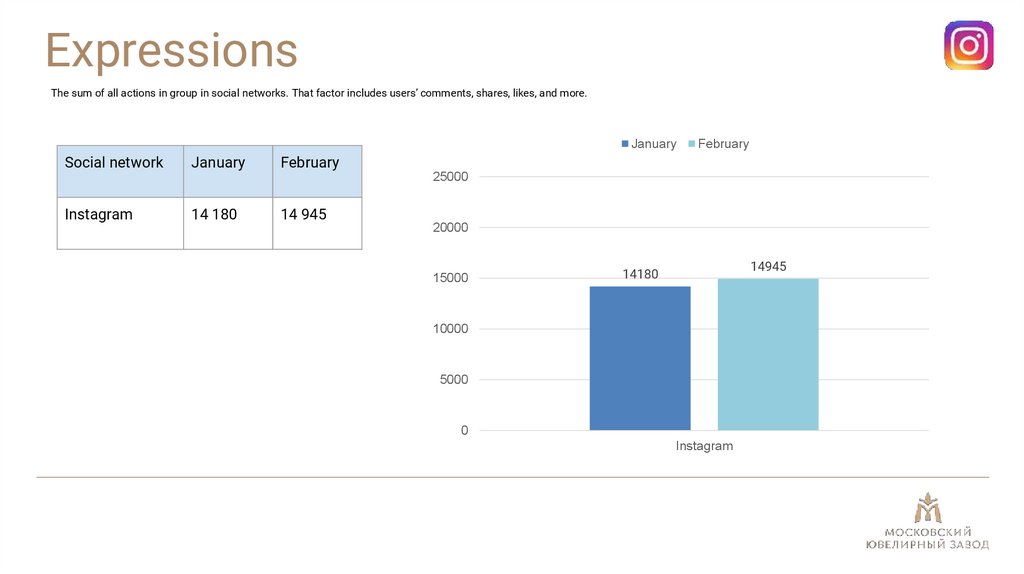
ExpressionsThe sum of all actions in group in social networks. That factor includes users’ comments, shares, likes, and more.
January
Social network
January
February
18
16
14 180
14 945
February
14
14
15
12
Vkontakte
1329
4156
10
8
Odnoklassniki
370
280
6
4
4
783
814
2
1
0,3
0,2
0,7
0,8
0
Vkontakte
Odnoklassniki
Conclusion. The audience on Vkontakte and Odnoklassniki is more active and inclined to participate in competitions,
so growth through competitions is achieved there faster. There was a break from competitions, so there is a
decrease in indicators
5.
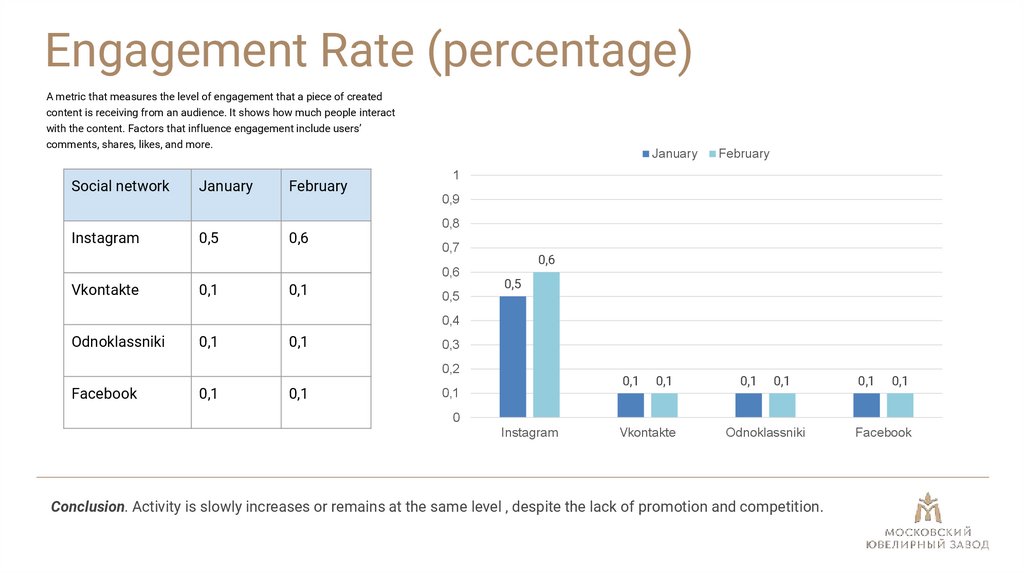
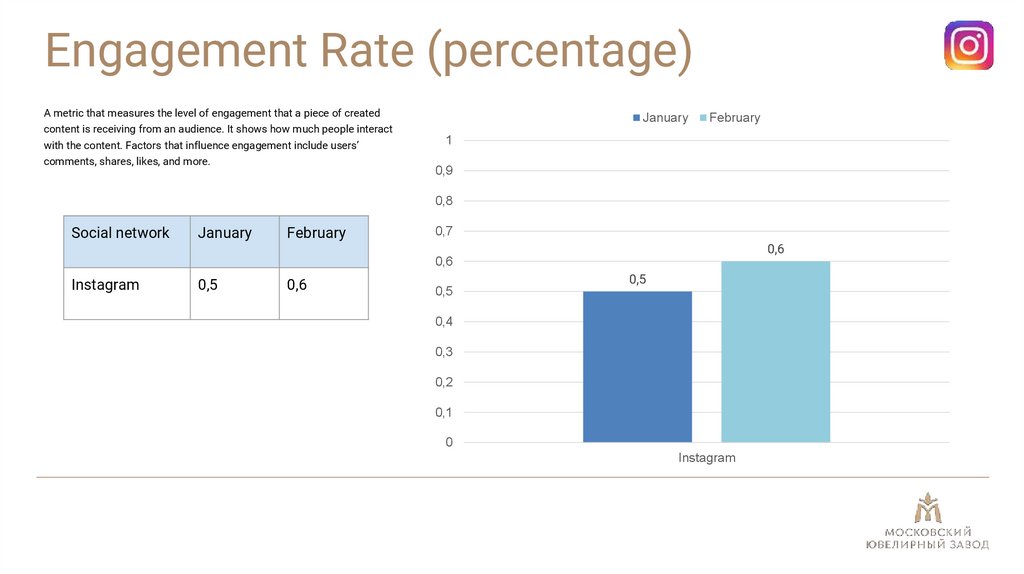
Engagement Rate (percentage)A metric that measures the level of engagement that a piece of created
content is receiving from an audience. It shows how much people interact
with the content. Factors that influence engagement include users’
comments, shares, likes, and more.
Social network
January
0,5
January
February
0,6
1
0,9
0,8
0,7
0,6
Vkontakte
0,1
0,1
February
0,5
0,6
0,5
0,4
Odnoklassniki
0,1
0,1
0,3
0,2
0,1
0,1
0,1
0,1
0,1
0,1
0,1
0,1
0,1
0
Vkontakte
Odnoklassniki
Conclusion. Activity is slowly increases or remains at the same level , despite the lack of promotion and competition.
6.
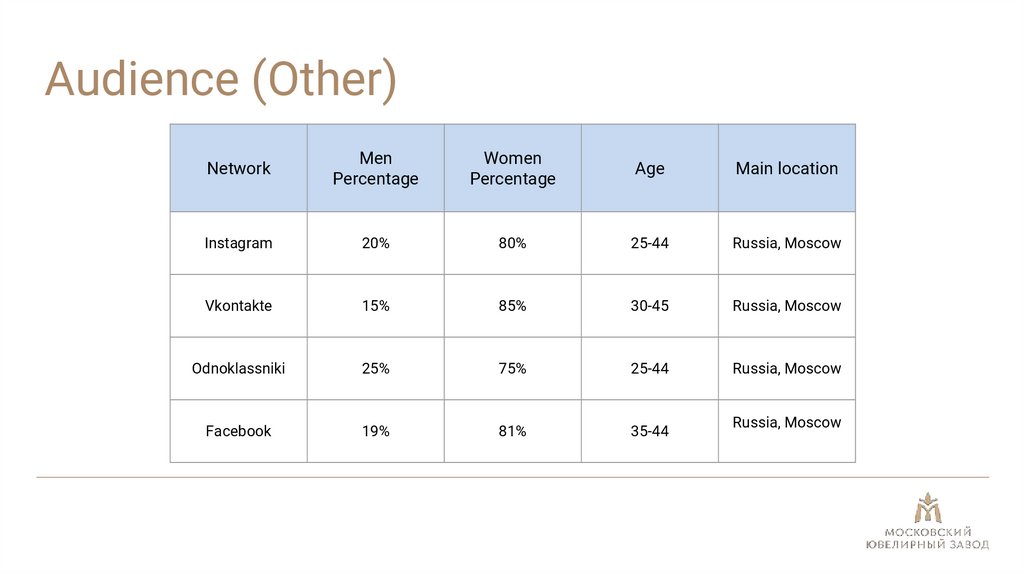
Audience (Other)Network
Men
Percentage
Women
Percentage
Age
Main location
20%
80%
25-44
Russia, Moscow
Vkontakte
15%
85%
30-45
Russia, Moscow
Odnoklassniki
25%
75%
25-44
Russia, Moscow
19%
81%
35-44
Russia, Moscow
7.
Instagramdetailed statistics
8.
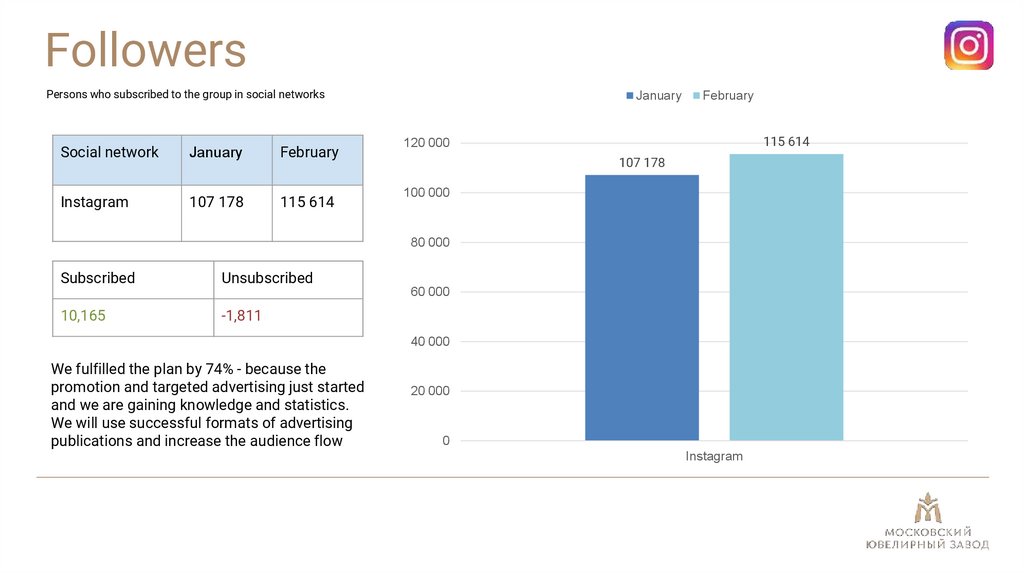
FollowersPersons who subscribed to the group in social networks
January
Social network
January
February
120 000
107 178
115 614
100 000
February
115 614
107 178
80 000
Subscribed
Unsubscribed
10,165
-1,811
60 000
40 000
We fulfilled the plan by 74% - because the
promotion and targeted advertising just started
and we are gaining knowledge and statistics.
We will use successful formats of advertising
publications and increase the audience flow
20 000
0
9.
ExpressionsThe sum of all actions in group in social networks. That factor includes users’ comments, shares, likes, and more.
January
Social network
January
February
February
25000
14 180
14 945
20000
15000
14945
14180
10000
5000
0
10.
Engagement Rate (percentage)A metric that measures the level of engagement that a piece of created
content is receiving from an audience. It shows how much people interact
with the content. Factors that influence engagement include users’
comments, shares, likes, and more.
January
February
1
0,9
0,8
Social network
January
February
0,7
0,6
0,6
0,5
0,6
0,5
0,5
0,4
0,3
0,2
0,1
0
11.
Content12.
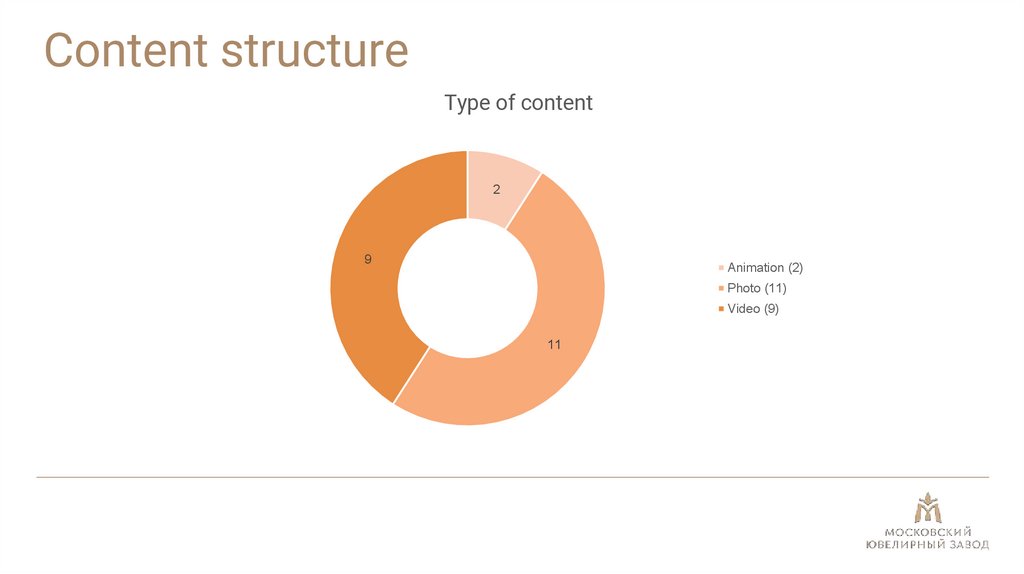
Content structureType of content
2
9
Animation (2)
Photo (11)
Video (9)
11
13.
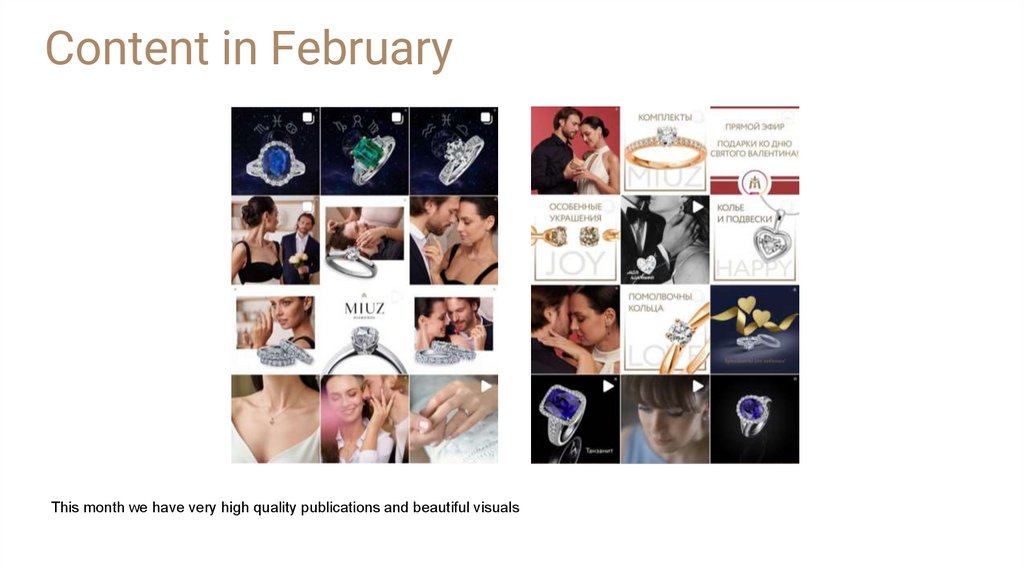
Content in FebruaryThis month we have very high quality publications and beautiful visuals
14.
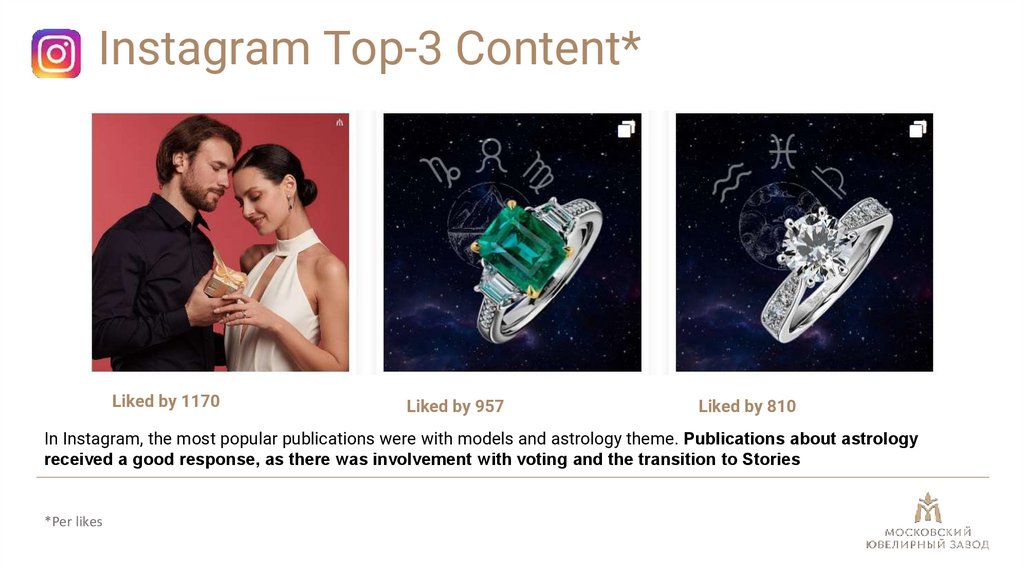
Instagram Top-3 Content*Liked by 1170
Liked by 957
Liked by 810
In Instagram, the most popular publications were with models and astrology theme. Publications about astrology
received a good response, as there was involvement with voting and the transition to Stories
*Per likes
15.
Streams & Promocodes16.
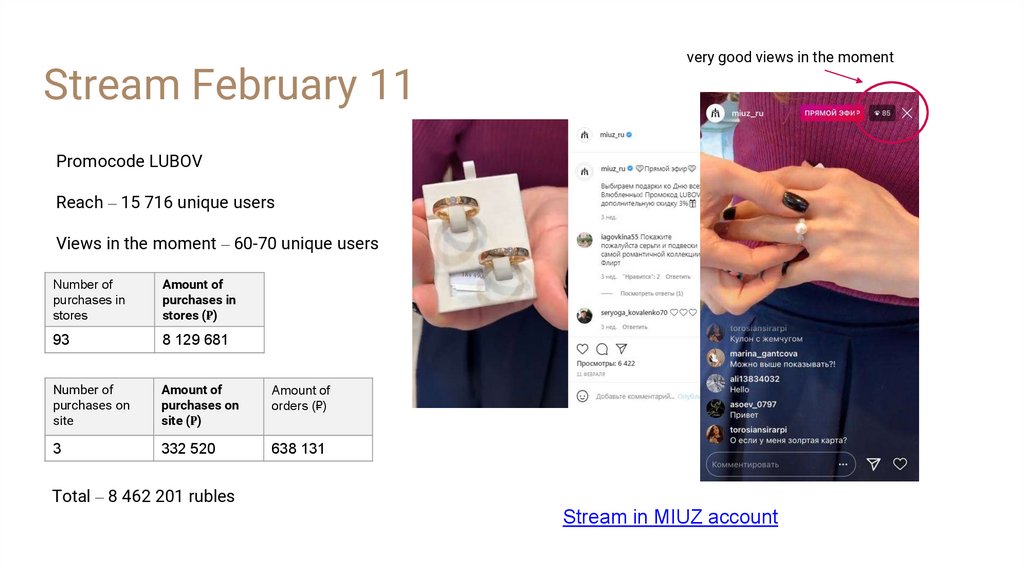
Stream February 11very good views in the moment
Promocode LUBOV
Reach – 15 716 unique users
Views in the moment – 60-70 unique users
Number of
purchases in
stores
Amount of
purchases in
stores (₽)
93
8 129 681
Number of
purchases on
site
Amount of
purchases on
site (₽)
Amount of
orders (₽)
3
332 520
638 131
Total – 8 462 201 rubles
Stream in MIUZ account
17.
Promotion18.
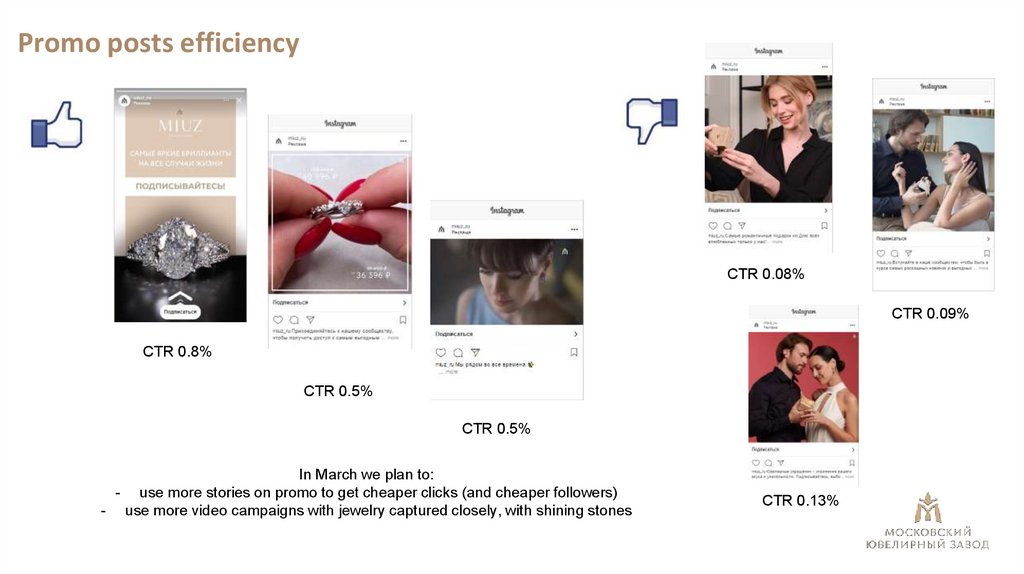
Promo posts efficiencyCTR 0.08%
CTR 0.09%
CTR 0.8%
CTR 0.5%
CTR 0.5%
In March we plan to:
- use more stories on promo to get cheaper clicks (and cheaper followers)
- use more video campaigns with jewelry captured closely, with shining stones
CTR 0.13%
19.
Vkontaktedetailed statistics
20.
FollowersJanuary
Persons who subscribed to the group in social networks
80000
February
77855
77601
75000
Social network
January
February
70000
Vkontakte
77 855
77 601
65000
60000
55000
50000
Vkontakte
21.
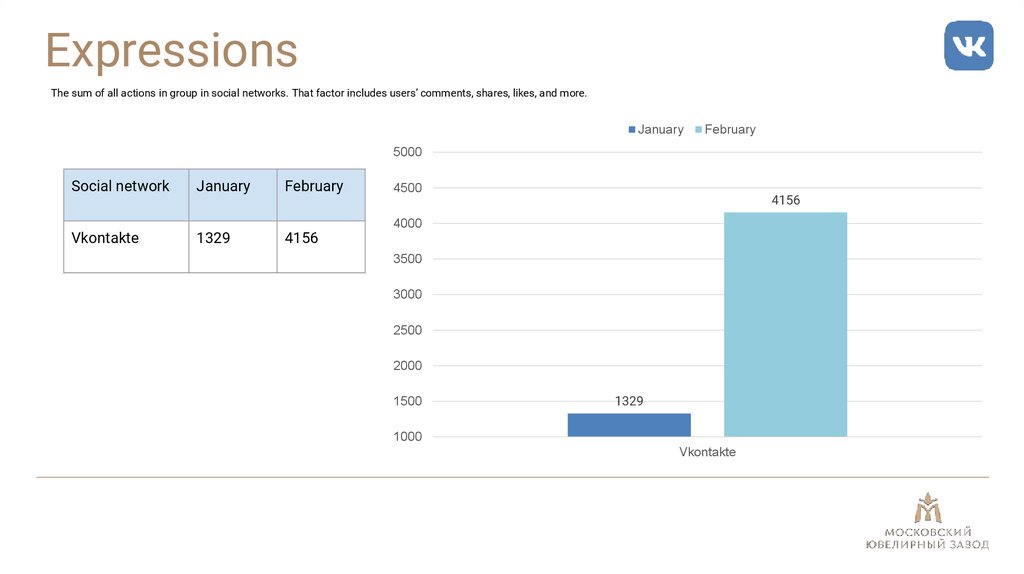
ExpressionsThe sum of all actions in group in social networks. That factor includes users’ comments, shares, likes, and more.
January
February
5000
Social network
Vkontakte
January
1329
February
4156
4500
4156
4000
3500
3000
2500
2000
1500
1329
1000
Vkontakte
22.
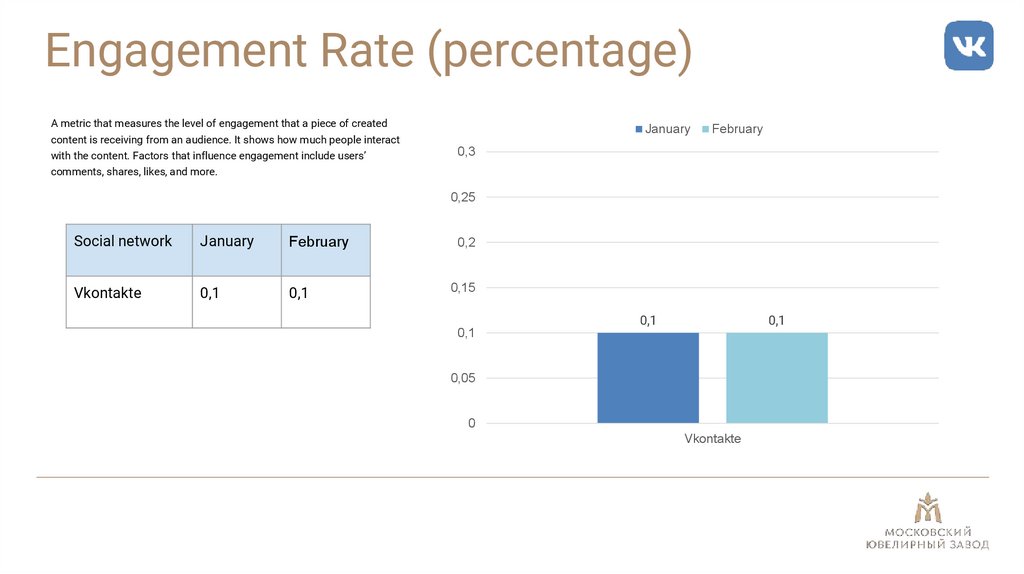
Engagement Rate (percentage)A metric that measures the level of engagement that a piece of created
January
content is receiving from an audience. It shows how much people interact
with the content. Factors that influence engagement include users’
February
0,3
comments, shares, likes, and more.
0,25
Social network
January
February
Vkontakte
0,1
0,1
0,2
0,15
0,1
0,1
0,1
0,05
0
Vkontakte
23.
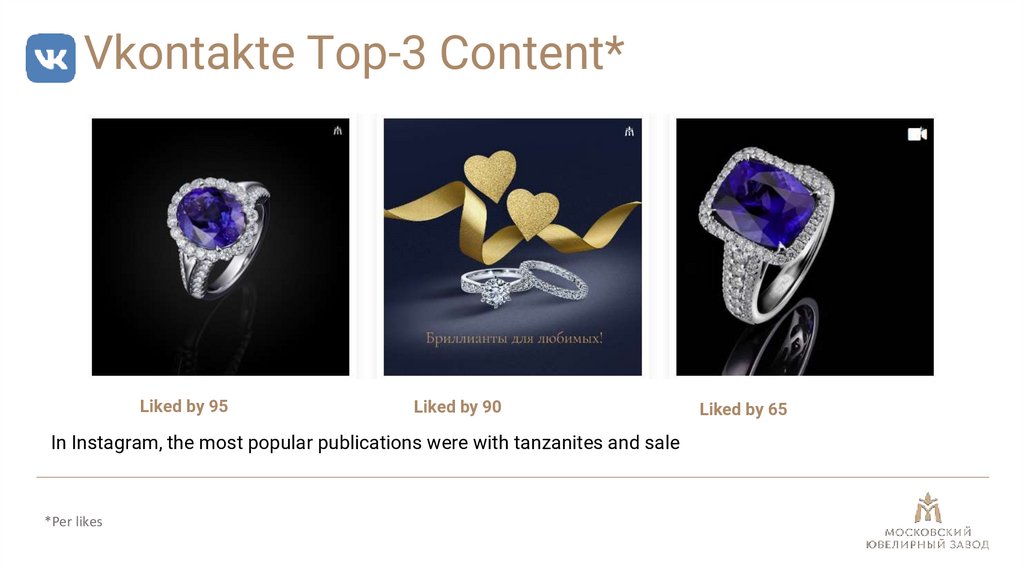
Vkontakte Top-3 Content*Liked by 95
Liked by 90
In Instagram, the most popular publications were with tanzanites and sale
*Per likes
Liked by 65
24.
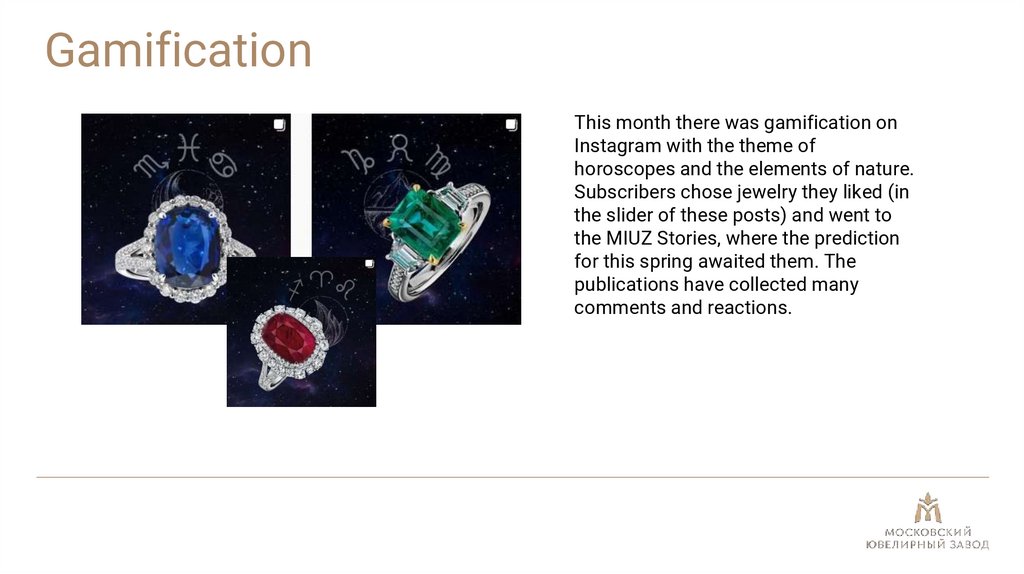
GamificationThis month there was gamification on
Instagram with the theme of
horoscopes and the elements of nature.
Subscribers chose jewelry they liked (in
the slider of these posts) and went to
the MIUZ Stories, where the prediction
for this spring awaited them. The
publications have collected many
comments and reactions.
25.
Odnoklassnikidetailed statistics
26.
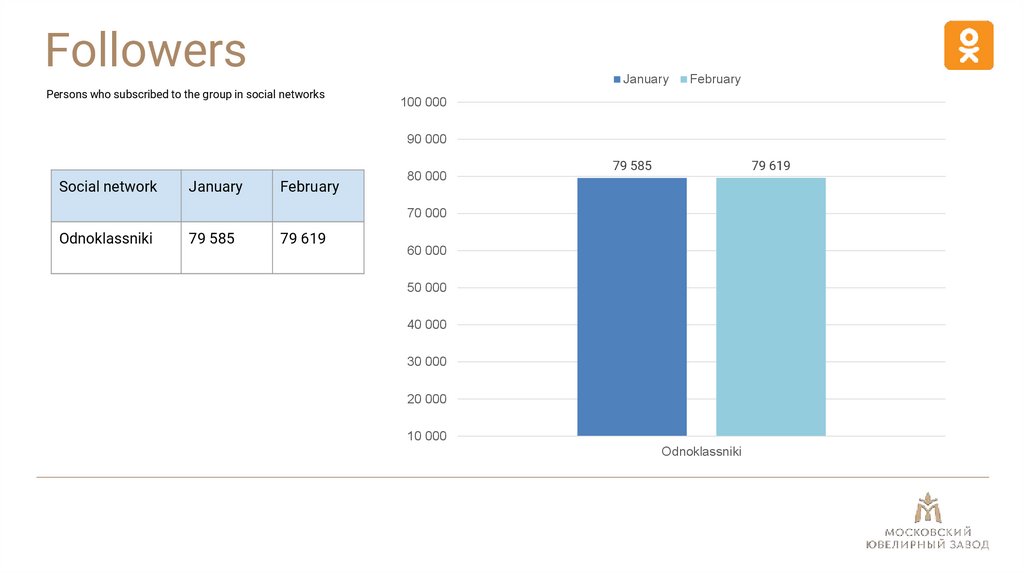
FollowersJanuary
Persons who subscribed to the group in social networks
February
100 000
90 000
Social network
January
February
80 000
79 619
79 585
70 000
Odnoklassniki
79 585
79 619
60 000
50 000
40 000
30 000
20 000
10 000
Odnoklassniki
27.
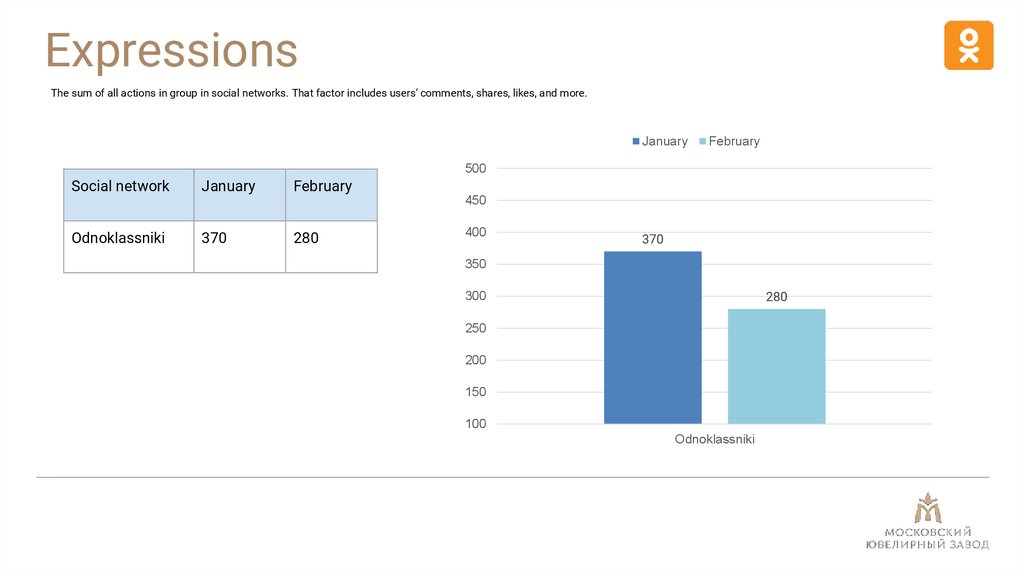
ExpressionsThe sum of all actions in group in social networks. That factor includes users’ comments, shares, likes, and more.
January
February
500
Social network
January
February
450
Odnoklassniki
370
280
400
370
350
280
300
250
200
150
100
Odnoklassniki
28.
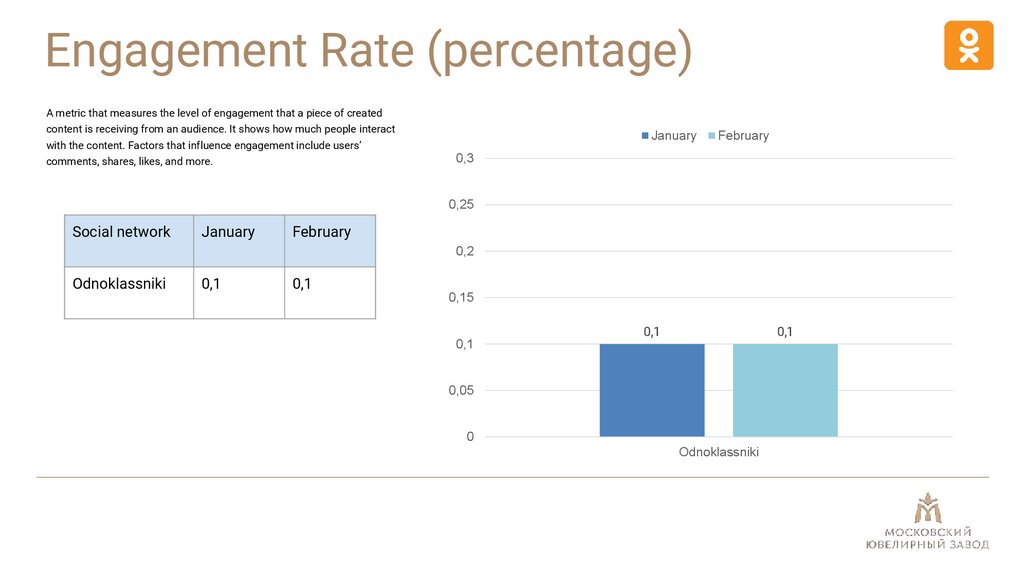
Engagement Rate (percentage)A metric that measures the level of engagement that a piece of created
content is receiving from an audience. It shows how much people interact
January
with the content. Factors that influence engagement include users’
February
0,3
comments, shares, likes, and more.
0,25
Social network
January
February
0,2
Odnoklassniki
0,1
0,1
0,15
0,1
0,1
0,1
0,05
0
Odnoklassniki
29.
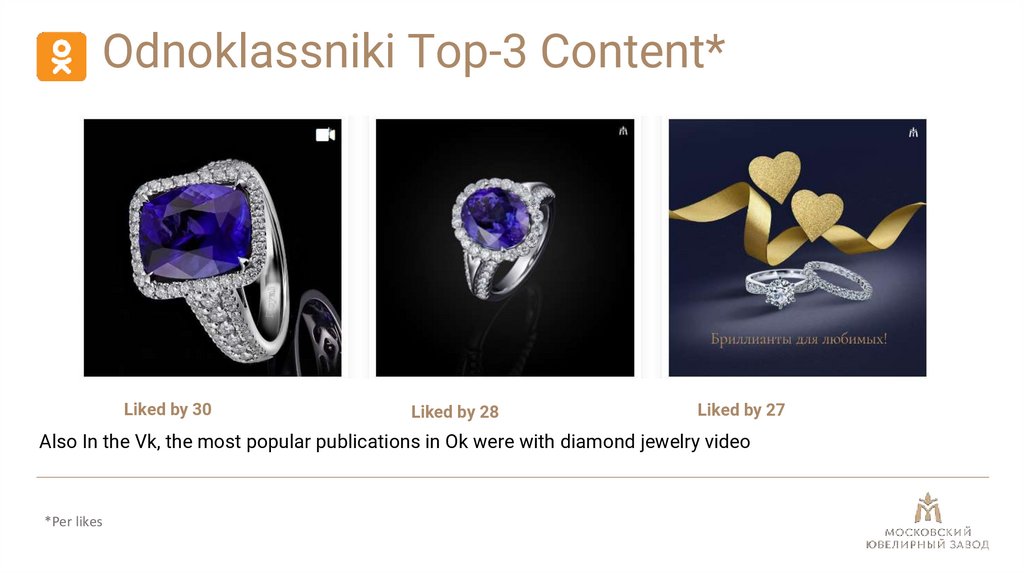
Odnoklassniki Top-3 Content*Liked by 30
Liked by 28
Liked by 27
Also In the Vk, the most popular publications in Ok were with diamond jewelry video
*Per likes
30.
Facebookdetailed statistics
31.
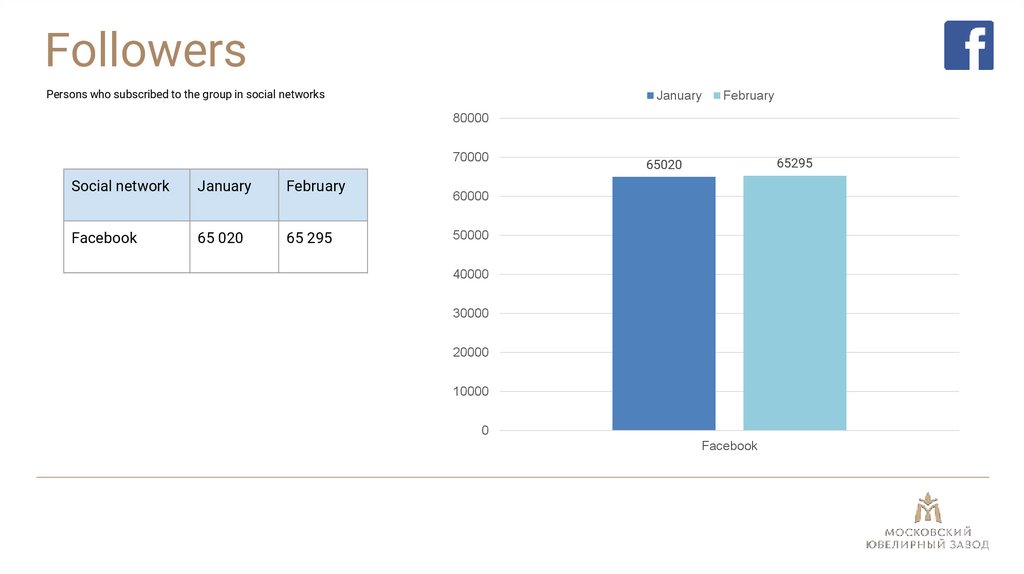
FollowersPersons who subscribed to the group in social networks
January
February
80000
70000
Social network
January
February
65 020
65 295
65295
65020
60000
50000
40000
30000
20000
10000
0
32.
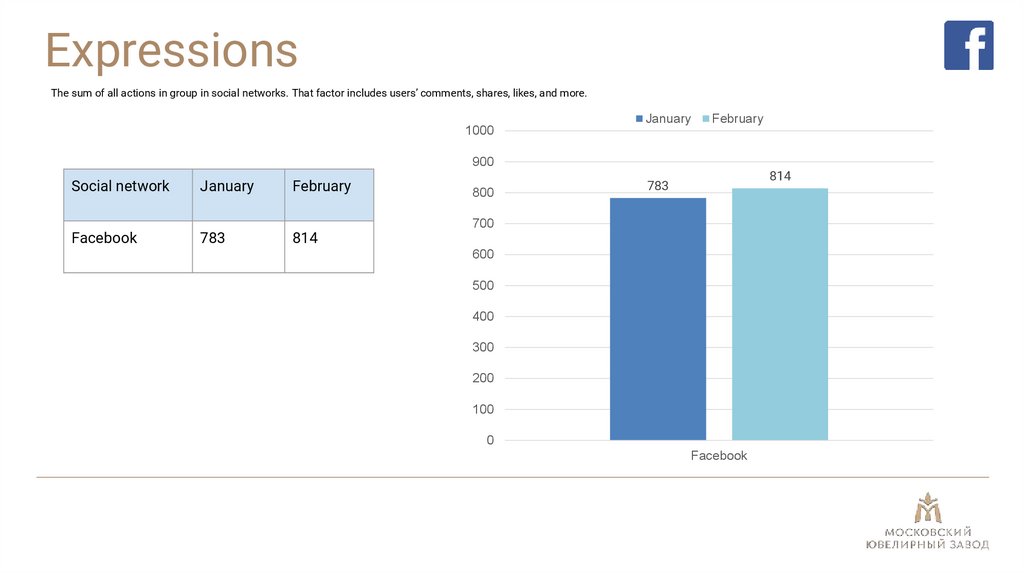
ExpressionsThe sum of all actions in group in social networks. That factor includes users’ comments, shares, likes, and more.
January
February
1000
900
Social network
January
783
February
814
800
814
783
700
600
500
400
300
200
100
0
33.
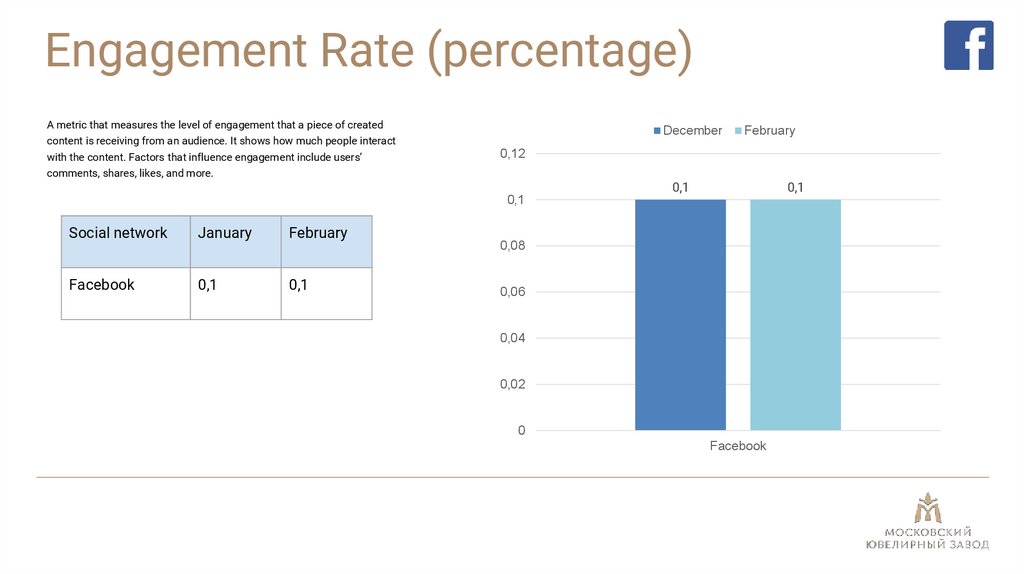
Engagement Rate (percentage)A metric that measures the level of engagement that a piece of created
December
content is receiving from an audience. It shows how much people interact
with the content. Factors that influence engagement include users’
February
0,12
comments, shares, likes, and more.
0,1
Social network
January
February
0,1
0,1
0,1
0,1
0,08
0,06
0,04
0,02
0
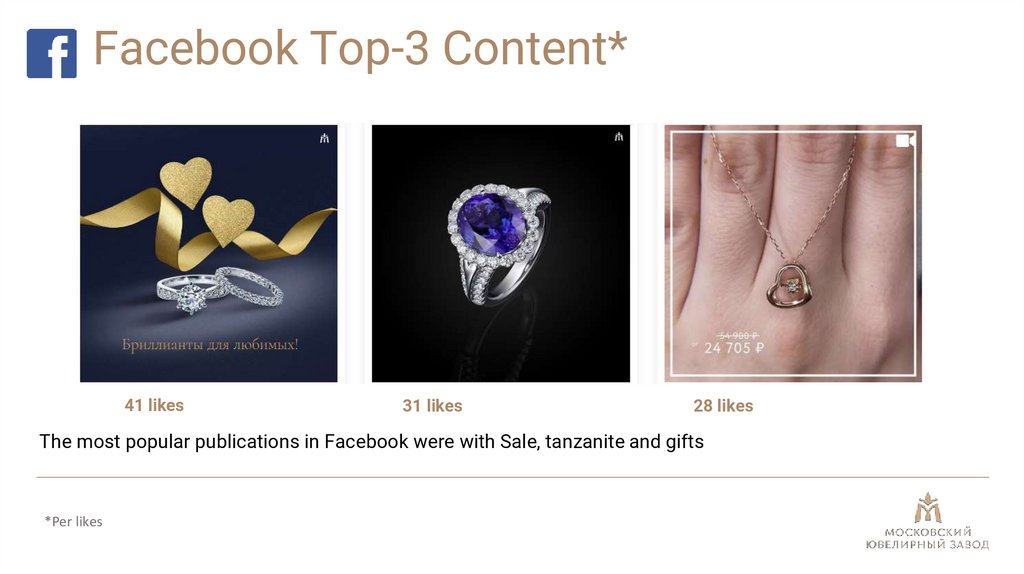
34.
Facebook Top-3 Content*41 likes
31 likes
28 likes
The most popular publications in Facebook were with Sale, tanzanite and gifts
*Per likes
35.
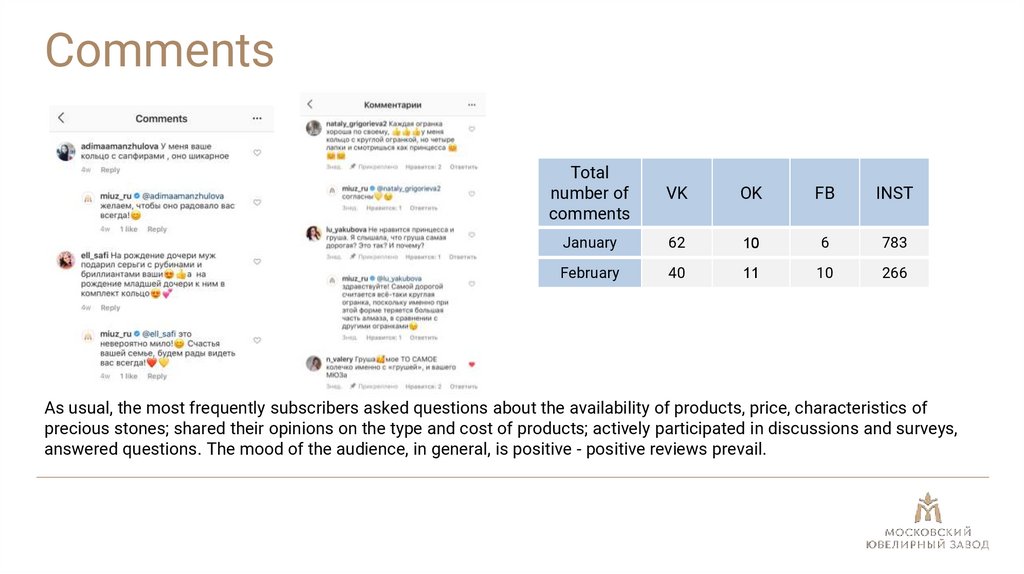
Comments36.
CommentsTotal
number of
comments
VK
OK
FB
INST
January
62
10
6
783
February
40
11
10
266
As usual, the most frequently subscribers asked questions about the availability of products, price, characteristics of
precious stones; shared their opinions on the type and cost of products; actively participated in discussions and surveys,
answered questions. The mood of the audience, in general, is positive - positive reviews prevail.
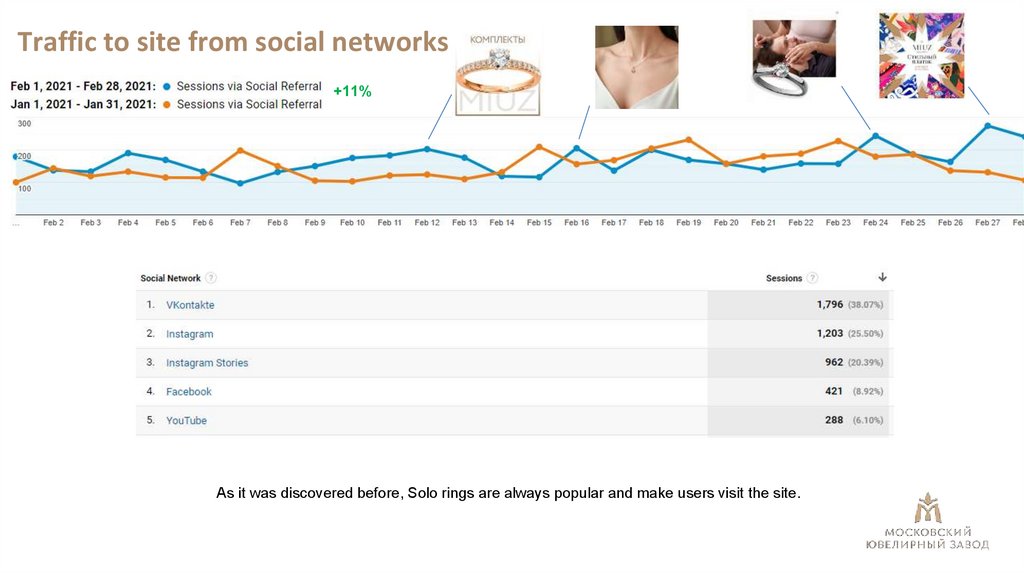
37.
Traffic to site from social networks+11%
As it was discovered before, Solo rings are always popular and make users visit the site.
38.
Conclusions39.
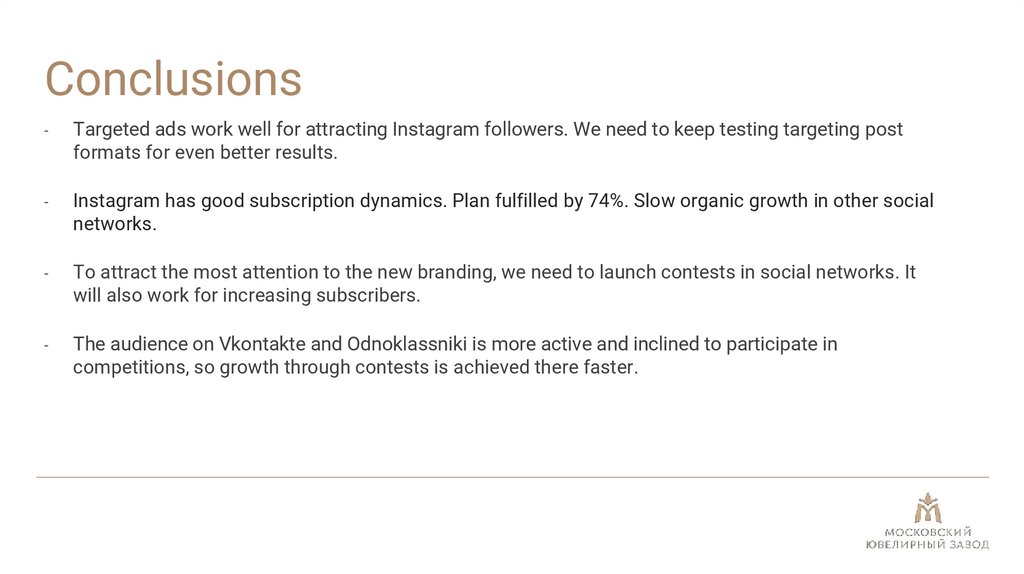
Conclusions-
Targeted ads work well for attracting Instagram followers. We need to keep testing targeting post
formats for even better results.
-
Instagram has good subscription dynamics. Plan fulfilled by 74%. Slow organic growth in other social
networks.
-
To attract the most attention to the new branding, we need to launch contests in social networks. It
will also work for increasing subscribers.
-
The audience on Vkontakte and Odnoklassniki is more active and inclined to participate in
competitions, so growth through contests is achieved there faster.