


 marketing
Similar presentations:


Competitive Analysis Beeline
1. Competitive Analysis
COMPETITIVE ANALYSISMarch 2019
Kazakhstan
Prepared by Mediavest Kazakhstan
©VEON Ltd 2016
1
2. Competitive: Budgets vs. Reach%
BASE CONSTANTCOMPETITIVE: BUDGETS VS. REACH%
Av. Flight: 5
Weeks
Av. Reach/flight: 20
Budget: 8,5
%
NO
ACTIVITY
Mln
Our approach based on Beeline
average flight (# of weeks, budget,
reach%) with further estimations on
our competitors if they had similar
conditions as Beeline)
Only SMM
1 Week
2 Weeks
15 %
5%
1 Mln
1,5 Mln
TNS Atelier DATA on website
planned traffic on period
&
Traffic Data from suppliers on soldout point
3. Digital competitive: Main Players // Tools // Budgets
DIGITAL COMPETITIVE: MAIN PLAYERS // TOOLS // BUDGETSTools used:
1. OLV – 0%
2. Social – 0%
3. AdX – 90%
4. Programmatic – 0%
5. Search – 10%
Flights: Rouming
On Air: March 2019
Tools use:
ONLY SMM
Budget: N/A KZT
Tools used:
1. Display – 45%
2. Social – 50%
3. PR articles – 5%
Flights: Contracts
On air: Mar 2019
Budget: ~ 2,9 Mln KZT
Budget: ~ 18 Mln KZT
NB: Altel/Tele2 are not active during March 2019 (even from Feb ‘19)
4. Competitive: Search Ads
70000COMPETITIVE:
SEARCH ADS
60000
50000
Beeline
40000
Altel
30000
March
56,40%- Wins
CTR: 28,18%
CPC: 41 KZT
Losing action due:
46,09% - Rating
2,64% - Budget
Kcell
Tele2
20000
10000
0
Jan 2019
Feb 2019
March Competitors search requests data is not available yet
We looked at the frequency of popular brand search requests – of Beeline and
competitors. As we can see Both Beeline and Altel go at the same level by
popularity of requests, while Tele2 goes significantly forward.
Beeline should work on the quality of landing pages, as the % of lost
impressions due to the rating is on average 46%. For certain campaign the
rate is over 70%.
5. SMM Analysis
SMM ANALYSIS©VEON Ltd 2016
6. Facebook presence
FACEBOOK PRESENCEData
Average Engagement Rate (%)
0.13%
0.29%
0.04%
0.02%
8%Number of followers
39 501
47 488
23 860
81 754
Likes
1 448
3 296
52
205
Comments
310
182
22
18
Shares
136
25
22
20
Average Likes (per publication)
40
132
6
14
Average Comments (per
publication)
9
7
2
1
Average Reposts (per
publication)
4
2
2
1
Number of publications
36
25
9
15
Source: popsters.com
Despite the average
number of followers,
Beeline page is one of
the most active Telecom
brand pages on the
platform.
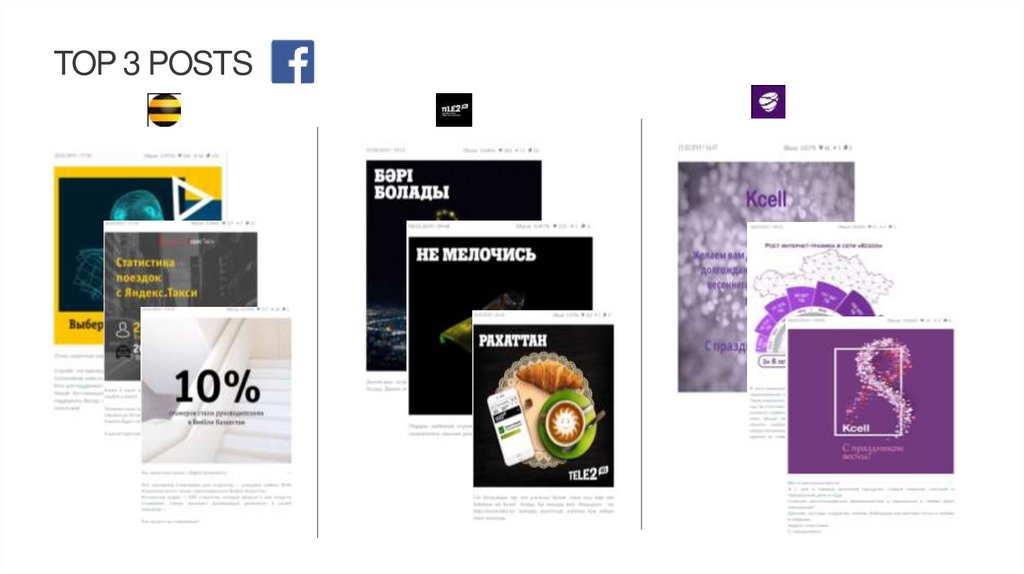
7.
TOP 3 POSTS8. instagram presence
INSTAGRAM PRESENCEData
Average Engagement Rate
(%)
0.34%
0.36%
0.20%
0.13%
Number of followers
130 729
100 722
119 883
120 562
Likes
14 048
8 611
6 796
5 707
Comments
1 393
510
679
254
Average Likes (per
publication)
413
344
227
159
Average Comments (per
publication)
41
20
23
7
Number of publications
34
25
30
36
8%
Source: popsters.com
Beeline is the leader
among the competitors
in terms of number of
followers and
engagement.
High engagement rate
on Tele2 page is due to
the lowest amount of
followers.
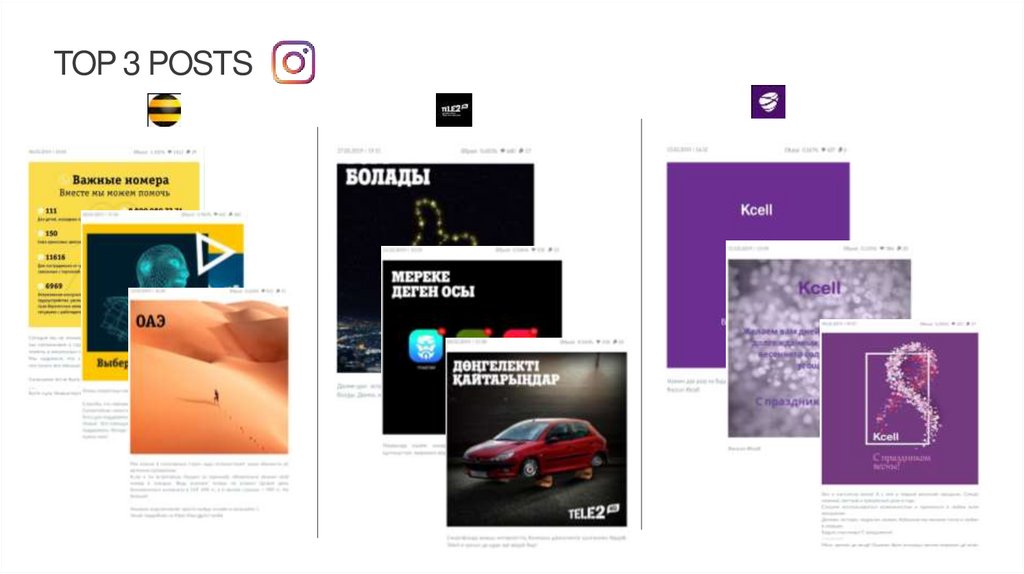
9.
TOP 3 POSTS10. VK presence
VK PRESENCEData
Average Engagement Rate
(%)
0.08%
0.19%
0.07%
Number of followers
62 420
78 456
69 161
Likes
1 161
2 645
103
Comments
730
1 203
282
Shares
40
14
11
Average Likes (per
publication)
32
106
13
Average Comments (per
publication)
20
48
35
Average Reposts (per
publication)
1
1
1
Number of publications
36
25
8
Views
211 094
698 411
31 867
8%
Source: popsters.com
Tele2 is the most
actively represented
brand on the platform.
The large number of
views is showing that
the brand uses a lot of
paid promotion.
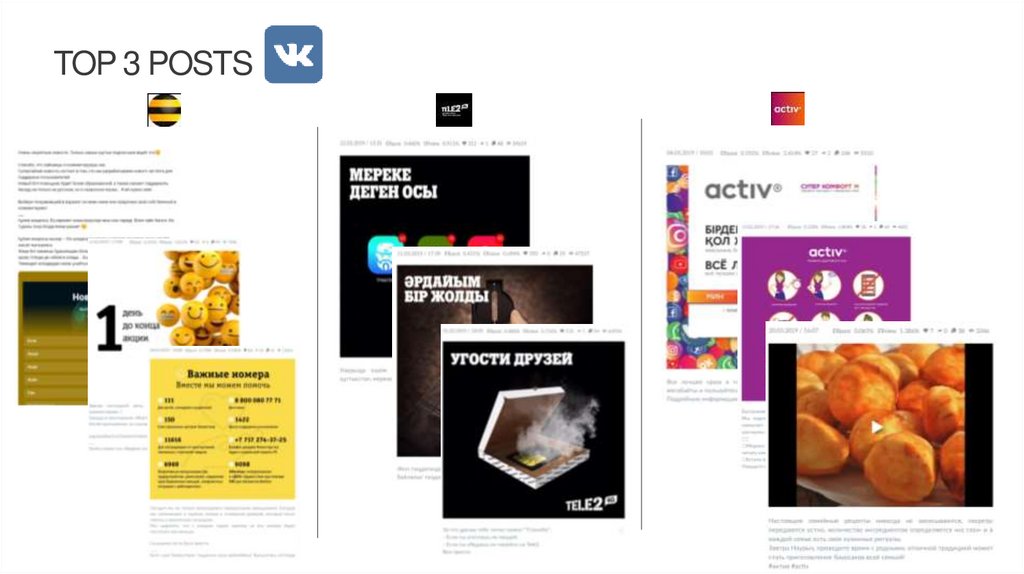
11.
TOP 3 POSTS12. learnings
LEARNINGS• Content strategy of the brands is quite similar – they use product and entertainment
content.
• The Instagram audience tend to be the most active for the communication
•8%
Tele2 communicate through the VK platform in the most active way among all the
competotors.
13. Thank you
THANK YOU©VEON Ltd 2016
13