

 mathematics
Similar presentations:

")
")


")

")
")
Measures of dispersion. Lecture 3
1.
2.
LECTURE 3MEASURES OF DISPERSION
Room: ATB 308
Office Hours:
by appointment
Saidgozi Saydumarov
Sherzodbek Safarov
QM Module Leaders
ssaydumarov@wiut.uz
s.safarov@wiut.uz
3.
Lecture outline:Range
Interquartile range
Variance
Standard Deviation
4.
Measures of dispersion• Dispersion measures how “spread out” the data is
• Shows how reliable our conclusions from the measures of location are
• The lower the dispersion the closer the data is bunched around the measure of
location
• Measures of dispersion are used by
• Economists to measure income inequality
• Quality control engineers to specify tolerances
• Investors to study price bubbles
• Gamblers to predict how much they might win or lose
• Pollsters to estimate margins of error
5.
Untabulated data6.
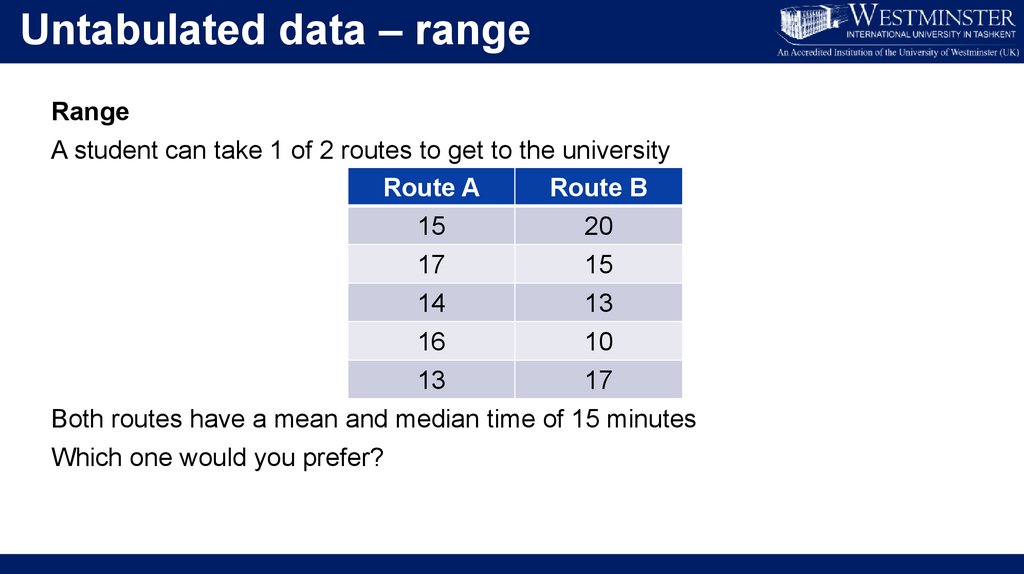
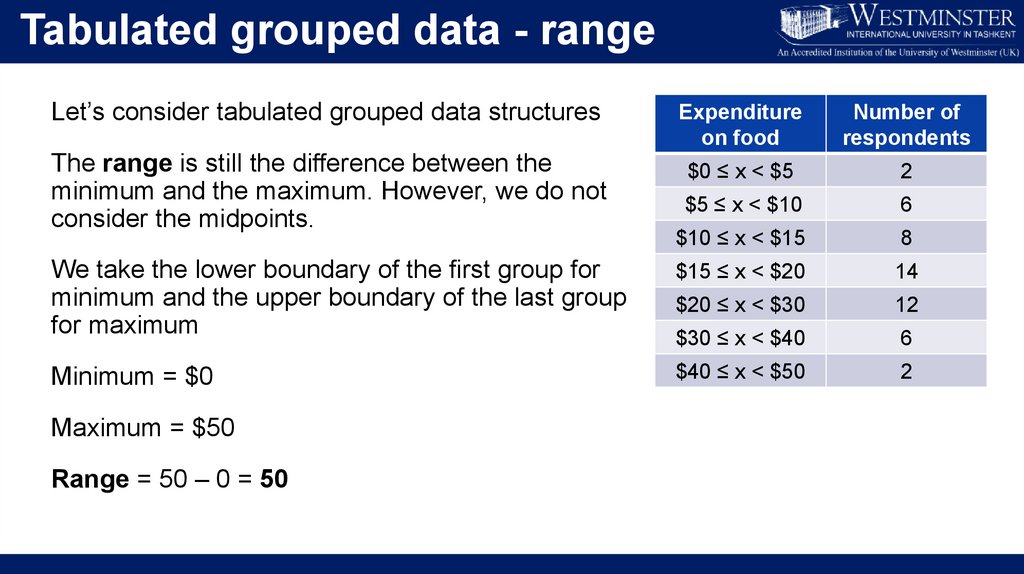
Untabulated data – rangeRange
A student can take 1 of 2 routes to get to the university
Route A
Route B
15
17
14
20
15
13
16
13
10
17
Both routes have a mean and median time of 15 minutes
Which one would you prefer?
7.
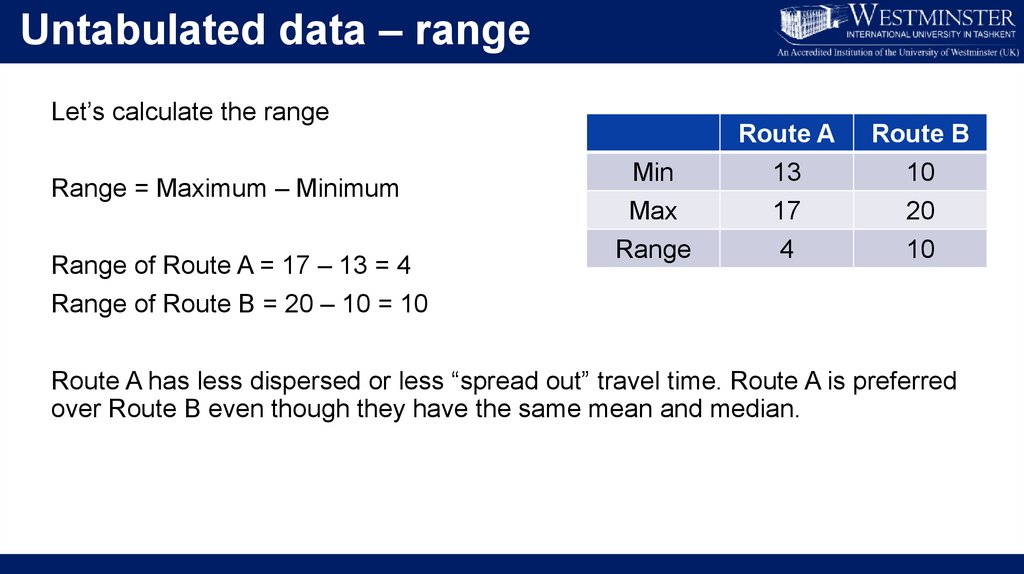
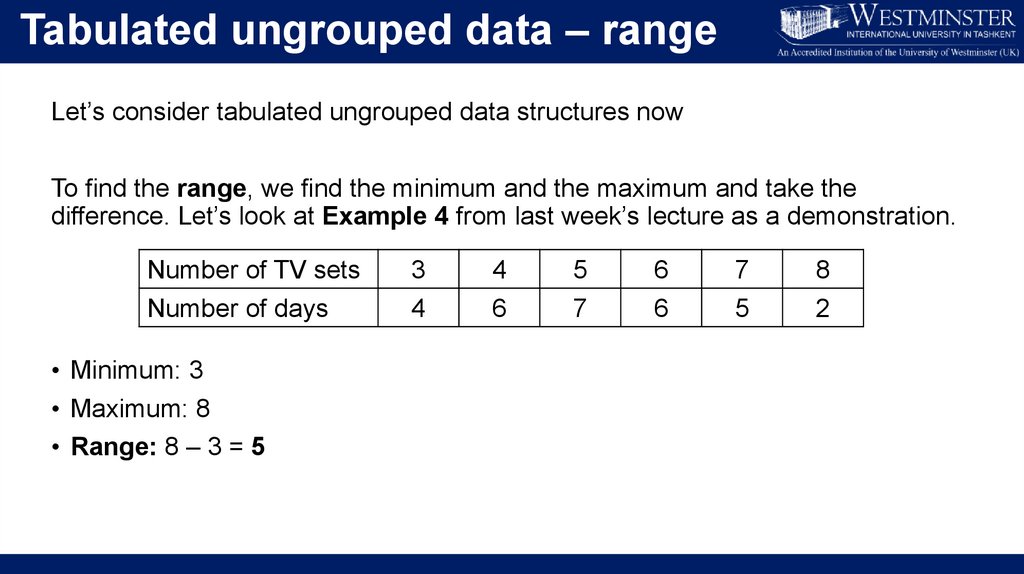
Untabulated data – rangeLet’s calculate the range
Range = Maximum – Minimum
Range of Route A = 17 – 13 = 4
Range of Route B = 20 – 10 = 10
Min
Max
Range
Route A
Route B
13
17
4
10
20
10
Route A has less dispersed or less “spread out” travel time. Route A is preferred
over Route B even though they have the same mean and median.
8.
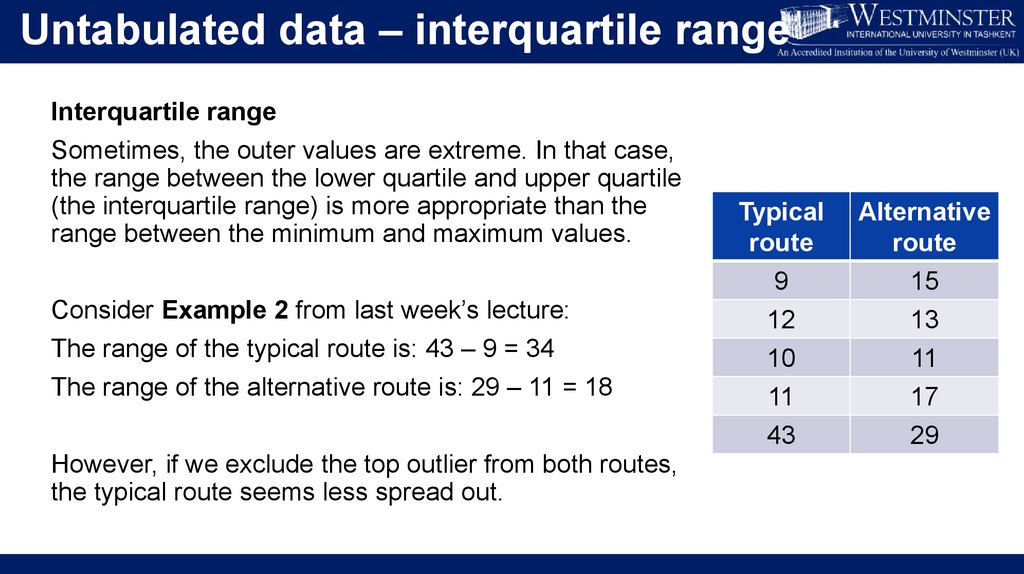
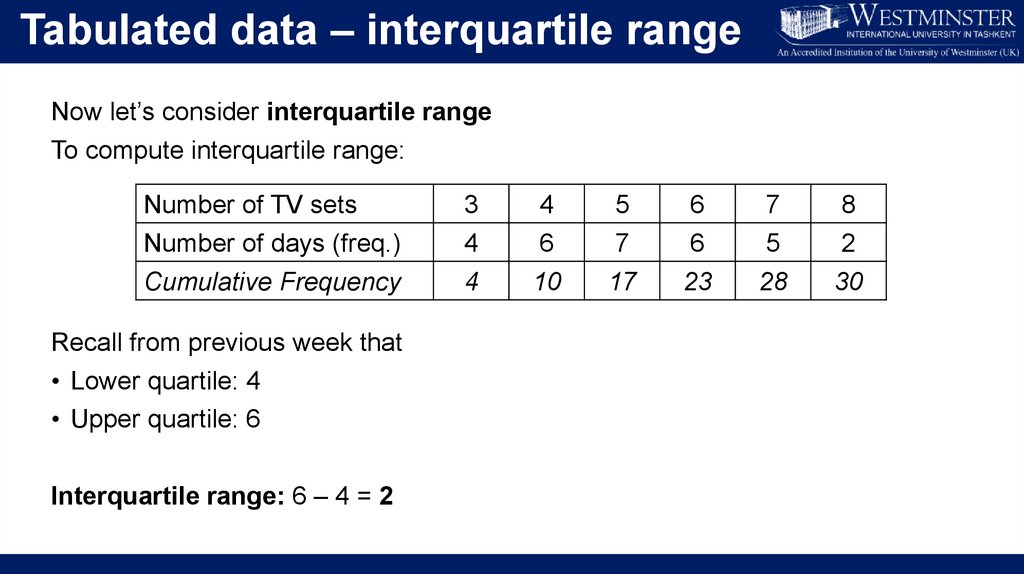
Untabulated data – interquartile rangeInterquartile range
Sometimes, the outer values are extreme. In that case,
the range between the lower quartile and upper quartile
(the interquartile range) is more appropriate than the
range between the minimum and maximum values.
Consider Example 2 from last week’s lecture:
The range of the typical route is: 43 – 9 = 34
The range of the alternative route is: 29 – 11 = 18
However, if we exclude the top outlier from both routes,
the typical route seems less spread out.
Typical
route
Alternative
route
9
12
10
15
13
11
11
43
17
29
9.
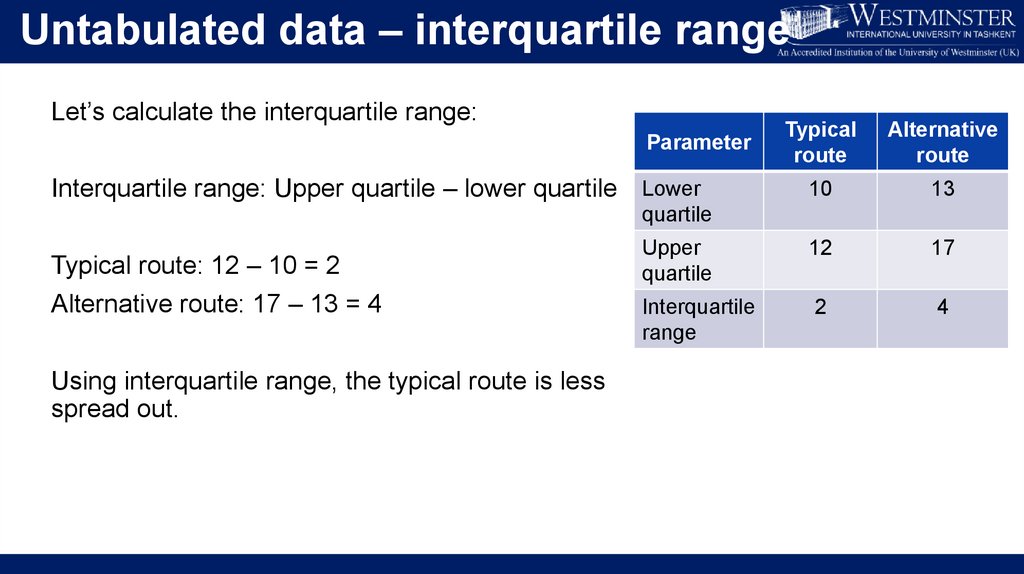
Untabulated data – interquartile rangeLet’s calculate the interquartile range:
Typical
route
Alternative
route
10
13
Upper
quartile
12
17
Interquartile
range
2
4
Parameter
Interquartile range: Upper quartile – lower quartile Lower
quartile
Typical route: 12 – 10 = 2
Alternative route: 17 – 13 = 4
Using interquartile range, the typical route is less
spread out.
10.
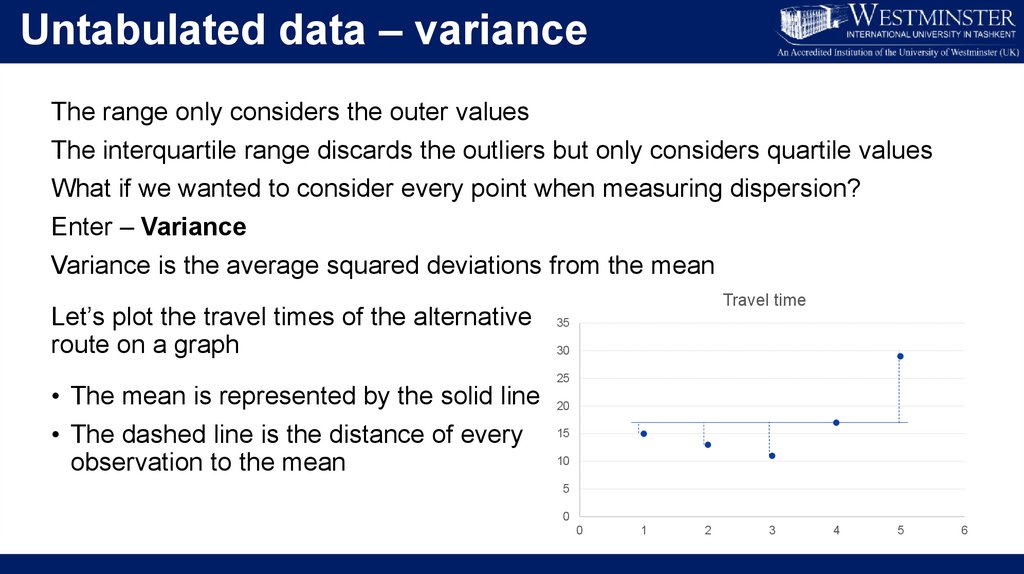
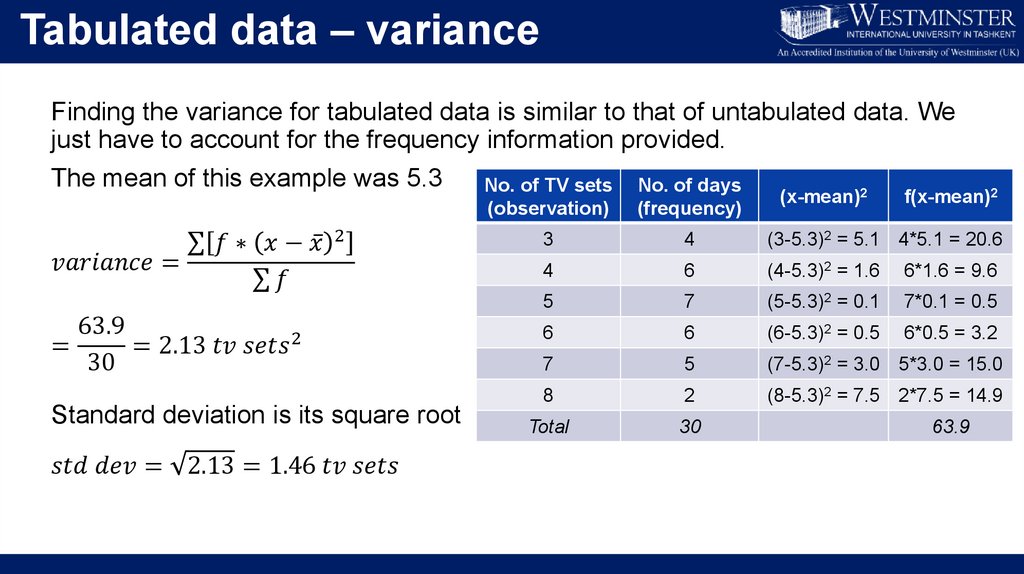
Untabulated data – varianceThe range only considers the outer values
The interquartile range discards the outliers but only considers quartile values
What if we wanted to consider every point when measuring dispersion?
Enter – Variance
Variance is the average squared deviations from the mean
Let’s plot the travel times of the alternative
route on a graph
• The mean is represented by the solid line
• The dashed line is the distance of every
observation to the mean
Travel time
35
30
25
20
15
10
5
0
0
1
2
3
4
5
6
11.
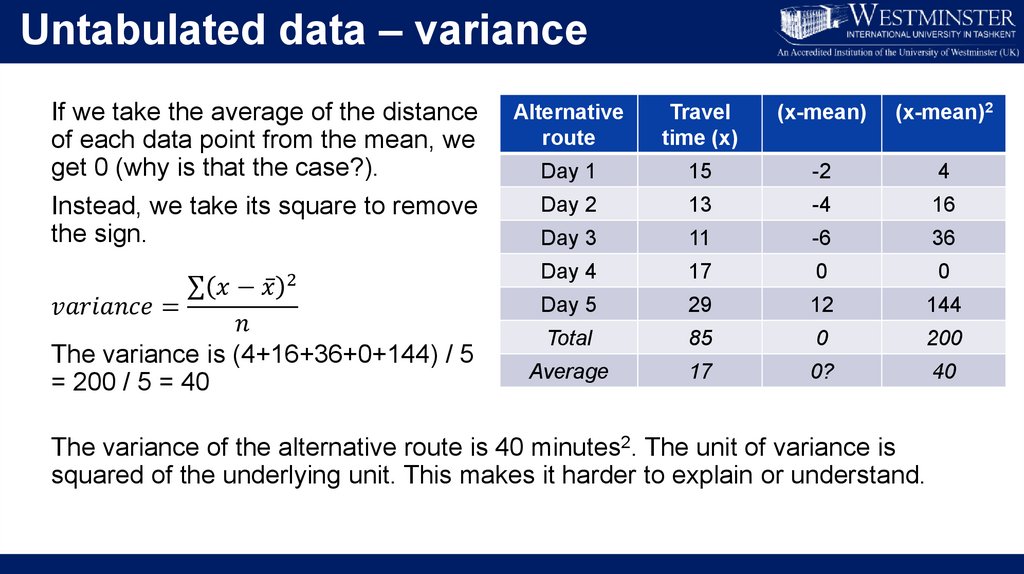
Untabulated data – varianceIf we take the average of the distance
of each data point from the mean, we
get 0 (why is that the case?).
Instead, we take its square to remove
the sign.
2
σ