


 business
Similar presentations:
")


Foodoo. Investment project
1.
FOODOOFOODOO
INVESTMENT
PROJECT
01
2.
CONTENT1. DEVELOPMENT PLAN
1.1 Foodoo - the introduction
1.2 Current Status
1.3 Company approach
1.4 Services in test mode
1.5 Road map
1.6 Objectives and Vision
2. MARKETING PLAN
2.1 Market analysis
2.1.1 Our competitors
2.2 Offer of unique value
2.3 Marketing Strategy
3. FINANCIAL PLAN
3.1 Unit economy
3.2 Investment proposal
3.3 Necessary funding
3.4 Financial Outlook
3.5 Income and expenses of future periods
3.6 Accounting policies and financial controls
3.7 Dividend policy
4. PRESENT RISKS
5. TEAM
6. LEGAL INFORMATION
7. CONCLUSION
3.
1. DEVELOPMENT PLAN1.1 Foodoo – the introduction.
Alexander Medvedev established Medvedev Prodigy Systems LLC in 2019 specifically to create and register
rights for Foodoo mobile app and other intellectual property in the catering area.
The idea to create the app came to him while he was working on his own chain of cafes –Holodilnik, with
Aeroloft restaurant and based on his own experience of eating out.
Catering is one of the most demanded services in the world. The market keeps growing every year and
reacts flexibly to customer expectations and needs. At the same time, it lags behind in terms of IT
innovations.
Research shows that there are no apps in the market that are able to provide both restaurants and guests
a complete package of services. At the moment remote services are only available to VIP guests, and to get
them they have to make a phone call to the restaurant.
Alexandr Medvedev | Founder
4.
1.2 Current StatusFoodoo is finished and functioning. We provide apps for Android and IOS and back-end and front-end, a
management system for restaurants and integration with iiko ERP system. R-keeper is under development.
The mobile application has all the available functions. The management system for restaurants is based on
surface-level analytics, which requires extension, the mobile app's interface and design require
improvement.
There are websites for restaurant guests, constructors and algorithms for the service implementation for
restaurants. So implementation does not require special skills.
The service logo and brand name were patented [patents of Russia No. 2019744725]. We are preparing
documents to patent a part of the app's original interface and design
5.
1.3 Company approachFOODOO can solve all the above problems of restaurant owners by means of complete integration of the
software with ERP (Enterprise Resource Planning) restaurant management system.
The system will collect and later analyse data about all orders for a particular guest. It will allow restaurants to
make effective TARGETED advertising for specific guests. As a result, they will get higher profits and reduce
marketing costs. At the moment, waiters and administrators have all information about guests and their
preferences. When they leave, information is lost. Also, the system can analyse the most and least popular
menu items and optimize menus to gain higher profits.
Second, a wide functionality of the mobile app will provide full information about the restaurant and
opportunity to book tables online, access menu and make orders. The app will replace waiters. All they need to
do will be to serve food.
Third, guests can manage their orders and bookings via the mobile app. As a result, the restaurant owners will
reduce salary budget and reduce the number of staff to cut costs.
Forth, guests can leave a tip directly through the app. Tips are a gist to the waiter, so they do not increase tax
burden of the restaurant. Working without paper bills and receipts is more attractive for waiters.
Fifth, restaurants can increase table turnover rate and reduce workload on the waiters. Guests will wait less
and get faster, higher quality service.
For the guests all solutions will be in a single mobile app.
Mobile app – user part. It provides extended functionality to guests. Let's see what it includes:
• Interactive map of the restaurants/cafes or list of places with user filters (rating, distance, free seats,
cuisine, average bill, etc.)
• Detailed information about the place. Information in the app is synchronized with changes in ERP
(Enterprise Resource Planning) system of the restaurant, so information is always up-to-date (photos,
layout, reviews, menu, prices, discounts, promotions)
• Choosing and booking a table for a particular time (based on the layout of the dining area, guests can select
a table at the window or in a quiet area)
• Full menu with pictures, photos, prices, recommendations, ingredients and calories.
• Order and pay food and drinks to take away.
• Delivery
• Making an order for a particular time, payment through the app.
• Making an order at the restaurant without calling a waiter
• Adding friends to a joint order
• Adding extra items without calling a waiter
• Making a bill in the app without calling a waiter, opportunity to split the bill based on particular dishes and
based on the amount
• Opportunity to leave a tip based on the percentage of the amount paid or a particular amount of tip
• Elements of a social network, making a list of friends and family, colleagues, sending push notifications,
invitations to events, to visit a restaurant including extra information, such as: address, name, time, table
number, theme of the event
• Making a bonus account due to cash-back, opportunity to pay orders using cash-back
• Opportunity to repeat or edit orders.
This functionality will allow guests to get full information about the place, book any table through the app. save
time by making pre-orders for a particular time and cutting time for communication with staff, also guests do
not have to attract the attention of the waiters. All loyalty systems are in one app.
6.
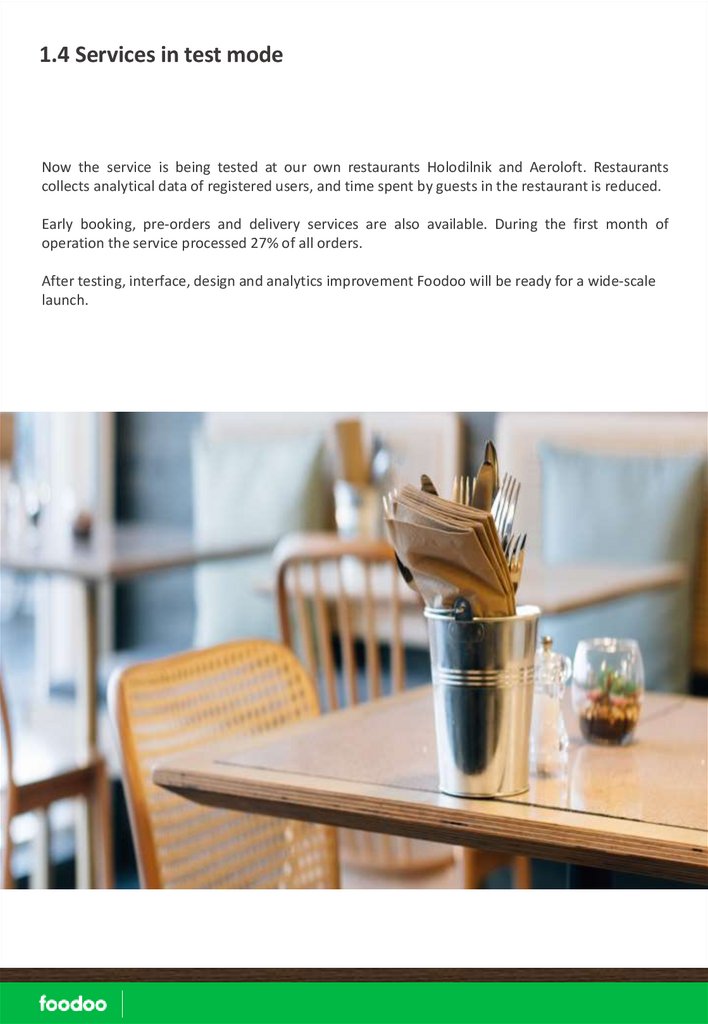
1.4 Services in test modeNow the service is being tested at our own restaurants Holodilnik and Aeroloft. Restaurants
collects analytical data of registered users, and time spent by guests in the restaurant is reduced.
Early booking, pre-orders and delivery services are also available. During the first month of
operation the service processed 27% of all orders.
After testing, interface, design and analytics improvement Foodoo will be ready for a wide-scale
launch.
7.
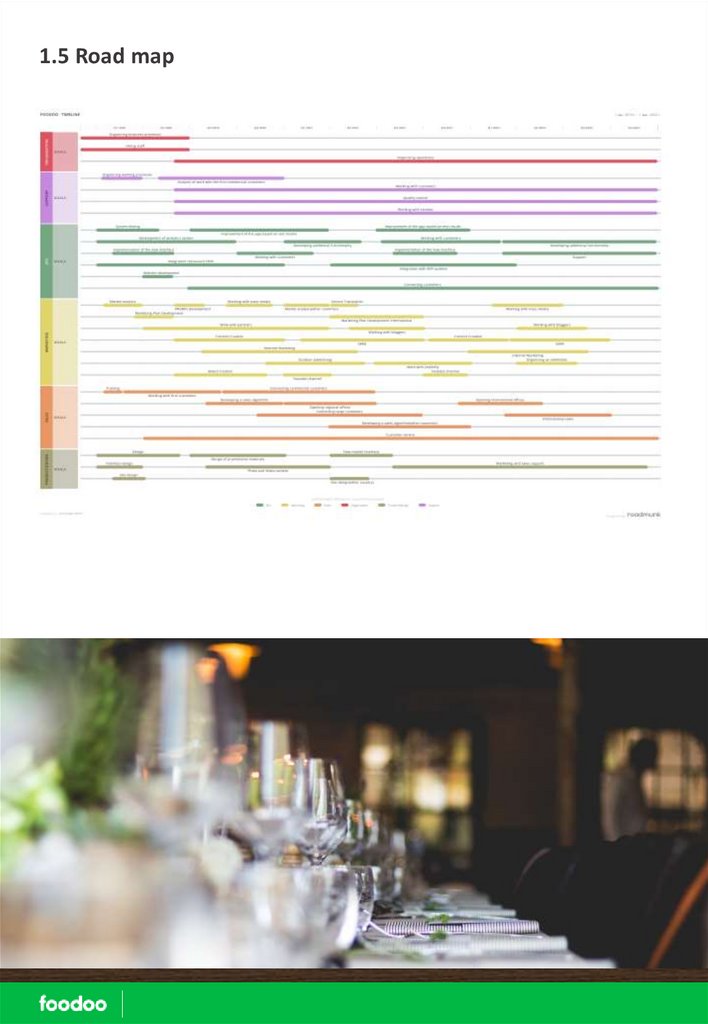
1.5 Road map8.
1.6 Objectives and VisionOur app is already used successfully by two restaurants – Holodilnik and Aeroflot. In January 2020
5 more cafes and restaurants in Perm city will be connected to it. Agreements are in place, at the
moment analysis of their IT structure is carried out in order to provide high quality connection.
Potential investors’ money will be used for a massive advertising campaign that will allow us to
enter the markets of major Russian cities, such as Perm, Yekaterinburg, Kazan, Saint Petersburg
and Moscow with the population over 1.5 million people. Also it will allow to expand the
functionality of the service to meet the needs of each customer in each region, and this shift the
service to a brand new level.
We plan to cover 15% of the Russian catering market turnover in 5 years by connecting 40% of all
Russian restaurants and cafes.
САНКТ-ПЕТЕРБУРГ
МОСКВА
КАЗАНЬ
ПЕРМЬ
ЕКАТЕРИНБУРГ
9.
2. MARKETING PLAN2.1 Market Analysis
The development of the catering segment is a socially important task at the macro level, as it indicates the
development of the country. At the micro level it is an indicator of the living standard.
Catering business in Russia suffered during the economic crisis in 2014–2016, but in 2017 it began to
recover showing 6.3% growth in revenue per year.
According to RBK.research, the Russian catering market will demonstrate growth rate of 6 to 8% per year,
unless new economic problems come up. The main drivers of the market will be high customer
confidence, higher incomes, increased living standards that promote the culture of eating out. The Rosstat
report shows that in 2018 the turnover of the industry grew by 6.5 % and amounted to $23,92 billion.
Revenues in the catering sector in Russia
2016 $21,12 billion.
2017 $22,46 billion.
2018 $23,92 billion.
Every year more and more companies enter the catering market. Consumers can choose from a greater
number of offers, so competition increases. To win this competitive battle, catering companies strive for
providing customers with products and services which satisfy their requirements and needs to the fullest
extent.
Digital technologies are an up-to-date tool that makes provision of products and services as convenient as
possible and is able to give the customer all information he needs. Digital technologies can also attract
guests making the process of purchasing goods or receiving services more fascinating and extraordinary.
Surveys show that 10% of orders in restaurants/cafes were made with the use of digital technologies such
as mobile apps, websites and terminals. Clients making online orders visit restaurants by 67% oftener that
others.
10.
According to LevelUp report, advance order function available in mobile apps or on websites of restaurantsgenerates about 5% of sales volume in the first three months after its integration.
LevelUp study shows that from 5% to 12% of customers accept an individual loyalty program of a
restaurant/cafe, 56% of respondents answered "very unlikely" and "no" to an offer to download an app for a
certain restaurant, and only 6% of the responses were positive. If a loyalty program has a mobile payment
function, the share of positive responses reaches 18–28%. With an added advance order function, this figure
goes up to 15–35%.
Recently, a lot of solutions were developed to help restaurant owners. As a rule, new technologies include IT
solutions for smartphones, tablets or computers at various stages of the company working processes. One of
the most popular is introduction of electronic menus. They provide an advantage of adding new items without
the need to re-print the paper menu. Also, they increase interest of the guests, because they can get
information about each dish.
Fast-food chains often use terminals to simplify selection of dishes and order placement. Information goes
directly into the system or to employees of the restaurant. McDonald’s was the first to introduce the new
system in the Russian market.
As popularity of smartphone and tablets grows, many restaurants develop their own mobile apps. Such apps
provide up-to-date information about all open locations in the chain (working hours, addresses), company
news, discounts and promotions, information about the loyalty program, bonus points.
In addition to mobile apps, there are mobile loyalty programs (MLP). Their advantage is absence of physical
loyalty cards. To take part in a loyalty program, it is necessary to install the app and use it for each order.
Another very simple innovation is the use of wireless buttons to call waiters. These buttons are installed on the
table, and waiters have a beeper to get signals from the buttons. A guest can call the waiter at any time without
the need to attract attention in other ways.
11.
2.1.1 Our competitorsThere are also two solutions in the Russian market: Foodle and SberFood.
SberFood
SberFood came to the market in 2019, when Sberbank acquired Plazius LLC with their mobile app.
Plazius was designed as a mobile loyalty platform, later it got the functions of making orders without a
waiter based on the restaurant table code, leaving tips and making pre-orders. Bonuses and cash-back
were calculated based on promo codes of each restaurant that had to be shown to the waiter. The system
is integrated with ERP, R-Keeper and Iiko. Such narrow functionality was not very popular in the industry,
at the moment 2000 restaurants in Russia are connected.
Sberbank kept the main idea of Plazius, but focused more on making pre-ordrs by changing pricing policy
for fixed monthly payments about 10,000 rubles and by adding a high commission (10% from each
booking and 10% from pre-orders) from each transaction through the app. Plazius cooperates with
Afisha.Restaurants and provides general information about all main popular restaurants and cafes.
SberFood functionality does not solve all problems of the guests and restaurants and is aimed at large
chains and big restaurants.
Foodle
Foodle has been in the market of Saint Petersburg since 2018 with less than 300 restaurants at the
moment. It does not provide integration with ERP systems, orders made in the app are transferred into
the restaurant using a support team, so human mistakes are possible. Foodle charges restaurants 10% of
all transactions through the service. Most of the announced functionality is not available. The announced
number of restaurants connected to the system is higher than the actual.
12.
Comparing Foodoo functionality with competitorsIndicator
Functions
Loyalty
Extra services
Integration
Foodoo
SberFood
Foodle
Information about the restaurant
v
v
v
Map of restaurants in the system
v
v
v
Interactive map showing seat availability
v
x
x
Making a call
v
v
v
All cafes/restaurants of the chain
v
v
v
News and promos
v
v
v
Pre-order
v
v
v
Comments to the order
v
v
v
Payment
v
v
v
Layout
v
x
x
Table reservation
v
v
v
Choice of particular table
v
x
x
Menu download
v
v
v
Recommendations to menu
v
x
x
Details about ingredients
v
v
x
Making orders in the restaurant
v
v
v
Split the bill
v
v
v
Joint order
v
v
x
Repeat order (including edit function)
v
x
x
Hookah constructor
v
x
x
Leave tips
v
v
v
List of friends
v
x
x
Invite friends (push)
v
x
x
Make a menu based on preferences
v
x
x
Delivery
v
x
x
Reviews
v
v
v
Promos
v
v
x
Cash-back, levels
3
3
x
Automatic cash-back without entering a code
v
x
x
Special offers from restaurants
v
v
x
Marking a restaurant on the map
v
x
x
Marking a restaurant as recommended
v
x
x
Integration with ERP
v
v
x
13.
Cost of services:Service
Foodoo
SberFood
Foodle
Booking
Free
10%
Free
Pre-order
3%
10%
10%
Loyalty program
Free
$30
no
Promos
Free
$77
no
Mailings and analytics
Free
$77
no
Mobile payment
Free
Relatively
free
Free
Wallet
Free
$15
no
In monthly equivalent, costs of using a service look like this:
Average monthly turnover of a restaurant in Russia
$21 920
Commission per month (25% of
turnover through the app)
Fixed payments
TOTAL
Foodoo
SberFood
Foodle
$164
$548
$548
no
$170
(package
discount)
no
$164
$718
$548
Advantage of competitors is that they are already present in the market, have a customer base
and user base. Our advantage is full functionality, integration with ERP, possibility to use for cafes
and restaurants of any size and format, low commission of 3% and extra privileges for restaurants
and mobile app users.
14.
2.2 Offer of uniqe valueFooDoo can be used in restaurants/cafes with different cuisine, floor space and price levels. It will
implement new and unique functions to provide high-quality and advanced services to its users:
Full analytics
Direct mailing
Advertising inside the app
Integration with ERP systems
Interactive map
Full-featured booking of tables
Layout of restaurants showing location of tables and windows / WC / bar / entrance / exit
Possibility to make orders for delivery
Orders and follow-up orders in the app
List of friends
Hookah constructor
FooDoo – is a new way of getting a traditional service!
2.3 Marketing Strategy
According to surveys, the most effective advertising channels for IT products are promotion on the
Internet, at exhibitions and through sales agents. Outdoor advertisements are not so effective, but their
continuous presence all around customers and users forms positive opinions and brand's perception and
awareness.
When developing a marketing strategy, main attention will be paid to the quality of leads rather than their
quantity, in order to improve sales department performance. Focusing on qualitative audience provides
better heating up of customers and allows to speed up their journey through a sales funnel and prepare
them for making a deal.
The most effective and popular advertising channels on the Internet are search engine advertising, search
queries, retargeting and advertisements in Instagram, YouTube and Facebook.
Advertising at specialized exhibitions pursues different goals, including the following: image-building
(image formation / sustaining), marketing (marketing intelligence and promotion) and commercial (search
and attraction of new partners / customers).
All restaurants use ERP systems distributed by regional dealers by franchising. That's why one of the main
distribution channels of Foodoo is a partner program based on agency contracts. This channel has its own
client base, and all new restaurants/cafes apply for equipment and software before opening. Partnership
with Foodoo is an additional source of revenue.
To involve the market majors, it is planned to interact with media personalities of the market and
celebrities.
15.
3. FINANCIAL PLAN3.1 Unit economy
16.
3.2 Investment proposalTo implement the project in Russia, the company needs investment
in the amount of $10 000 000
This amount in required to provide brand recognition, create a high quality product, provide integration with
ERP systems and build a strong sales team. Special attention will be paid to marketing and advertising. After 3
investment rounds, 13 000 customers will be connected to the app.
3 investment rounds are planned
• $3 756 267 The first round of investment will help us build our brand, move the app to the new level,
and launch it in all major regions of Russia.
• $4 576 189 The second round will allow us to get a dominating position in the area.
• $1 667 543
The third round will support active development of the service until it reaches the payback
point.
The investor who will be ready to Finance the first stage is offered a 10% stake in the company in the first
round of financing and special conditions for entering the second round. In the second round, when the full
amount is closed, the investor is offered another 15% of the company. The third round of investments is
equivalent to a 5% stake. In total, after three rounds, the investor will be able to dispose of a 40% stake in the
company.
3.3 Necessary funding
Operational costs
Salary budget
Taxes
Administration
2020
2021
2022
$3 756 267
$4 576 189
$1 667 543
$1 307 030
$2 000 000
$973 841
$574 072
$878 863
$424 904
$1 875 165
$1 697 326
$268 798
TOTAL: $10 000 000
Due to this investment, the company will be able to get a dominating position in the market by 2021 and
achieve payback point in 2022.
P.S. The exact amounts may vary due to external factors. However, the budget will not increase.
17.
3.4 Financial OutlookFinancial plan of the company is made for five years. It is based on the expected annual growth of the Russian
catering market by 5% and gradual involvement of restaurants into the service. The number of connected
customers and payments through the service in the first year is estimated as 25%, in the fifth year as 40%.
Research has shown that up to 85% of payments in the catering sector are non-cash, some of them will be done
through the app.
Company profit estimation is based on the commission of 3%. This will be the most attractive offer in the
market. Competitors charge over 10% at the moment. It will allow to attract a maximum number of clients and
users in a short time and at more fair and competitive conditions. Therefore, company income depends on the
following 3 main factors:
• volume of the covered market;
• share of payments through the app;
• commission of the service.
We can influence each of these factors separately and thus
manage the company income
Revenues in the catering sector
year
billion $
growth
Revenues of fast food cafes
Target
turnover
billion $
billion $
2015
20,48
6,00%
6,14
14,34
2016
21,12
3,10%
6,33
14,78
2017
22,46
6,37%
6,74
15,72
2018
23,92
6,49%
7,18
16,74
2019
25,19
5,30%
7,56
17,63
2020 plan
26,45
5,00%
7,93
18,51
2021 plan
27,77
5,00%
8,33
19,44
2022 plan
29,16
5,00%
8,75
20,41
2023 plan
30,62
5,00%
9,18
21,43
2024 plan
32,15
5,00%
9,64
22,50
18.
According to the Russian Statistics Agency, there are about 100 thousand restaurants and cafes in Russia, 30%of them are fast-food cafes.
Our figures do not include fast-food cafes, because they are not our target customers since there is no need to
book a particular table.
However, making orders through the app may be a demanded service, because there are lines in rush hours at
the cashier desks. If customers make a pre-order, they can collect a prepared and packed order without waiting
in line.
Based on the above figures. the average annual revenue of one cafe / restaurant in $263 040, and average
monthly revenue is $21 920. The average bill is $16 per customer. We will use these figures to calculate the
required number of cafes / restaurants and users in the system to achieve the expected economic indicators.
Calculations were based on the Russian taxation system: VAT – 20%. Profit tax – 13.5%. This indicator is
different from the average Russian (20%), because our company is a resident of the TechoPark, which allows us
to get tax benefits. Other tax benefits are possible if the company is registered in the Ministry of
Communications, including reduction of the VAT rate down to 0% and reduction of social security payments
rate for employees.
By the end of January 2020, we plan to connect 20 partner testers to the system. The partners will have
preferential conditions for maintenance during the first year of operation and everlasting favourable terms of
cooperation.
The estimated number of partners in various regions and cities of Russia is 100. Involvement of partners and
advertising cooperation for partners' benefit and with the use of their facilities will attract the first users to the
system. Programs motivating users to download the app and register in it will maintain and enhance this effect.
Great increase of the number of users in the system will allow us to start cooperating under commercial
conditions, as where there's demand, there's supply.
19.
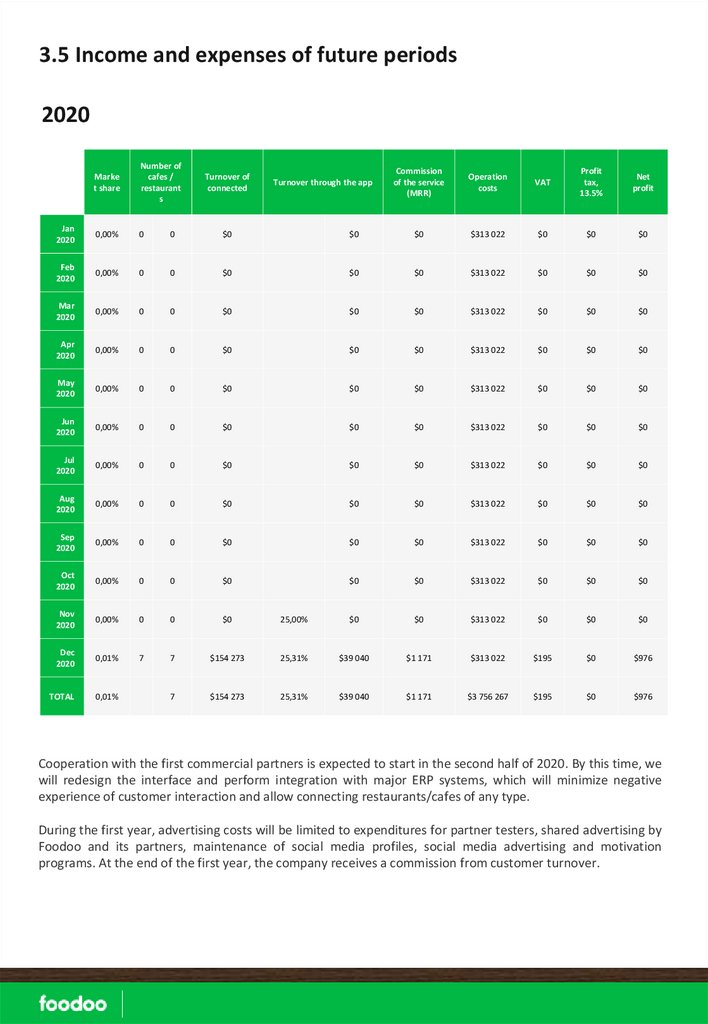
3.5 Income and expenses of future periods2020
Marke
t share
Number of
cafes /
restaurant
s
Jan
2020
0,00%
0
0
$0
Feb
2020
0,00%
0
0
Mar
2020
0,00%
0
Apr
2020
0,00%
May
2020
Commission
of the service
(MRR)
Operation
costs
VAT
Profit
tax,
13.5%
Net
profit
$0
$0
$313 022
$0
$0
$0
$0
$0
$0
$313 022
$0
$0
$0
0
$0
$0
$0
$313 022
$0
$0
$0
0
0
$0
$0
$0
$313 022
$0
$0
$0
0,00%
0
0
$0
$0
$0
$313 022
$0
$0
$0
Jun
2020
0,00%
0
0
$0
$0
$0
$313 022
$0
$0
$0
Jul
2020
0,00%
0
0
$0
$0
$0
$313 022
$0
$0
$0
Aug
2020
0,00%
0
0
$0
$0
$0
$313 022
$0
$0
$0
Sep
2020
0,00%
0
0
$0
$0
$0
$313 022
$0
$0
$0
Oct
2020
0,00%
0
0
$0
$0
$0
$313 022
$0
$0
$0
Nov
2020
0,00%
0
0
$0
25,00%
$0
$0
$313 022
$0
$0
$0
Dec
2020
0,01%
7
7
$154 273
25,31%
$39 040
$1 171
$313 022
$195
$0
$976
TOTAL
0,01%
7
$154 273
25,31%
$39 040
$1 171
$3 756 267
$195
$0
$976
Turnover of
connected
Turnover through the app
Cooperation with the first commercial partners is expected to start in the second half of 2020. By this time, we
will redesign the interface and perform integration with major ERP systems, which will minimize negative
experience of customer interaction and allow connecting restaurants/cafes of any type.
During the first year, advertising costs will be limited to expenditures for partner testers, shared advertising by
Foodoo and its partners, maintenance of social media profiles, social media advertising and motivation
programs. At the end of the first year, the company receives a commission from customer turnover.
20.
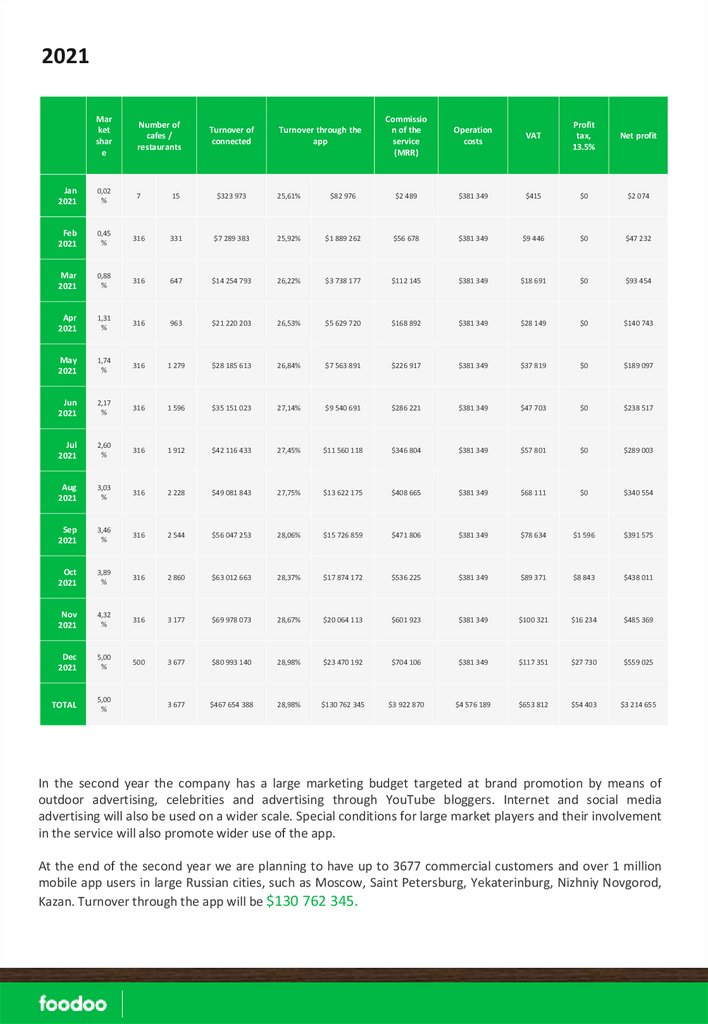
2021Mar
ket
shar
e
Number of
cafes /
restaurants
Commissio
n of the
service
(MRR)
Operation
costs
VAT
Profit
tax,
13.5%
Net profit
Jan
2021
0,02
%
7
15
$323 973
25,61%
$82 976
$2 489
$381 349
$415
$0
$2 074
Feb
2021
0,45
%
316
331
$7 289 383
25,92%
$1 889 262
$56 678
$381 349
$9 446
$0
$47 232
Mar
2021
0,88
%
316
647
$14 254 793
26,22%
$3 738 177
$112 145
$381 349
$18 691
$0
$93 454
Apr
2021
1,31
%
316
963
$21 220 203
26,53%
$5 629 720
$168 892
$381 349
$28 149
$0
$140 743
May
2021
1,74
%
316
1 279
$28 185 613
26,84%
$7 563 891
$226 917
$381 349
$37 819
$0
$189 097
Jun
2021
2,17
%
316
1 596
$35 151 023
27,14%
$9 540 691
$286 221
$381 349
$47 703
$0
$238 517
Jul
2021
2,60
%
316
1 912
$42 116 433
27,45%
$11 560 118
$346 804
$381 349
$57 801
$0
$289 003
Aug
2021
3,03
%
316
2 228
$49 081 843
27,75%
$13 622 175
$408 665
$381 349
$68 111
$0
$340 554
Sep
2021
3,46
%
316
2 544
$56 047 253
28,06%
$15 726 859
$471 806
$381 349
$78 634
$1 596
$391 575
Oct
2021
3,89
%
316
2 860
$63 012 663
28,37%
$17 874 172
$536 225
$381 349
$89 371
$8 843
$438 011
Nov
2021
4,32
%
316
3 177
$69 978 073
28,67%
$20 064 113
$601 923
$381 349
$100 321
$16 234
$485 369
Dec
2021
5,00
%
500
3 677
$80 993 140
28,98%
$23 470 192
$704 106
$381 349
$117 351
$27 730
$559 025
TOTAL
5,00
%
3 677
$467 654 388
28,98%
$130 762 345
$3 922 870
$4 576 189
$653 812
$54 403
$3 214 655
Turnover of
connected
Turnover through the
app
In the second year the company has a large marketing budget targeted at brand promotion by means of
outdoor advertising, celebrities and advertising through YouTube bloggers. Internet and social media
advertising will also be used on a wider scale. Special conditions for large market players and their involvement
in the service will also promote wider use of the app.
At the end of the second year we are planning to have up to 3677 commercial customers and over 1 million
mobile app users in large Russian cities, such as Moscow, Saint Petersburg, Yekaterinburg, Nizhniy Novgorod,
Kazan. Turnover through the app will be $130 762 345.
21.
2022Market
share
Number of cafes
/ restaurants
Turnover
of
connected
Turnover through the
app
Commission
of the
service
(MRR)
Operation
costs
VAT
Profit
tax,
13.5%
Net
profit
Jan
2022
7,08%
1 531
5 207
$120 420 600
29,28%
$35 263 968
$1 057 919
$367 388
$176 320
$69 419
$812 181
Feb
2022
9,16%
1 530
6 737
$155 798 403
29,59%
$46 100 748
$1 383 022
$367 388
$230 504
$105 993
$1 046 526
Mar
2022
11,24%
1 530
8 267
$191 176 207
29,90%
$57 154 039
$1 714 621
$367 388
$285 770
$143 298
$1 285 553
Apr
2022
13,32%
1 530
9 797
$226 554 010
30,20%
$68 423 842
$2 052 715
$367 388
$342 119
$181 333
$1 529 263
May
2022
15,40%
1 530
11 327
$261 931 813
30,51%
$79 910 158
$2 397 305
$367 388
$399 551
$220 099
$1 608 258
Jun
2022
17,48%
1 530
12 857
$297 309 617
30,81%
$91 612 985
$2 748 390
$367 388
$458 065
$259 596
$1 663 340
Jul
2022
19,56%
1 530
14 386
$332 687 420
31,12%
$103 532 325
$3 105 970
$367 388
$517 662
$299 824
$1 921 096
Aug
2022
21,64%
1 530
15 916
$368 065 224
31,43%
$115 668 177
$3 470 045
$367 388
$578 341
$340 783
$2 183 534
Sep
2022
23,72%
1 530
17 446
$403 443 027
31,73%
$128 020 541
$3 840 616
$367 388
$640 103
$382 472
$2 450 654
Oct
2022
25,80%
1 530
18 976
$438 820 830
32,04%
$140 589 418
$4 217 683
$367 388
$702 947
$424 892
$2 722 456
Nov
2022
27,88%
1 530
20 506
$474 198 634
32,34%
$153 374 806
$4 601 244
$367 388
$766 874
$468 043
$2 998 940
Dec
2022
29,96%
1 530
22 036
$509 576 437
32,65%
$166 376 707
$4 991 301
$367 388
$831 884
$511 924
$3 280 106
22 036
$3 779 982 222
32,65%
$1 186 027 714
$35 580 831
$4 408 655
$5 930 139
$3 407 675
$23 501 906
TOTAL
29,96%
The company will achieve its full operating capacity in the third year, the number of employees in every
department will be at its peak. Convenience of use and popularity of the app among users will drive natural
promotion of the app among both customers and restaurants. Marketing Department will finish analysing
foreign markets by the end of the third year and make a marketing and strategic plan for scaling the project.
Advertising costs: in year three we are planning to have a theme exhibition IT in Catering. We will focus on
advertising in social media, YouTube and advertising targeted at brand recognition and brand promotion.
Translation to other languages will attract foreign users and tourists in the local market and will promote the
company's expansion to the US and European markets. By the end of the third year over 22 036 cafes and
restaurants will be connected to the service. Turnover through the app will be $1 186 027 714.
22.
2023Mar
ket
shar
e
Number of cafes /
restaurants
Turnover of
connected
Turnover through the app
Commission
of the
service
(MRR)
Operation
costs
VAT
Profit tax,
13.5%
Net profit
Jan
2023
30,4
%
336
22 372
$543 270 393
32,9
%
$179 040 191
$5 371 206
$404 127
$895 201
$549 704
$3 522 174
Feb
2023
30,8
%
309
22 681
$550 771 168
33,2
%
$183 197 506
$5 495 925
$404 127
$915 988
$563 734
$3 612 076
Mar
2023
31,2
%
309
22 990
$558 271 942
33,5
%
$187 400 726
$5 622 022
$404 127
$937 004
$577 920
$3 702 971
Apr
2023
31,6
%
309
23 298
$565 772 717
33,8
%
$191 649 850
$5 749 496
$404 127
$958 249
$592 261
$3 794 858
May
2023
32,1
%
309
23 607
$573 273 492
34,1
%
$195 944 879
$5 878 346
$404 127
$979 724
$606 757
$3 887 738
Jun
2023
32,5
%
309
23 916
$580 774 266
34,4
%
$200 285 814
$6 008 574
$404 127
$1 001 429
$621 408
$3 981 611
Jul
2023
32,9
%
309
24 225
$588 275 041
34,7
%
$204 672 652
$6 140 180
$404 127
$1 023 363
$636 213
$4 076 476
Aug
2023
33,3
%
309
24 534
$595 775 816
35,1
%
$209 105 396
$6 273 162
$404 127
$1 045 527
$651 174
$4 172 335
Sep
2023
33,7
%
309
24 843
$603 276 590
35,4
%
$213 584 044
$6 407 521
$404 127
$1 067 920
$666 289
$4 269 185
Oct
2023
34,2
%
309
25 152
$610 777 365
35,7
%
$218 108 597
$6 543 258
$404 127
$1 090 543
$681 559
$4 367 029
Nov
2023
34,6
%
309
25 461
$618 278 140
36,0
%
$222 679 055
$6 680 372
$404 127
$1 113 395
$696 985
$4 465 865
Dec
2023
35,0
%
309
25 770
$625 778 914
36,3
%
$227 295 417
$6 818 863
$404 127
$1 136 477
$712 565
$4 565 694
TOTAL
35,0
%
25 770
$7 014 295 845
36,3
%
$2 432 964 127
$72 988 924
$4 849 521
$12 164 821
$7 556 569
$48 418 014
During its fourth year, the company will firmly establish itself in the Russian market and will have connected 26
000 cafes and restaurants to Foodoo service. The majority of connection will happen naturally. Requests of
guests will drive restaurants and cafes to used the app. Another sales channel will be our own Sales
Department and partner programs. Developers Team will implement new functions, improve the interface and
mobile app design to keep users interest.
The company is planning to enter the US and European markets. Now they are not taken into account due to
lack of analytics.
23.
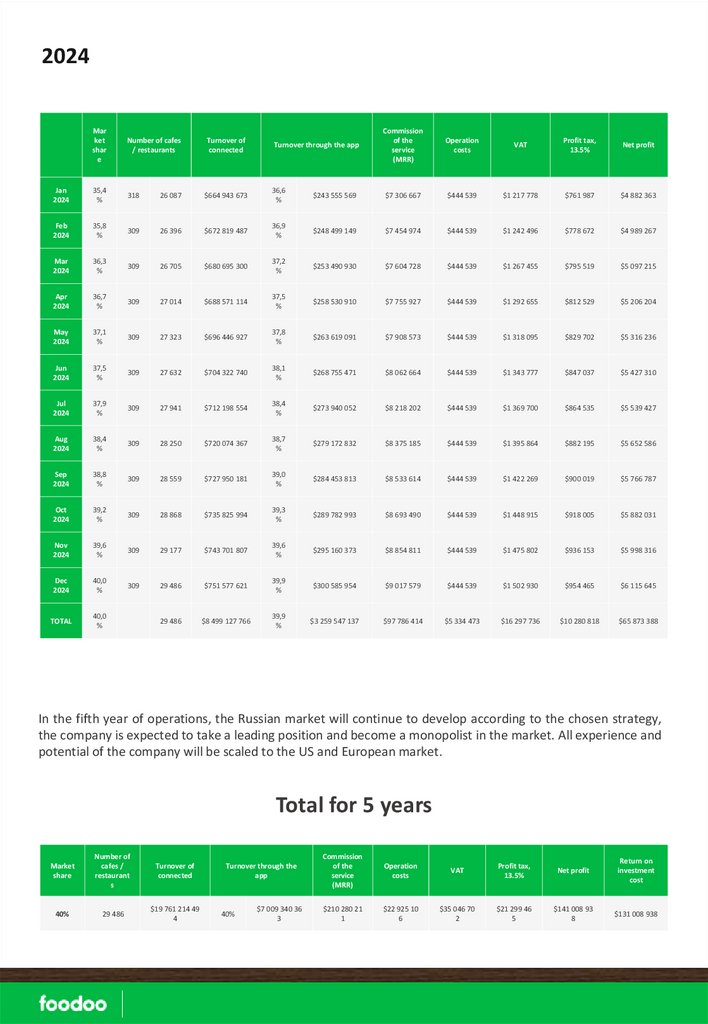
2024Mar
ket
shar
e
Number of cafes
/ restaurants
Turnover of
connected
Turnover through the app
Commission
of the
service
(MRR)
Operation
costs
VAT
Profit tax,
13.5%
Net profit
Jan
2024
35,4
%
318
26 087
$664 943 673
36,6
%
$243 555 569
$7 306 667
$444 539
$1 217 778
$761 987
$4 882 363
Feb
2024
35,8
%
309
26 396
$672 819 487
36,9
%
$248 499 149
$7 454 974
$444 539
$1 242 496
$778 672
$4 989 267
Mar
2024
36,3
%
309
26 705
$680 695 300
37,2
%
$253 490 930
$7 604 728
$444 539
$1 267 455
$795 519
$5 097 215
Apr
2024
36,7
%
309
27 014
$688 571 114
37,5
%
$258 530 910
$7 755 927
$444 539
$1 292 655
$812 529
$5 206 204
May
2024
37,1
%
309
27 323
$696 446 927
37,8
%
$263 619 091
$7 908 573
$444 539
$1 318 095
$829 702
$5 316 236
Jun
2024
37,5
%
309
27 632
$704 322 740
38,1
%
$268 755 471
$8 062 664
$444 539
$1 343 777
$847 037
$5 427 310
Jul
2024
37,9
%
309
27 941
$712 198 554
38,4
%
$273 940 052
$8 218 202
$444 539
$1 369 700
$864 535
$5 539 427
Aug
2024
38,4
%
309
28 250
$720 074 367
38,7
%
$279 172 832
$8 375 185
$444 539
$1 395 864
$882 195
$5 652 586
Sep
2024
38,8
%
309
28 559
$727 950 181
39,0
%
$284 453 813
$8 533 614
$444 539
$1 422 269
$900 019
$5 766 787
Oct
2024
39,2
%
309
28 868
$735 825 994
39,3
%
$289 782 993
$8 693 490
$444 539
$1 448 915
$918 005
$5 882 031
Nov
2024
39,6
%
309
29 177
$743 701 807
39,6
%
$295 160 373
$8 854 811
$444 539
$1 475 802
$936 153
$5 998 316
Dec
2024
40,0
%
309
29 486
$751 577 621
39,9
%
$300 585 954
$9 017 579
$444 539
$1 502 930
$954 465
$6 115 645
TOTAL
40,0
%
29 486
$8 499 127 766
39,9
%
$3 259 547 137
$97 786 414
$5 334 473
$16 297 736
$10 280 818
$65 873 388
In the fifth year of operations, the Russian market will continue to develop according to the chosen strategy,
the company is expected to take a leading position and become a monopolist in the market. All experience and
potential of the company will be scaled to the US and European market.
Total for 5 years
Market
share
Number of
cafes /
restaurant
s
Turnover of
connected
40%
29 486
$19 761 214 49
4
Turnover through the
app
40%
$7 009 340 36
3
Commission
of the
service
(MRR)
Operation
costs
VAT
Profit tax,
13.5%
Net profit
Return on
investment
cost
$210 280 21
1
$22 925 10
6
$35 046 70
2
$21 299 46
5
$141 008 93
8
$131 008 938
24.
20202021
2022
2023
2024
TOTAL
Years
Annual revenue of the sector
$18 512 717 623
$19 438 353 504
$20 410 271 180
$21 430 784 739
$22 502 323 975
0,01%
5,00%
30%
35%
40%
$154 273
$467 654 388
$3 779 982 222
$7 014 295 845
$8 499 127 766
25%
29%
33%
36%
40%
$39 040
$130 762 345
$1 186 027 714
$2 432 964 127
$3 259 547 137
$0
$0
$0
$0
$0
$1 171
$3 922 870
$35 580 831
$72 988 924
$97 786 414
$210 280 211
Investment
$3 756 267
$4 576 189
$1 667 543
$0
$0
$10 000 000
Operational costs
$3 756 267
$4 576 189
$4 408 655
$4 849 521
$5 334 473
$22 925 106
$1 307 030
$2 000 000
$2 574 644
$2 832 108
$3 115 319
$11 829 101
$574 072
$878 863
$1 123 362
$1 235 698
$1 359 268
$5 171 264
$1 875 165
$1 697 326
$710 650
$781 715
$859 886
$5 924 742
$195
$653 812
$5 930 139
$12 164 821
$16 297 736
$35 046 702
$0
$54 403
$3 407 675
$7 556 569
$10 280 818
$21 299 465
Net profit
$976
$3 214 655
$23 501 906
$48 418 014
$65 873 388
$141 008 938
Dividend tax, 15%
$146
$482 198
$3 525 286
$7 262 702
$9 881 008
$21 151 341
Dividends
$830
$2 732 457
$19 976 620
$41 155 312
$55 992 379
$119 857 598
-$3 490 264
$3 269 552
$62 344 352
$136 278 806
$184 903 882
Market share at the end of the
year
Customers' turnover at the end
of the year
Turnover through the app at the
end of the year
Share of turnover through the
app to total catering turnover
Commission of the service
Salary budget
Taxes
Administration
VAT
Profit tax, 13.5%
EBITDA
$7 009 340 363
25.
Technical Support TeamYear 1
Year 2
Year 3
Year 4
Year 5
TOTAL
$90 128
$192 587
$308 050
$338 855
$372 740
$1 302 360
Staff
9
19
28
28
28
28
Salary budget
$60 279
$128 996
$206 876
$227 564
$250 321
$874 036
Taxes
$27 125
$58 048
$93 094
$102 404
$112 644
$393 316
Fixed costs
$34 664
$37 482
$40 019
$44 021
$48 423
$204 609
Developers Team
$1 096 245
$1 181 930
$1 439 835
$1 583 819
$1 742 201
$7 044 031
Staff
29
36
44
44
44
44
Salary budget
$598 403
$749 429
$925 793
$1 018 372
$1 120 210
$4 412 206
Taxes
$269 281
$337 243
$416 607
$458 268
$504 094
$1 985 493
Fixed costs
$60 705
$64 744
$64 932
$71 425
$78 568
$340 373
Sales Department
$358 509
$836 048
$1 102 914
$1 213 206
$1 334 526
$4 845 204
Staff
11
28
34
34
34
34
Salary budget
$241 741
$566 025
$758 622
$834 484
$917 933
$3 318 805
Taxes
$94 692
$233 574
$306 152
$336 767
$370 444
$1 341 631
Fixed costs
$58 713
$73 086
$74 777
$82 255
$90 480
$379 310
Marketing and Advertising
Department
$374 714
$543 477
$651 055
$716 161
$787 777
$3 073 185
Staff
18
27
29
29
29
29
Salary budget
$252 075
$366 714
$440 517
$484 568
$533 025
$2 076 898
Taxes
$113 434
$165 021
$198 233
$218 056
$239 861
$934 604
Fixed costs
$65 571
$68 107
$68 671
$75 538
$83 092
$360 978
Administrative Department
$245 585
$295 607
$374 469
$411 916
$453 108
$1 780 686
Staff
9
10
12
12
12
12
Salary budget
$154 533
$188 837
$242 835
$267 119
$293 831
$1 147 155
Taxes
$69 540
$84 977
$109 276
$120 204
$132 224
$516 220
Fixed costs
$29 216
$29 497
$30 061
$33 067
$36 374
$158 215
Advertising budget
Variable costs
Expenditures
Staff
$308 439
$1 526 538
$532 331
$585 564
$644 121
$3 596 994
$1 282 646
$0
$0
$0
$0
$0
Year 1
Year 2
Year 3
Year 4
Year 5
TOTAL
$3 756 267
$4 576 189
$4 408 655
$4 849 521
$5 334 473
$22 925 106
76
120
147
147
147
26.
3.6 Accounting policies and financial controlsThe following sequence of work defines the basic principles of financial accounting of the company:
1) Constant collection of information to the financial department and the unified information system;
2) An account of any monetary and other transactions having material expression;
3) Daily compilation and provision of information to management for accounting, planning, control, and
management of the company.
4) If certain information is important to an investor or lender using the financial statements, that
information should be disclosed within the statement or in the notes to the statement.
5) company will continue to exist long enough to carry out its objectives and commitments and will not
liquidate in the foreseeable future. If the company financial situation is such that the accountant believes
the company will not be able to continue on, the accountant is required to disclose this assessment.
6) To use the accrual basis of accounting. The matching principle requires that expenses be matched with
revenues.
7) Under the accrual basis of accounting (as opposed to the cash basis of accounting), revenues are
recognized as soon as a product has been sold or a service has been performed, regardless of when the
money is actually received.
8) If a situation arises where there are two acceptable alternatives for reporting an item, conservatism
directs the accountant to choose the alternative that will result in less net income and / or less asset
amount. Conservatism helps the accountant to «break a tie.» It does not direct accountants to be
conservative. Accountants are expected to be unbiased and objective.
27.
3.7 Dividend policyThe Board of Directors may recommend the amount of dividends to the General meeting of
shareholders. However, only the General meeting of shareholders can approve the amount of
dividends.
Dividends are distributed after the company reaches production capacity.
The dividend policy of the company allows to meet the needs of industrial development faster
and to increase the market value of company.
Therefore, dividend distribution will be as follows: 100% of total net profit will be distributed
every quarter starting from the 11th quarter after raising investment. Before that, all money will
be reinvested into the development of the company and marketing costs. The company
development plans will be discussed at the General Meeting.
Final distribution of the dividends between company shareholders will be discussed and
approved at the General Meeting.
28.
4. PRESENT RISKSEconomic situation in the Russian catering sector stabilized after the crisis of 2014-2016 and now is coming
close to pre-crisis figures. turnover increases every year. Economic factors that may affect the project
development include ruble depreciation, expanded food import embargo, reduction of population incomes and
increase in food and alcohol prices. However, the market does not show the tendency for decrease in demand
now. Restaurants managed to benefit from the crisis, as they followed more cost-effective strategies. This had a
positive income on pricing and customer demand.
The main factor that can affect the project development is entry of new competitors with similar functionality,
which may cause outflow of customers from Foodoo. More aggressive policy of competitors can also influence
our service. To protect the service, the company's intellectual property such as the app functionality, design and
interface is timely registered in the Federal Institute for Industrial Property and patent applications are filed
with foreign patent agencies.
SberFood and Foodle have fewer functions, are not user-friendly, have no integration with ERP and are much
more expensive. Thus, we can guess that development of our competitors will be slow, and in competition
Foodoo is more profitable for its clients and is user-friendly.
Protection of intellectual property and preservation of advantages consisting in Foodoo extended functionality
are the main focus in the strategy development.
29.
5. TEAMAlexander Medvedev
Founder & CEO
Ilya
Postanogov
CTO
20-year experience in business, construction,
utility services, 2 restaurants, engineering
innovations and intellectual property in
catering. Annual business turnover is $8
million
EPRIMEGlobal (online payments service) CTO,
LivePortrait USA (mobile app) Senior Mobile
Developer, LivePortrait RUS (mobile app) CTO,
“K vrachu” (mobile app) Head of Mobile
Development, Pointerry (mobile app) СTO,
TransCapitalBank Senior Developer, Qutella (online
payments service) CEO.
Chief Marketing Manager (Brand manager) – projects
Danil
Maslennikov
CIO
Diageo Sales Manager, “Power-Saving Technologies”
Executing Director, LAKEWOOD Houses & Apartments
Chief Business Officer (design, construction, sales).
30.
6. LEGAL INFORMATIONThis presentation is for informational purposes only and is not intended to recommend any investment discussed in
this presentation. This presentation is not an offer to sell or the solicitation of an offer to purchase an interest in
Amazon of knowledge. All information concerning «MPS» LLC and industry data have been obtained from sources
believed to be reliable and current, but accuracy cannot be guaranteed. Statements in this presentation are made as
of the date specified here and «MPS» LLC has no obligation to update the information in this presentation.
The projections contained in this presentation are only estimates of future results that are based on assumptions
made at the time such projections were developed. There can be no assurance that the results outlined in the
projections will be achieved, and actual results may be significantly different from the projections. Also, general
economic factors, which are not predictable, can have a material impact on the reliability of projections. Any
investment in a startup company like «MPS» LLC is subject to various risks. In considering any performance
information contained in this presentation, you should bear in mind that past performance is no guarantee of future
results, and there can be no assurance that future investments will achieve satisfactory results.
Confidentiality provision
This presentation is intended for authorized recipients only and must be held strictly confidential. This presentation
includes confidential proprietary and trade secret information of LLC «MPS» and its affiliates. By accepting this
information, each recipient agrees that (I) no portion of this presentation may be reproduced or distributed in any
format without the prior express written consent of «MPS» LLC , (II) It will not copy, reproduce, or distribute this
presentation, in whole or in part, to any person or party, and (III) It will keep permanently confidential all information
contained herein that is not already public. Details and formats of investment conditions are offered upon requests.
7. CONCLUSION
This material does not constitute any representation as to the suitability or appropriateness of any security, financial
product or instrument. There is no guarantee that investment in any program or strategy discussed herein will be
profitable or will not incur loss. This information is prepared for general information only. It does not have regard to
the specific investment objectives, financial situation, and the particular needs of any specific person who may
receive this report. Investors should seek financial advice regarding the appropriateness of investing in any security or
investment strategy discussed or recommended in this report and should understand that statements regarding
future prospects may not be realized.
Investors should note that security values may fluctuate and that each security’s price or value may rise or fall.
Accordingly, investors may receive back less than originally invested. Past performance is not a guide to future
performance. Individual client accounts may vary. Investing in any security involves certain risks called nondiversifiable risk. These risks include market risk, interest-rate risk, inflation risk, and event risk. These risks are in
addition to any specific, or diversifiable, risks associated with particular investment styles or strategies
LLC «MEDVEDEV PRODIGY SYSTEMS»
CONTACTS:
Medvedev Alexander
Founder, CEO
Tel: 8 902 476 41 21
Mail: medvedev@prodigy-systems.ru