


")


 finance
Similar presentations:


")


The Behaviour of Interest Rates. Ch 5. Money Banking Revised0
1.
Ch 5 The Behaviour of Interest RatesWhat explains these interest rate movements? Since nominal
interest rate movements are negatively related to bond prices,
understanding interest rate changes also helps us understand
movements in bond prices.
We can either look at the Supply and Demand for Credit to
understand interest rate changes or the Supply and Demand for
Bonds to understand bond price changes. We can also look at the
Supply and Demand for Money to understand interest rates. That is,
we look at economic conditions and market forces (S and D) in the
credit market, bond market, money market to get an understanding
of the behavior of interest rates over time.
© 2005 Pearson Education Canada Inc.
5-1
2.
Ch 5. Determination of Interest Rates: Bond Market and Money Market.This chapter focuses on the Bond market(Demand and Supply components), and
the link between the bond market and liquidity preference theory(money market)
1. Asset Theory of demand;
2 Demand and Supply in the Bond Market;
3 Shifts in the demand and supply of bonds;
4 Markets For Money-The Liquidity Preference Framework.
For Animated slides, click the following, and open figures 4.1 to 4.7, 4A.1 to 4A.5
http://wps.aw.com/aw_mishkin_finmkts_5/32/8383/2146074.cw/i
ndex.html
© 2005 Pearson Education Canada Inc.
5-2
3.
(Certain Preliminaries)Why Do Interest Rates Change?
Interest rate exerts a significant influence on spending and
investment decisions in the economy, and as such its
movements are keenly watched by different economic
agents, including the Bank of Canada in mitigating the
business cycles in the economy. An important question that
needs to be addressed is, Why do interest rates change?
This chapter describes two alternative theories of interest
rate determination: (a) demand and supply analysis for
bonds, and (b) demand and supply for money-known as
liquidity preference approach.
Both the markets(the bond and the market for money) are
related, and it will be seen that the disequilibrium in the
market for money influences the market for bonds and the
© 2005 Pearson Education Canada Inc.
5-3
interest rate in the economy.
4.
(Few Preliminaries) –contd.There are two parties in the bond market: (i) an issuer of bond(like firm) and (ii) investor who lends moneyBOND ISSUING PARTY: Who Issues bonds?
A firm/production units raise(borrow) money for financing production activities by issuing bonds. When a firm
borrows money from people, it has to pay some interest rate on bond(called coupon rate). This (interst rate paid
by the company to you) is the cost of finance.
BOND BUYERS: Who buys bonds ?
Investors like you, pension fund companies, mutual fund companies and others.
There are two interest rates that must be clearly distinguished: (a) Interest rate paid on bond(called coupon),
which does not change at all till the maturity (one year, five deal year, ten year etc)of the bond)., and the (b)
market interest rate which keeps on changing due to the demand and supply of loanable funds(or credit), including
government policies. When a company issues a bond, the coupon rate(the interest rate paid on bond) is generally
the same as the market interest rate. But with the passage of time, market interest rate changes due to various
factors, but the coupon rate promised by the company when the bond was issued does not change.
Recalling from Last Chapter: An Inverse Relationship between the Interest rate(market) and the Bond
Price
When new bonds are issued, they typically carry coupon rates at or close to the prevailing market interest rate.
Interest rates and bond prices have what's called an "inverse relationship" – meaning, when one goes up, the
other goes down. The question is: how does the market interest rate affect the value (price) of a bond you
already?
Let's look at an example.: Suppose the ABC company offers a new issue of bonds carrying a 7% coupon.
Suppose the market interest rate is also 7% on say Jan 2010. This means it would pay you $70 a year in interest.
After evaluating your investment alternatives,
you decide this is a good, so you purchase a bond at its initial
© 2005 Pearson Education Canada Inc.
5-4
price(issue price) , $1,000.
5.
(Certain Preliminaries)-contdWhat if Market interest rate Rates Go Up?Now let's suppose that later that year, interest(market) rates in general go up due to tight credit conditions. If the
market interest rate is now 8% on May 2010. Any company(suppose xyz) which now wants to raise money
through issuing bonds must pay 8% as coupon on new bonds; otherwise it can not attract people to invest in its
bonds because people can invest in the market and earn 8% on investment. You as a buyer of ABC company's
bond will like to sell ABC company’s bond which is paying 7%. The buyers in the market will be reluctant to pay
you face value ($1,000) for your 7% ABC bond. In order to sell, you'd have to offer your bond at a lower price – a
discount – that would enable it to generate approximately 8% to the new owner. In this case, that would mean a
price of about $875.
What if Rates Fall?
Similarly, if rates dropped to below your original coupon rate of 7%, your bond would be worth more than $1,000. It would
be priced at a premium, since it would be carrying a higher interest rate than what was currently available on the market.
© 2005 Pearson Education Canada Inc.
5-5
6.
Demand for Bonds.Before we discuss the demand for bonds, it has to be recognized that the bond is one of
the competing assets that individuals/corporations like to hold in their portfolio of assets.
The demand for bonds is therefore needs to be considered in relation to the demand for
competing assets. The competing assets can be real assets(like real estate, jewelry,
gold) and financial assets(equities, money-because of its liquidity property).
Determinants of asset demand
There are four factors influencing demand for assets, including bonds.
These are:
(a)Wealth,
(b) Expected return from the asset.
(c) Riskiness of the asset.
(d) Liquidity of the asset.
© 2005 Pearson Education Canada Inc.
5-6
7. Determinants of Asset Demand
© 2005 Pearson Education Canada Inc.5-7
8.
Factors that Change the Asset Demand: (* 3)Wealth: An increase in wealth, other things remaining constant results in the
increase in demand for all assets
Expected returns - an increase (decrease) in an asset's
expected return, relative to alternative assets, increases
(decreases) the demand for the asset, ceteris paribus.
Example: A company's earnings forecast improves (declines),
demand for the stock will increase (decrease), resulting in a higher
(lower) price.
Risk - if an asset's risk increases (decreases), relative to
other assets, the demand will fall (rise). Assumes investors
are risk-averse. Example: a company's credit rating is
downgraded (from AAA to C), demand for its bonds will fall, price will
fall.
Liquidity - the more liquid an asset is, relative to other assets,
the greater the demand, ceteris paribus. Example: Treasury
securities are the most liquid
asset, demand is high, prices are high,
© 2005 Pearson Education Canada Inc.
5-8
interest rates are low.
9.
Demand Curve for Bonds (Bond demanders are bondinvestors/buyers/savers/lenders and Bond suppliers are bond
issuers/sellers/borrowers: Corporations and municipalities),
Investors like: low bond prices and high interest rates. At lower prices
and higher interest rates, the quantity demanded of a bond (Bd) will be
higher.
As the price falls, the reward for holding the bonds rises, so the quantity demanded goes up.
Example: think of a zero coupon bond promising to pay $100 in one year. The bond will attract
more demand at $90 than it will be at $95.
Supply Curve for Bonds
Companies/borrowers like: high bond prices and low interest rates. The
higher the price and the lower the interest rate, the more bonds
will be supplied by firms
The higher the price of a bond, the larger the supply will be for two reasons. From the investor’s
view point, the higher the price, more tempting it is to sell a bond they currently hold. From the
point of view of companies seeking finance for a new projects, the higher the price at which they
can sell bonds, the better.
© 2005 Pearson Education Canada Inc.
5-9
10. Derivation of Bond Demand Curve
ei = RET =
(F – P)
P
Point A:
P = $950
($1000 – $950)
i=
$950
= 0.053 = 5.3%
d
B = $100 billion
© 2005 Pearson Education Canada Inc.
5-10
11. Derivation of Bond Demand Curve
Point B:P = $900
i=
($1000 – $900)
$900
= 0.111 = 11.1%
d
B = $200 billion
d
Point C: P = $850, i = 17.6% B = $300 billion
d
Point D: P = $800, i = 25.0% B = $400 billion
d
Point E: P = $750, i = 33.0% B = $500 billion
d
Demand Curve is B in Figure 1 which connects points A, B, C, D, E.
Has usual downward slope
© 2005 Pearson Education Canada Inc.
5-11
12. Derivation of Bond Supply Curve
sPoint F:
P = $750, i = 33.0%, B = $100 billion
Point G:
P = $800, i = 25.0%, B = $200 billion
Point C:
P = $850, i = 17.6%, B = $300 billion
Point H:
P = $900, i = 11.1%, B = $400 billion
Point I:
P = $950, i = 5.3%, B = $500 billion
s
s
s
s
s
Supply Curve is B that connects points F, G, C, H, I, and has upward slope
© 2005 Pearson Education Canada Inc.
5-12
13. Supply and Demand Analysis of the Bond Market
Market Equilibriumd
s
1. Occurs when B = B , at P* =
$850, i* = 17.6%
s
2. When P = $950, i = 5.3%, B >
d
B (excess supply): P to P*, i
to i*
d
3. When P = $750, i = 33.0, B >
s
B (excess demand): P to P*,
i to i*
© 2005 Pearson Education Canada Inc.
5-13
14.
SHIFTS IN BOND DEMAND: Factors1.Wealth - If wealth goes up, for an individual or the
country, the demand for bonds will rise, Bd shifts to the right.
2.Expected returns – Recall that return on bond depends on the coupon payment plus
capital gain or loss(see slides 16 reproduced from the last chapter). When interest rates
fall, bond prices rise, creating a capital gain. Whenever interest rates are expected to
fall, then bonds prices are expected to rise, creating an expectation of capital gain. This
makes bonds more attractive, shifting demand for bonds to right. We saw in the
previous chapter, that lower expected interest rate in future increase the demand for
long term bonds(because long term bond prices would be expected to rise more than
initially expected), resulting in the shift of demand to the right. On the other hand,
higher expected interest rates in the future lower the expected return for long term
bonds, resulting in the leftward shift in the bond`s demand curve.
© 2005 Pearson Education Canada Inc.
5-14
15.
Change in expected inflation will affect bond demand. Anincrease in expected inflation will lower bond demand (Bd) for
several reasons. During inflationary periods, real (physical)
assets do very well (real estate, gold, antiques, baseball cards,
etc), so investors would shift out of bonds and stocks into real
assets when expected inflation increases.
Risk - if the riskiness of bonds increases relative
to other assets, the demand will fall, shift to the left.
An increase in the riskiness of other assets, will increase
the demand for bonds. Example: Economy goes into
recession, junk bonds in general are now considered
to be more risky (higher default rate). Bd falls for junk bonds,
5. Liquidity - Increased liquidity of bonds, relative to
other assets, increases demand for bonds (Bd). Increased
liquidity of other assets decreases the demand for bonds.
© 2005 Pearson Education Canada Inc.
5-15
16. Loanable Funds Terminology
1. Demand for bonds =supply of loanable
funds
2. Supply of bonds =
demand for
loanable funds
© 2005 Pearson Education Canada Inc.
5-16
17. Shifts in the Bond Demand Curve
© 2005 Pearson Education Canada Inc.5-17
18. Factors that Shift the Bond Demand Curve
1. WealthA.
Economy grows, wealth , Bd , Bd shifts out to right
2. Expected Return
A.
B.
3. Risk
A.
B.
i in future, Re for long-term bonds , Bd shifts out to right
e , Relative Re , Bd shifts out to right
Risk of bonds , Bd , Bd shifts out to right
Risk of other assets , Bd , Bd shifts out to right
4. Liquidity
A.
B.
Liquidity of Bonds , Bd , Bd shifts out to right
Liquidity of other assets , Bd , Bd shifts out to right
© 2005 Pearson Education Canada Inc.
5-18
19. Distinction Between Interest Rates and Returns (Previous Chapter)
Rate of ReturnRET =
C + Pt+1 – Pt
Pt
where: ic =
g=
C
= current yield
Pt
Pt+1 – Pt
Pt
= ic + g
= capital gain
© 2005 Pearson Education Canada Inc.
5-19
20. Factors that Shift Demand Curve for Bonds
© 2005 Pearson Education Canada Inc.5-20
21. Bond Market and Interest Rates
© 2005 Pearson Education Canada Inc.5-21
22.
SHIFTS IN THE SUPPLY OF BONDS: Factors1. Investment opportunities. The more profitable
investment opportunities there are available, the greater
the supply of bonds (the greater the demand for credit).
The fewer the opportunities, the lower the supply of bonds.
2. Expected inflation - An increase in expected future
inflation raises the Demand for Credit now (Supply of Bonds increases).
Two reasons: a) higher interest rates in the future, borrow now
before interest rates rise and b) higher expected inflation lowers
the real rate of interest, benefiting debtors.
3. Government activity - Higher govt. deficits increase the
Supply of Treasury bonds and shift Supply of Bonds (Bs)
curve to the right. When the government is running a surplus,
the Supply of Bonds decreases and the Bs shifts to the left.
© 2005 Pearson Education Canada Inc.
5-22
23. Shifts in the Bond Supply Curve
1. Profitability ofInvestment
Opportunities
Business cycle
expansion,
investment
opportunities ,
Bs , Bs shifts out
to right
2. Expected Inflation
e , Bs , Bs shifts
out to right
3. Government
Activities
Deficits , Bs , Bs
shifts out to right
© 2005 Pearson Education Canada Inc.
5-23
24. Factors that Shift Supply Curve for Bonds
© 2005 Pearson Education Canada Inc.5-24
25. Bond Market and Interest Rates
© 2005 Pearson Education Canada Inc.5-25
26. Bonds and Risk
Sources of Bond Risk• Default Risk
• Inflation Risk
• Interest-Rate Risk
© 2005 Pearson Education Canada Inc.
5-26
27. Changes in e: the Fisher Effect
Changes in e: the Fisher EffectIf e
1. Relative RETe ,
Bd shifts in to
left
2. Bs , Bs shifts
out to right
3. P , i
© 2005 Pearson Education Canada Inc.
5-27
28. Evidence on the Fisher Effect
© 2005 Pearson Education Canada Inc.5-28
29. Business Cycle Expansion
1. Wealth , Bd ,Bd shifts out to
right
2. Investment ,
Bs , Bs shifts
out to right
3. If Bs shifts more
than Bd then P
, i
© 2005 Pearson Education Canada Inc.
5-29
30.
In a business cycle expansion, when the income and wealth areRising, the demand curve for bond and the supply curve for bond,
both, will shift to the right. The rightward shift in the supply curve,
however, is more than the demand curve. The equilibrium bond
prices moves down, and the equilibrium interest rate rises. Thus the
interest rate rises during business cycle expansion and falls during
recession.
© 2005 Pearson Education Canada Inc.
5-30
31. Evidence on Business Cycles and Interest Rates
© 2005 Pearson Education Canada Inc.5-31
32.
LIQUIDITY PREFERENCE FRAMEWORK:Supply AND Demand FOR MONEY
Another economic framework to analyze the behavior
of interest rates is to look at the S and D for money,
which also determines the equilibrium interest rate.
Liquidity Preference also helps to understand the Fed policy
and the effect that it has on interest rates, since the Fed
controls the MS directly and interest rates indirectly.
Assumptions of Liquidity Preference Theory:
There are two main assets to store wealth –
bonds (interest bearing) and money/cash (interest = 0%).
Bs + Ms = Bd + Md which says that the Supply of assets
(bonds and money) has to equal the Demand for assets
(bonds and money).
Interest rates change to clear both bond and money
© 2005 Pearson Education Canada Inc.
market, bring about equilibrium.
5-32
33. Relation of Liquidity Preference Framework to Loanable Funds
Keynes’s Major AssumptionThere are Two Categories of Assets in Wealth
Money
Bonds
1. Thus:
Ms + Bs = Wealth
2. Budget Constraint:
Bd + Md = Wealth
3. Therefore:
Ms + Bs = Bd + Md
4. Subtracting Md and Bs from both sides:
Ms – Md = Bd – Bs
Money Market Equilibrium
5. Occurs when Md = Ms
6. Then Md – Ms = 0 which implies that Bd – Bs = 0, so that Bd = Bs and bond
market is also in equilibrium
© 2005 Pearson Education Canada Inc.
5-33
34.
1. Thus, equating supply and demand for bondsis equivalent to equating supply and demand
for money. We can, therefore, think about
determining the equilibrium interest rates by
equating Ms =Md or Bd = Bs
2. Two frameworks are closely linked, but differ
in practice because liquidity preference
assumes only two assets, money and bonds,
and ignores effects on interest rates from
changes in expected returns on real assets.
© 2005 Pearson Education Canada Inc.
5-34
35. Liquidity Preference Analysis
Demand Curve of Money1 As i , relative RETe on money (equivalently, opportunity cost of
money ) Md
2. Demand curve for money has usual downward slope
Supply curve of Money
1. Assume that central bank controls Ms and it is a fixed amount
2. Ms curve is vertical line
Market Equilibrium
1. Occurs when Md = Ms, at i* = 15%
2. If i = 25%, Ms > Md (excess supply): Price of bonds , i to i* = 15%
3. If i =5%, Md > Ms (excess demand): Price of bonds , i to
i* = 15%
© 2005 Pearson Education Canada Inc.
5-35
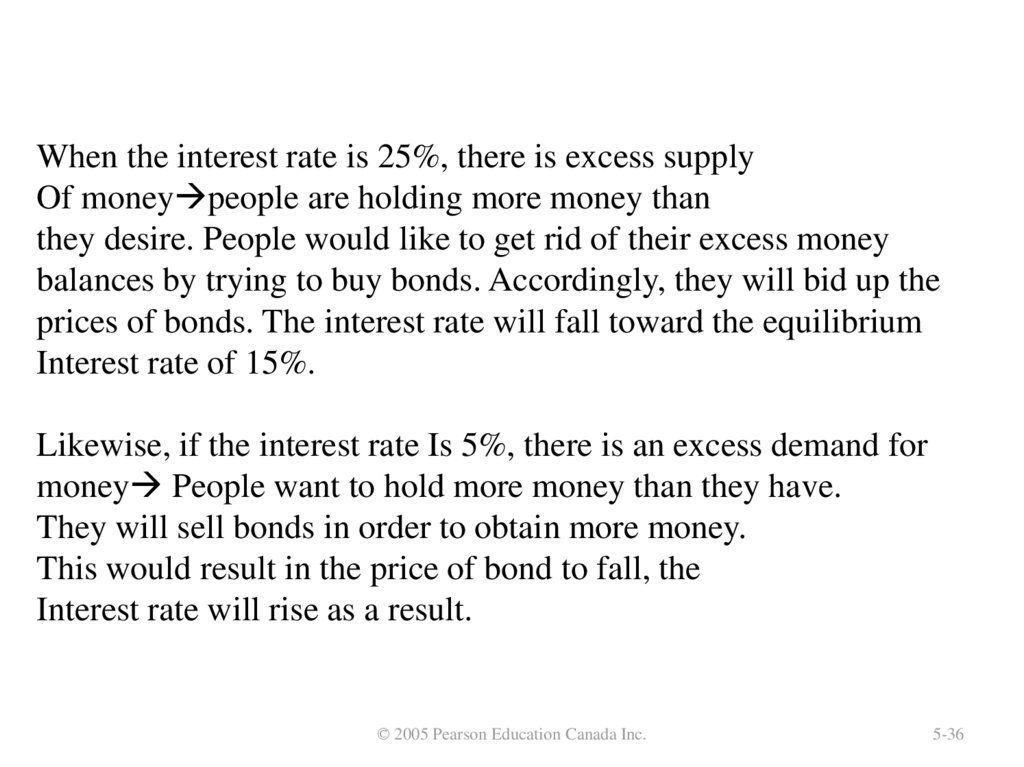
36.
When the interest rate is 25%, there is excess supplyOf money people are holding more money than
they desire. People would like to get rid of their excess money
balances by trying to buy bonds. Accordingly, they will bid up the
prices of bonds. The interest rate will fall toward the equilibrium
Interest rate of 15%.
Likewise, if the interest rate Is 5%, there is an excess demand for
money People want to hold more money than they have.
They will sell bonds in order to obtain more money.
This would result in the price of bond to fall, the
Interest rate will rise as a result.
© 2005 Pearson Education Canada Inc.
5-36
37. Money Market Equilibrium
© 2005 Pearson Education Canada Inc.5-37
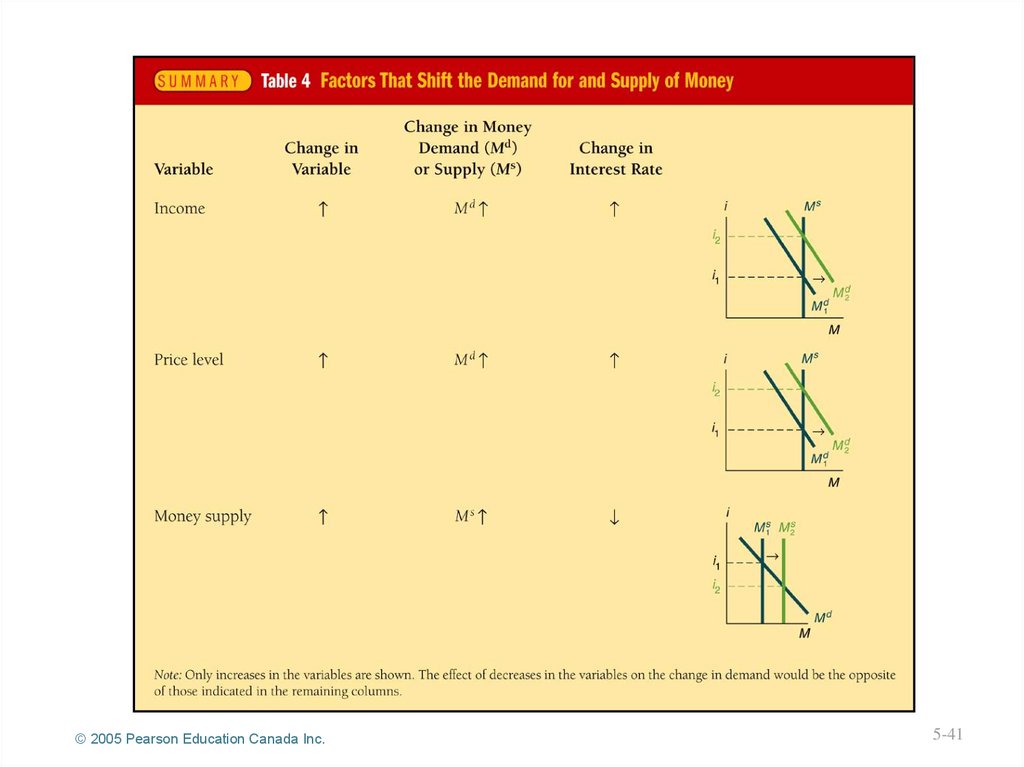
38. Rise in Income or the Price Level
1. Income , M , Mshifts out to right
2. Ms unchanged
3. i* rises from i1 to i2
d
d
© 2005 Pearson Education Canada Inc.
5-38
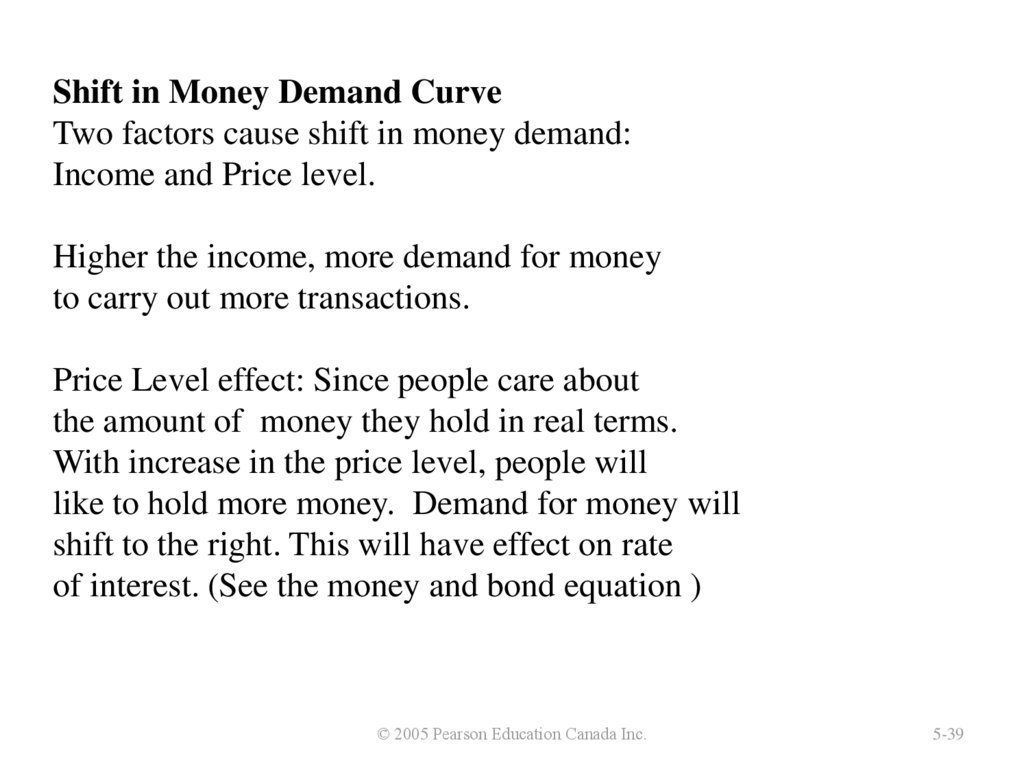
39.
Shift in Money Demand CurveTwo factors cause shift in money demand:
Income and Price level.
Higher the income, more demand for money
to carry out more transactions.
Price Level effect: Since people care about
the amount of money they hold in real terms.
With increase in the price level, people will
like to hold more money. Demand for money will
shift to the right. This will have effect on rate
of interest. (See the money and bond equation )
© 2005 Pearson Education Canada Inc.
5-39
40. Rise in Money Supply
1. Ms , Ms shifts out to right2. Md unchanged
3. i* falls from i1 to i2
© 2005 Pearson Education Canada Inc.
5-40
41.
© 2005 Pearson Education Canada Inc.5-41
42. Money and Interest Rates
Effects of money on interest rates1. Liquidity Effect
Ms , Ms shifts right, i
2. Income Effect
Ms , Income , Md , Md shifts right, i
3. Price Level Effect
Ms , Price level , Md , Md shifts right, i
4. Expected Inflation Effect
Ms , e , Bd , Bs , Fisher effect, i
Effect of higher rate of money growth on interest rates is ambiguous
1. Because income, price level and expected inflation effects work in
opposite direction of liquidity effect
© 2005 Pearson Education Canada Inc.
5-42
43. Does Higher Money Growth Lower Interest Rates?
© 2005 Pearson Education Canada Inc.5-43
44. Evidence on Money Growth and Interest Rates
© 2005 Pearson Education Canada Inc.5-44