


 finance
Similar presentations:


")


")

Labor and financial markets
1. Labor and Financial Markets
LABOR AND FINANCIAL MARKETSProf. Zharova L.
zharova_l@ua.fm
2. Supply & demand
SUPPLY & DEMANDBaby Boomers Come of Age
The Census Bureau reports that as of 2013, 20% of the U.S. population was over 60 years old, which means
that almost 63 million people are reaching an age when they will need increased medical care.
The baby boomer population, the group born between 1946 and 1964, is comprised of approximately 74
million people who have just reached retirement age. As this population grows older, they will be faced with
common healthcare issues such as heart conditions, arthritis, and Alzheimer’s that may require hospitalization,
long-term, or at-home nursing care. Aging baby boomers and advances in life-saving and lifeextending
technologies will increase the demand for healthcare and nursing. Additionally, the Affordable Care Act, which
expands access to healthcare for millions of Americans, will further increase the demand.
According to the Bureau of Labor Statistics, registered nursing jobs are expected to increase by 19% between
2012 and 2022. The median annual wage of $67,930 (in 2012) is also expected to increase. The BLS
forecasts that 526,000 new nurses will be needed by 2022. One concern is the low rate of enrollment in
nursing programs to help meet the growing demand. According to the American Association of Colleges of
Nursing (AACN), enrollment in 2011 increased by only 5.1% due to a shortage of nursing educators and
teaching facilities.
These data tell us, as economists, that the market for healthcare professionals, and nurses in particular, will
face several challenges. Our study of supply and demand will help us to analyze what might happen in the
labor market for nursing and other healthcare professionals, as discussed in the second half of this case at the
end of the chapter.
3. Demand and Supply at Work in Labor Markets
DEMAND AND SUPPLY AT WORK IN LABORMARKETS
Markets for labor have demand and supply curves, just like markets for goods. The
law of demand applies in labor markets this way: A higher salary or wage – that is,
a higher price in the labor market – leads to a decrease in the quantity of labor
demanded by employers, while a lower salary or wage leads to an increase in the
quantity of labor demanded.
The law of supply functions in labor markets, too: A higher price for labor leads to a
higher quantity of labor supplied; a lower price leads to a lower quantity supplied.
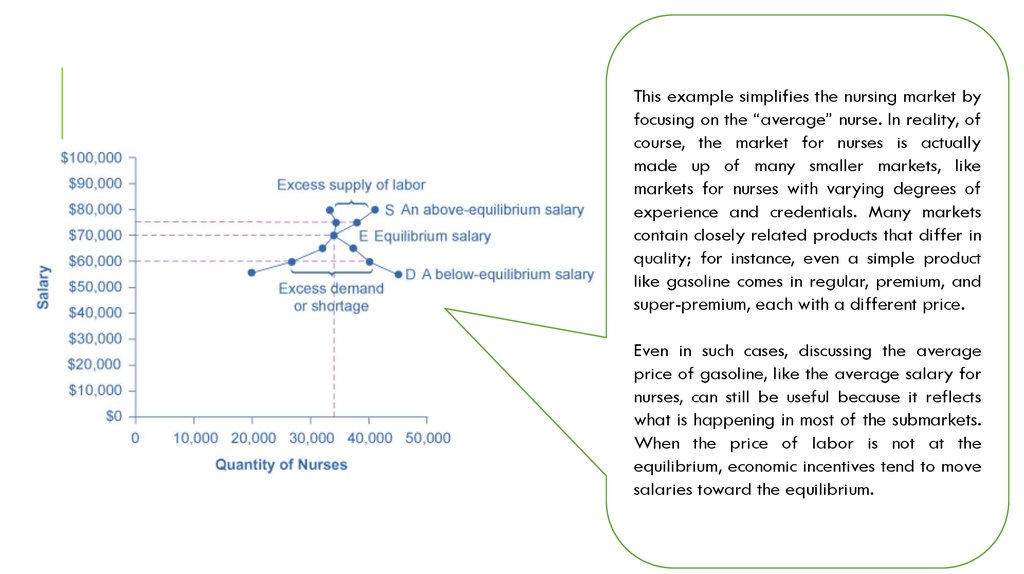
4. Equilibrium in the Labor Market
EQUILIBRIUM IN THE LABOR MARKETWhen the price of labor is
not at the equilibrium,
economic incentives tend to
move salaries toward the
equilibrium.
In 2013, about 34,000 registered nurses worked in
the Minneapolis-St. Paul-Bloomington, MinnesotaWisconsin metropolitan area, according to the BLS.
They worked for a variety of employers: hospitals,
doctors’ offices, schools, health clinics, and nursing
homes.
Annual Salary
Quantity
Demanded
Quantity Supplied
55,000
45,000
20,000
60,000
40,000
27,000
65,000
37,000
31,000
70,000
34,000
34,000
75,000
33,000
38,000
80,000
32,000
41,000
At equilibrium, the quantity supplied and the quantity
demanded are equal. Thus, every employer who wants to hire
a nurse at this equilibrium wage can find a willing worker,
and every nurse who wants to work at this equilibrium salary
can find a job.
5.
This example simplifies the nursing market byfocusing on the “average” nurse. In reality, of
course, the market for nurses is actually
made up of many smaller markets, like
markets for nurses with varying degrees of
experience and credentials. Many markets
contain closely related products that differ in
quality; for instance, even a simple product
like gasoline comes in regular, premium, and
super-premium, each with a different price.
Even in such cases, discussing the average
price of gasoline, like the average salary for
nurses, can still be useful because it reflects
what is happening in most of the submarkets.
When the price of labor is not at the
equilibrium, economic incentives tend to move
salaries toward the equilibrium.
6. Shifts in demand
SHIFTS IN DEMANDHere are some examples of derived demand for labor:
The demand for chefs is dependent on the demand
for restaurant meals.
The demand for pharmacists is dependent on the
demand for prescription drugs.
The demand for attorneys is dependent on the
demand for legal services.
The demand curve for labor shows the quantity of labor employers wish to hire at
any given salary or wage rate, under the ceteris paribus assumption. A change in the
wage or salary will result in a change in the quantity demanded of labor =
movement along the demand curve.
Shifts in the demand curve for labor occur for many reasons. One key reason is that
the demand for labor is based on the demand for the good or service that is being
produced. Therefore the demand for labor is called a “DERIVED DEMAND.”
oDemand for Output
oEducation &Training
oTechnology
oNumber of Companies
oGovernment Regulations
oPrice and Availability of Other Inputs
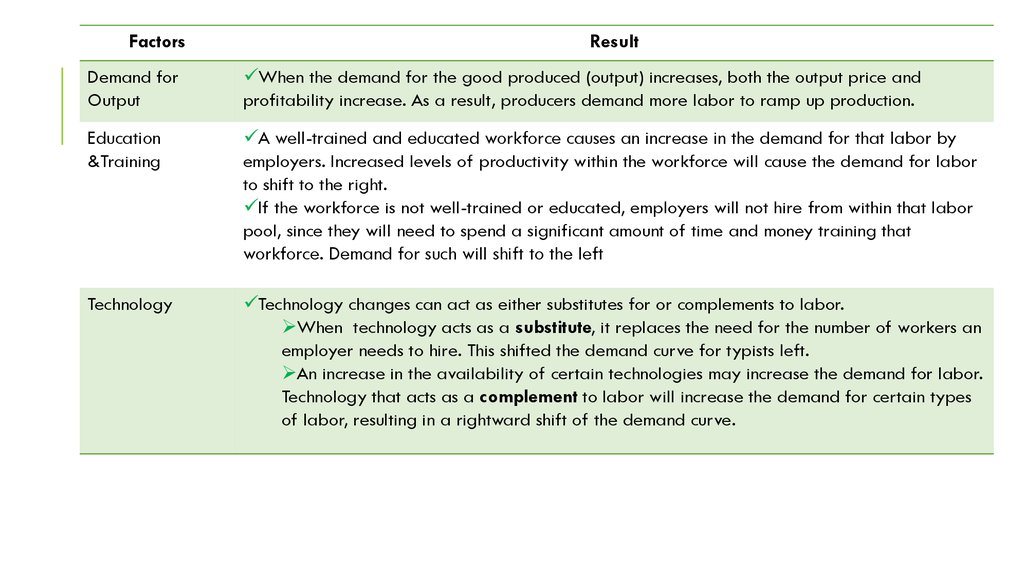
7.
FactorsResult
Demand for
Output
When the demand for the good produced (output) increases, both the output price and
profitability increase. As a result, producers demand more labor to ramp up production.
Education
&Training
A well-trained and educated workforce causes an increase in the demand for that labor by
employers. Increased levels of productivity within the workforce will cause the demand for labor
to shift to the right.
If the workforce is not well-trained or educated, employers will not hire from within that labor
pool, since they will need to spend a significant amount of time and money training that
workforce. Demand for such will shift to the left
Technology
Technology changes can act as either substitutes for or complements to labor.
When technology acts as a substitute, it replaces the need for the number of workers an
employer needs to hire. This shifted the demand curve for typists left.
An increase in the availability of certain technologies may increase the demand for labor.
Technology that acts as a complement to labor will increase the demand for certain types
of labor, resulting in a rightward shift of the demand curve.
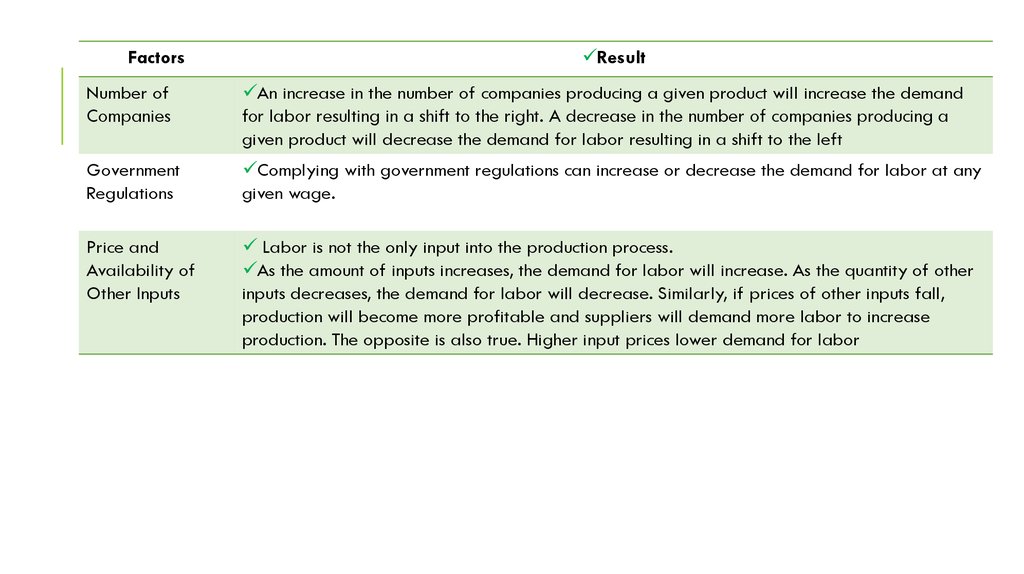
8.
FactorsResult
Number of
Companies
An increase in the number of companies producing a given product will increase the demand
for labor resulting in a shift to the right. A decrease in the number of companies producing a
given product will decrease the demand for labor resulting in a shift to the left
Government
Regulations
Complying with government regulations can increase or decrease the demand for labor at any
given wage.
Price and
Availability of
Other Inputs
Labor is not the only input into the production process.
As the amount of inputs increases, the demand for labor will increase. As the quantity of other
inputs decreases, the demand for labor will decrease. Similarly, if prices of other inputs fall,
production will become more profitable and suppliers will demand more labor to increase
production. The opposite is also true. Higher input prices lower demand for labor
9. The Low-Skilled Labor Market
THE LOW-SKILLED LABOR MARKETThe definition of “low-skilled” can be based either on the skills required for the job performed, or according to
the educational level of the worker. In other words, “lowskilled” can be either a characteristic of the job or a
characteristic of the worker.
The Organization for Economic Cooperation and Development (OECD), for example, defines low-skilled on the
basis of the person (and their education level) rather than on the basis of the job.
Interestingly, about 60% of migrants in low-skilled jobs come from non-EU countries: roughly 1.2 million people.
The latest UK Office for National Statistics (ONS) migration figures showed that of the 230,000 EU citizens estimated to have
arrived in the UK in the year ending March 2017, 112,000 had a definite job, while another 47,000 were looking for work.
(Others were coming to study or to join other family members.)
ONS data for 2015 estimates that the most popular industry for EU workers overall is "households as employers" (nannies and
au pairs to you and me), in which they make up about 16% of the workforce.
Next comes accommodation and food (roughly 13%), followed by administration and manufacturing (10%), transport (8%)
and construction (7%).
But these figures refer to very broad sectors of the economy. In some specific jobs - such as waiters or fruit pickers - the
numbers will be far higher
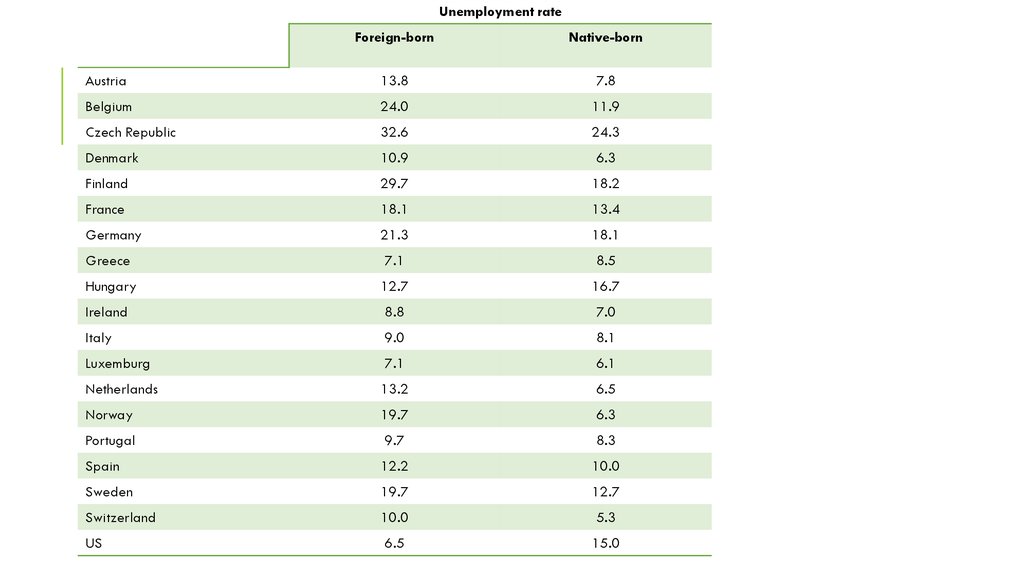
10.
Unemployment rateForeign-born
Native-born
Austria
13.8
7.8
Belgium
24.0
11.9
Czech Republic
32.6
24.3
Denmark
10.9
6.3
Finland
29.7
18.2
France
18.1
13.4
Germany
21.3
18.1
Greece
7.1
8.5
Hungary
12.7
16.7
Ireland
8.8
7.0
Italy
9.0
8.1
Luxemburg
7.1
6.1
Netherlands
13.2
6.5
Norway
19.7
6.3
Portugal
9.7
8.3
Spain
12.2
10.0
Sweden
19.7
12.7
Switzerland
10.0
5.3
US
6.5
15.0
11. Shifts in Labor Supply
SHIFTS IN LABOR SUPPLYFactors
Result
Number of
Workers
An increased number of workers will cause the supply curve to shift to the right. An increased
number of workers can be due to several factors, such as immigration, increasing population, an
aging population, and changing demographics:
Required
Education
The more required education, the lower the supply.
Government
Policies
The government may support rules that set high qualifications for certain jobs: academic
training, certificates or licenses, or experience. When these qualifications are made tougher, the
number of qualified workers will decrease at any given wage.
On the other hand, the government may also subsidize training or even reduce the required
level of qualifications.
In addition, government policies that change the relative desirability of working versus not
working also affect the labor supply.
12. Technology and Wage Inequality: The Four-Step Process
TECHNOLOGY AND WAGE INEQUALITY:THE FOUR-STEP PROCESS
Economic events can change the equilibrium salary (or wage) and quantity of labor.
Consider how the wave of new information technologies, like computer and
telecommunications networks, has affected low-skill and high-skill workers in the
U.S. economy.
From the perspective of employers who demand labor, these new technologies are often a substitute
for low-skill laborers like file clerks who used to keep file cabinets full of paper records of
transactions.
However, the same new technologies are a complement to high-skill workers like managers, who
benefit from the technological advances by being able to monitor more information, communicate more
easily, and juggle a wider array of responsibilities.
13.
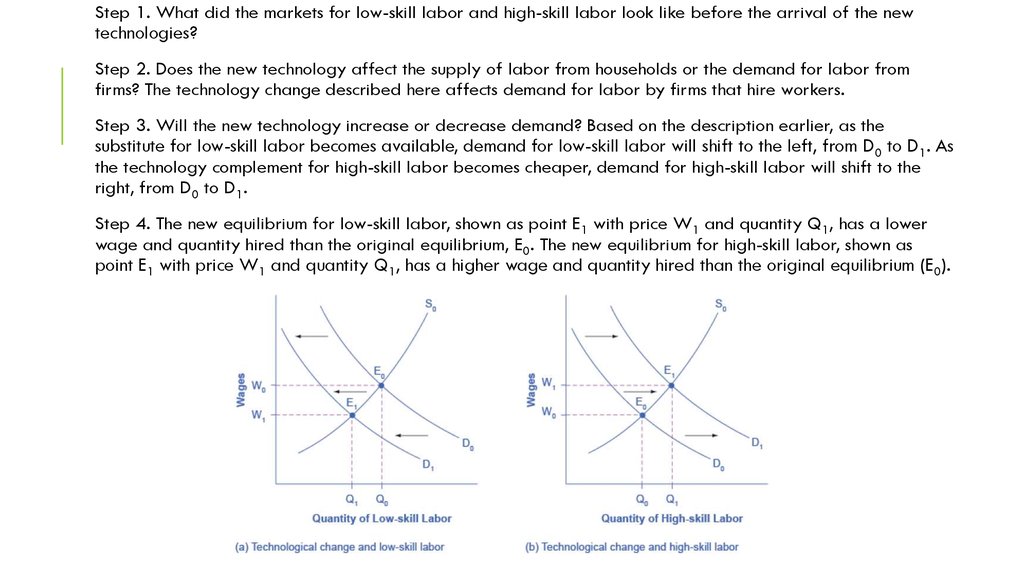
Step 1. What did the markets for low-skill labor and high-skill labor look like before the arrival of the newtechnologies?
Step 2. Does the new technology affect the supply of labor from households or the demand for labor from
firms? The technology change described here affects demand for labor by firms that hire workers.
Step 3. Will the new technology increase or decrease demand? Based on the description earlier, as the
substitute for low-skill labor becomes available, demand for low-skill labor will shift to the left, from D0 to D1. As
the technology complement for high-skill labor becomes cheaper, demand for high-skill labor will shift to the
right, from D0 to D1.
Step 4. The new equilibrium for low-skill labor, shown as point E1 with price W1 and quantity Q1, has a lower
wage and quantity hired than the original equilibrium, E0. The new equilibrium for high-skill labor, shown as
point E1 with price W1 and quantity Q1, has a higher wage and quantity hired than the original equilibrium (E0).
14. Price Floors in the Labor Market: Living Wages and Minimum Wages
PRICE FLOORS IN THE LABOR MARKET: LIVINGWAGES AND MINIMUM WAGES
In contrast to goods and services markets, price ceilings are rare
in labor markets, because rules that prevent people from earning
income are not politically popular. There is one exception:
sometimes limits are proposed on the high incomes of top
business executives.
The labor market, however, presents some prominent examples
of price floors, which are often used as an attempt to increase
the wages of low-paid workers.
MINIMUM WAGE – a price floor that makes it illegal for an
employer to pay employees less than a certain hourly rate.
In public policy, a living wage is the minimum income necessary
for a worker to meet their basic needs
Promoters of living wage laws maintain
that the minimum wage is too low to
ensure a reasonable standard of living.
They base this conclusion on the calculation
that, if you work 40 hours a week at a
minimum wage of $7.25 per hour for 50
weeks a year, your annual income is
$14,500, which is less than the official U.S.
government definition of what it means for
a family to be in poverty.
(A family with two adults earning minimum
wage and two young children will find it
more cost efficient for one parent to provide
childcare while the other works for income.
So the family income would be $14,500,
which is significantly lower than the federal
poverty line for a family of four, which was
$23,850 in 2014.)
15. Demand and Supply in Financial Markets
DEMAND AND SUPPLY IN FINANCIAL MARKETSWho Demands and Who Supplies in Financial Markets?
In any market, the price is what suppliers receive and what demanders pay. In
financial markets, those who supply financial capital through saving expect to receive
a rate of return, while those who demand financial capital by receiving funds expect
to pay a rate of return.
This rate of return can come in a variety of forms, depending on the type of
investment. The simplest example of a rate of return is the interest rate.
For example, when you supply money into a savings account at a bank, you receive
interest on your deposit. The interest paid to you as a percent of your deposits is the
interest rate. Similarly, if you demand a loan to buy a car or a computer, you will need
to pay interest on the money you borrow.
16. Shifts in Demand and Supply in Financial Markets
SHIFTS IN DEMAND AND SUPPLY IN FINANCIALMARKETS
Participants in financial markets must decide when they prefer to consume goods: now or in the
future. Economists call this INTERTEMPORAL DECISION MAKING because it involves decisions
across time. Unlike a decision about what to buy from the grocery store, decisions about investment
or saving are made across a period of time, sometimes a long period.
Most workers save for retirement because their income in the present is greater than their needs, while the
opposite will be true once they retire. So they save today and supply financial markets. If their income increases,
they save more. If their perceived situation in the future changes, they change the amount of their saving.
So when consumers and businesses have greater confidence that they will be able to repay in the
future, the quantity demanded of financial capital at any given interest rate will shift to the right.
For example, in the technology boom of the late 1990s, many businesses became extremely confident that
investments in new technology would have a high rate of return, and their demand for financial capital shifted to
the right. Conversely, during the Great Recession of 2008 and 2009, their demand for financial capital at any
given interest rate shifted to the left.
17. Price Ceilings in Financial Markets: Usury Laws
PRICE CEILINGS IN FINANCIALMARKETS: USURY LAWS
Many states do have usury laws, which impose an
upper limit on the interest rate that lenders can
charge. However, in many cases these upper limits
are well above the market interest rate.
For example, if the interest rate is not allowed to
rise above 30% per year, it can still fluctuate
below that level according to market forces. A
price ceiling that is set at a relatively high level is
nonbinding, and it will have no practical effect
unless the equilibrium price soars high enough to
exceed the price ceiling.
The demand and supply model predicts that at the
lower price ceiling interest rate, the quantity
demanded of credit card debt will increase from
its original level of Q0 to Qd; however, the
quantity supplied of credit card debt will decrease
from the original Q0 to Qs.
At the price ceiling (Rc), quantity demanded will
exceed quantity supplied. Consequently, a number
of people who want to have credit cards and are
willing to pay the prevailing interest rate will find
that companies are unwilling to issue cards to them.
The result will be a credit shortage.
18. Summary
SUMMARYIn the labor market, households are on the supply side of the market and firms are on the demand side. In the market for
financial capital, households and firms can be on either side of the market: they are suppliers of financial capital when they
save or make financial investments, and demanders of financial capital when they borrow or receive financial investments. In
the demand and supply analysis of labor markets, the price can be measured by the annual salary or hourly wage received.
The quantity of labor can be measured in various ways, like number of workers or the number of hours worked. Factors that
can shift the demand curve for labor include: a change in the quantity demanded of the product that the labor produces; a
change in the production process that uses more or less labor; and a change in government policy that affects the quantity of
labor that firms wish to hire at a given wage. Demand can also increase or decrease (shift) in response to: workers’ level of
education and training, technology, the number of companies, and availability and price of other inputs. The main factors that
can shift the supply curve for labor are: how desirable a job appears to workers relative to the alternatives, government
policy that either restricts or encourages the quantity of workers trained for the job, the number of workers in the economy,
and required education.
In the demand and supply analysis of financial markets, the “price” is the rate of return or the interest rate received. The
quantity is measured by the money that flows from those who supply financial capital to those who demand it. Two factors can
shift the supply of financial capital to a certain investment: if people want to alter their existing levels of consumption, and if
the riskiness or return on one investment changes relative to other investments. Factors that can shift demand for capital
include business confidence and consumer confidence in the future—since financial investments received in the present are
typically repaid in the future.
The market price system provides a highly efficient mechanism for disseminating information about relative scarcities of
goods, services, labor, and financial capital. Market participants do not need to know why prices have changed, only that the
changes require them to revisit previous decisions they made about supply and demand. Price controls hide information about
the true scarcity of products and thereby cause misallocation of resources.