


")


:")

")


 economics
Similar presentations:


")
")

Public Economics
1. Public Economics
Sergei Izmalkov"Where I am notwith
understood,
it shall be
assistance of
concluded that something very useful and
Alexander
Tonis
profound is couched underneath." J. Swift.
Based on slides by Aaron S. Yelowitz - Copyright 2005 © Worth Publishers prepared for J. Gruber “Public Finance and Public Policy.”
2. Requirements
4+ homeworksProject
Final exam
Distribution: 40-20-40
read before class
no cheating
3. Textbooks
J. Gruber "Public Finance and Public Policy,"Worth Publishers, 2007 or later editions
Russian translation also exists
Аткинсон, Энтони Б., Стиглиц, Джозеф Э.
(1995) "Лекции по экономической теории
государственного сектора", Изд. Аспект
Пресс, 1995.
4. Topics
1. Subject and methods of Public Finance.2. Externalities. Applications to Environment
and Health.
3. Public Goods. Optimal, private, and public
provision.
4. Political economy. Voting. Privatization.
Corruption.
5. Education. The role of government.
Competition. Returns to education.
5. Topics (cont)
6. Social Insurance. Adverse selection andmoral hazard.
7. Social security. Unemployment insurance.
8. Health Insurance. Public vs. Private. Health
Care Reforms.
9. Income Distribution and Welfare programs.
10. Overview of taxation topics.
11. Local public goods. Tiebout model.
12. Fiscal federalism.
6. Introduction What is the proper role of government?
Expenditure side: What services should thegovernment provide?
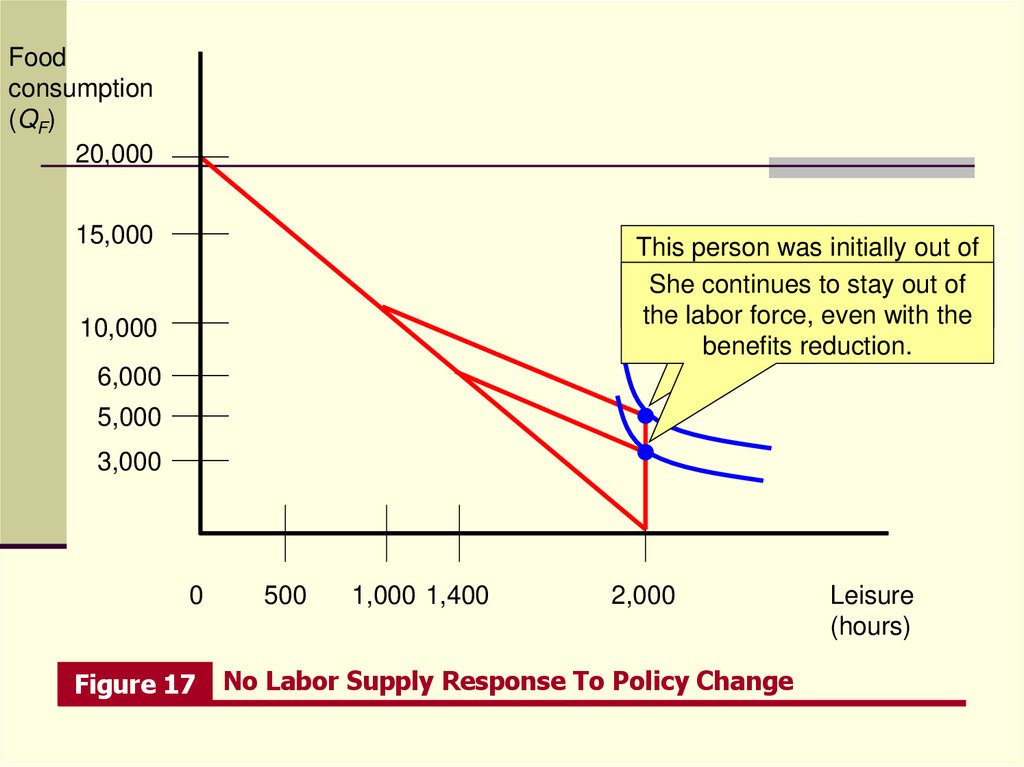
Taxation side: How should the government raise its
money?
7. THE FOUR QUESTIONS OF PUBLIC FINANCE
When should the government intervene in theeconomy?
How might the government intervene?
What is the effect of those interventions on
economic outcomes?
Why do governments choose to intervene in the
way that they do?
8. When Should the Government Intervene in the Economy?
Normally, private markets are competitive andefficient.
Generally hard to justify government intervention in
markets. But two main justifications are:
Market failures
Redistribution
“Abnormal” situations: crises, disasters.
9. When Should the Government Intervene? Market failures
“Problems” for markets:Externalities
Private (Asymmetric) Information
Small number of agents on one or both sides of the
market / market (monopoly) power
In the context of health insurance, some people are
uninsured…
10. When Should the Government Intervene? Market failures
In 2003, there were 45 million people withouthealth insurance in the United States, or 15.6% of
the population.
Does it imply that the market does not work?
Lack of insurance could cause negative
externalities from contagious disease–the
uninsured may not take account of their impact on
others.
11. When Should the Government Intervene? Market failures
Measles epidemic from 1989-1991, caused by lowimmunization rates for disadvantaged youth, was the
problem.
In 1960s: 3-4 m. cases, 500 deaths per year
In 1963 vaccine introduced; by 1980 less than 3000 cases per
year
1989-1991 a huge resurgence occurred: over 50000 cases and
123 deaths.
What happened?
Solution: Propaganda plus subsidy for vaccines for low-income
families.
Did it work?
Immunization rates increased from 70% to 90% in 1995: less
then 300 confirmed cases.
12. When Should the Government Intervene? Redistribution
Government may care about both the size of the“economic pie” as well as the size of each person’s
slice of that pie.
For example, society may value an additional $1 of
consumption by a poor person more highly than $1
of consumption by a rich person.
Redistribution is the shifting of resources from
some groups in society to others.
Other reasons?
13. When Should the Government Intervene? Redistribution
Of the uninsured, for example, roughly three-quarters are in families with incomes below the
median income level in the United States.
Society may feel that it is appropriate to redistribute
from those with insurance (who tend to have higher
incomes) to those without insurance (who tend to
have lower incomes).
Redistribution often involves efficiency losses.
The act of redistribution can change a person’s
behavior. Taxing the rich to distribute money to the
poor could cause both groups to work less hard.
14. How Might the Government Intervene?
If the government wants to intervene in a market, there are anumber of options:
Using the price mechanism with taxes or subsidies.
Tax credits that lower the “effective price” of health
insurance.
Mandate that either individuals or firms provide the good.
“Pay-or-play” mandates that require employers to provide
health insurance, such as California’s Health Insurance Act.
Public Provision
The Medicare program for U.S. senior citizens.
Public Financing of Private Provision
Medicare prescription drug cards, where private companies
administer the drug insurance.
15. What Are the Effects of Alternative Interventions?
Much of the focus of empirical public finance isassessing the “direct” and “indirect” effects of
government actions.
Direct effects of government actions assume “no
behavioral responses” and examine the intended
consequences of those actions.
Indirect effects arise because some people change
their behavior in response to an intervention. This
is sometimes called the “law of unintended
consequences.”
16. What Are the Effects of Alternative Interventions? Expanding health insurance
Direct effect of government provision of health insurance for theuninsured: Roughly 44 million Americans could be covered at cost
of $88 billion. This would be the intent of the law.
Indirect effect of such a policy: Some “crowd-out” of other
sources of health insurance for the “free” government health
insurance.
Potentially large, because nearly 200 million Americans had
private insurance in 2003.
If 90 million people dropped private insurance, this would
triple the cost to $268 billion.
If only 10% of people (20 million) dropped insurance, the
costs would rise to only $124 billion.
Key question: How many of these people would respond? The
theory does not provide guidance on magnitudes.
17. The Congressional Budget Office
Congressional Budget Office (CBO) providesnonpartisan analyses needed for economic decisions
of the government.
Plays role as “scorekeeper” by estimating costs.
Played a role in the defeat of the Clinton 1994
health care plan because of its estimate of the cost.
18. Why Do Governments Do What They Do?
Governments do not simply behave as benignactors who intervene only because of market failure
and redistribution.
Tools of political economy helps us understand
how governments make public policy decisions.
Just as market failures can lead to market
inefficiency, there are a host of government failures that
lead to inappropriate government intervention.
19. Why Do Governments Do What They Do?
For example, substantial variation across developedcountries in health care delivery suggests efficiency
and redistribution are not the only considerations.
U.S.: Private health insurance
Canada: National public health insurance
Germany: Mandates private health coverage
U.K.: Free national health care
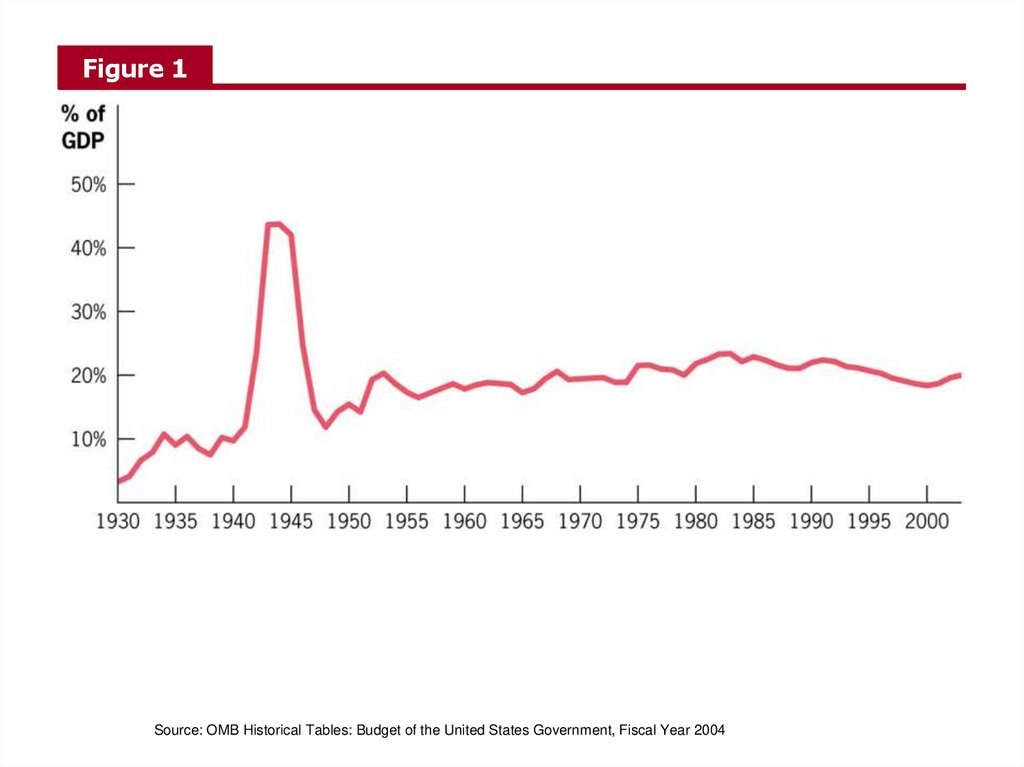
20. FACTS ON GOVERNMENT The size and growth of government
The “size” of the government is often measuredrelative to some benchmark, the most common one
being GDP. It adjusts the size of government for
inflation and population growth.
1930s: U.S. government spending 5% of GDP.
1970s onward: About 20% of GDP (Figure 1).
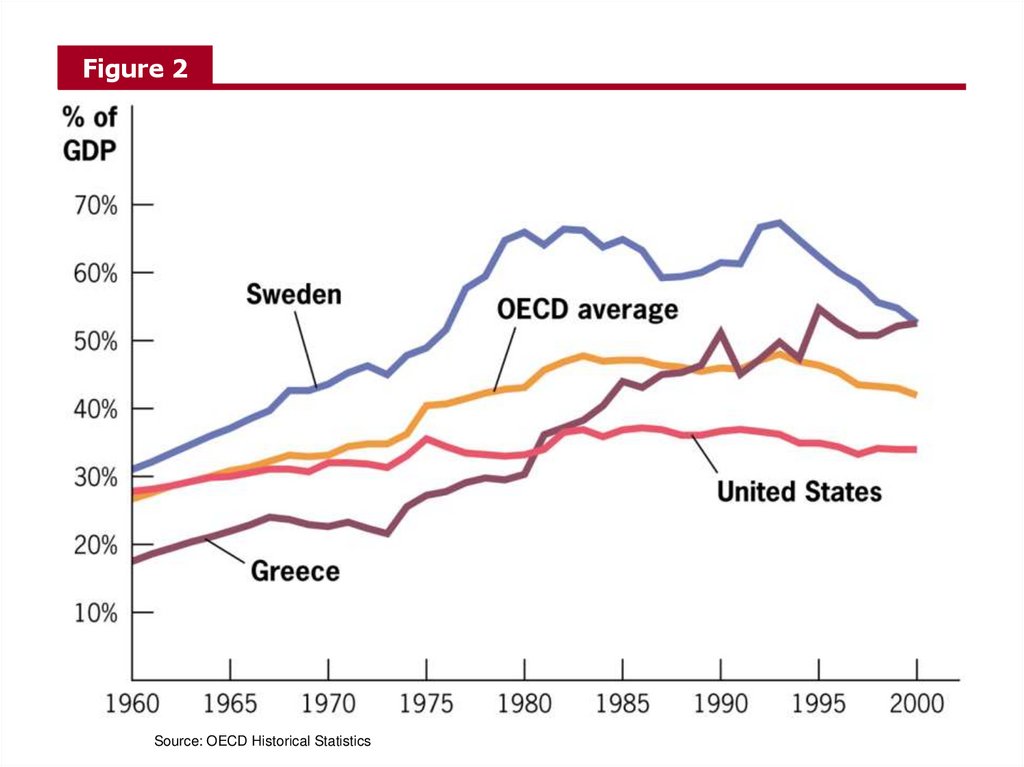
Trend is similar in other countries until 1960s; U.S.
government grew more slowly thereafter (Figure 2).
21.
Figure 1Source: OMB Historical Tables: Budget of the United States Government, Fiscal Year 2004
22.
Figure 2Source: OECD Historical Statistics
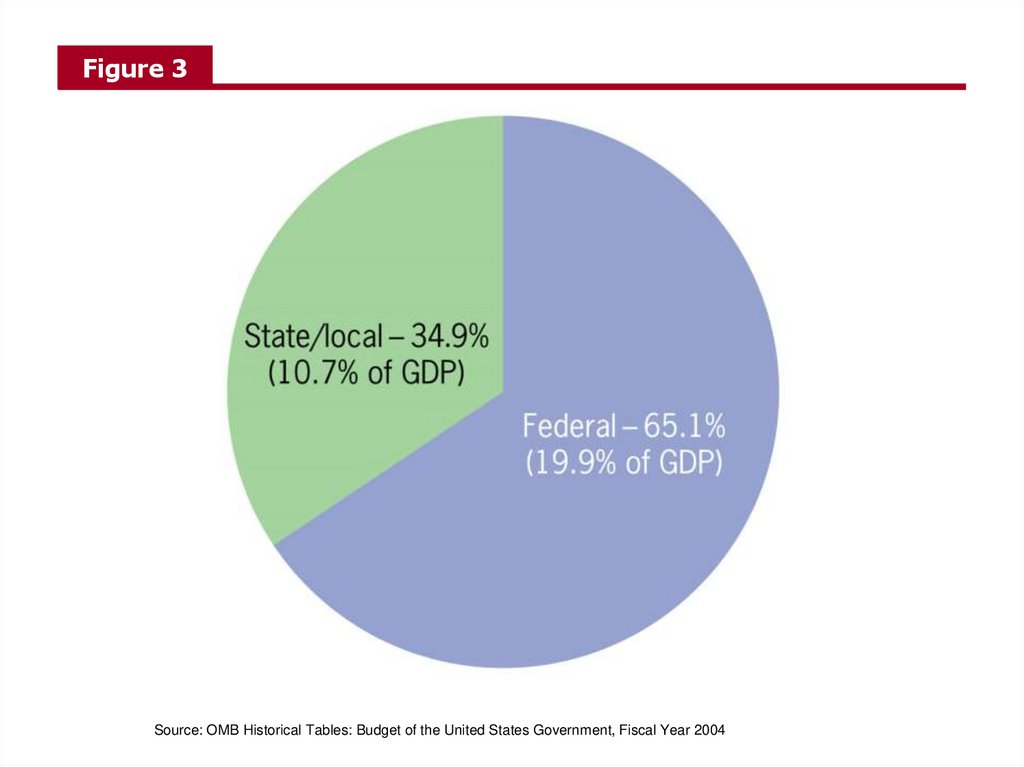
23. FACTS ON GOVERNMENT Decentralization and budgeting
Other featuresDecentralization: In the United States., local, state
and federal governments all spend substantial
amounts of money (Figure 3).
Spending, taxes, deficits, and debts: Federal
government was close to a balanced budget until the
mid-1970s (Figure 4).
24.
Figure 3Source: OMB Historical Tables: Budget of the United States Government, Fiscal Year 2004
25.
Figure 4Source: OMB Historical Tables: Budget of the United States Government, Fiscal Year 2004
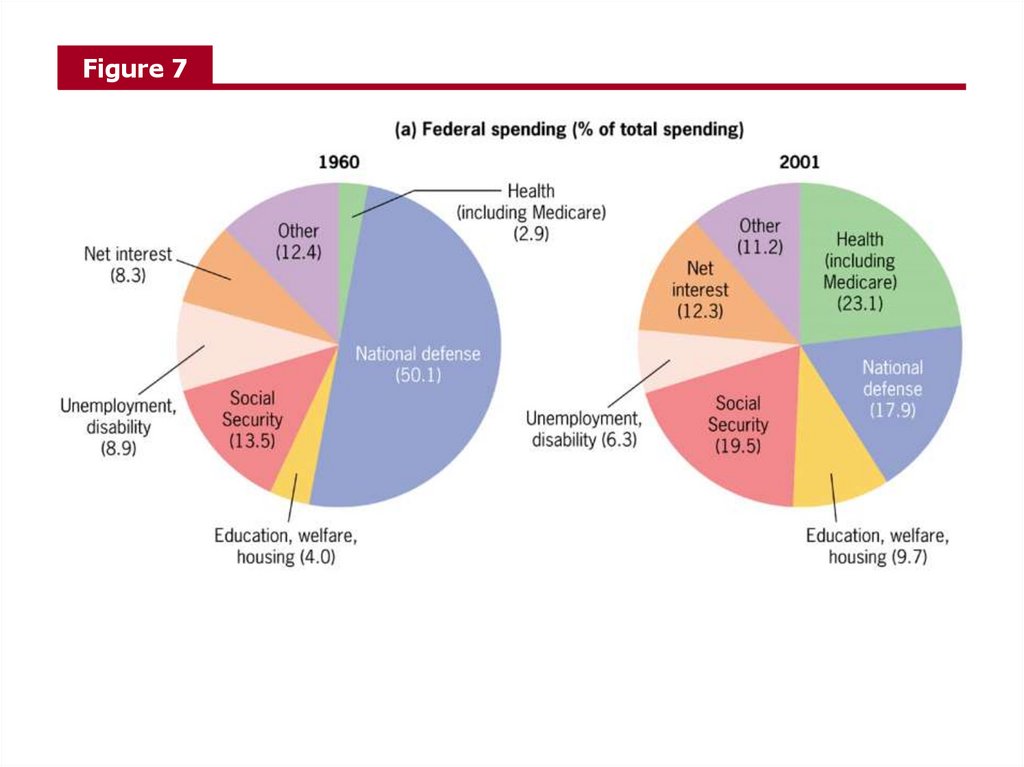
26. FACTS ON GOVERNMENT Distribution of spending
Other featuresDistribution of spending (Figure 7).
In 1960: over half of federal government spending on
defense (a classic “public good”).
In 2001: Less than 20% of budget for defense, much
more devoted to social insurance programs.
Distribution in state and local spending has not changed
as dramatically; education makes up the single largest
component of spending.
27.
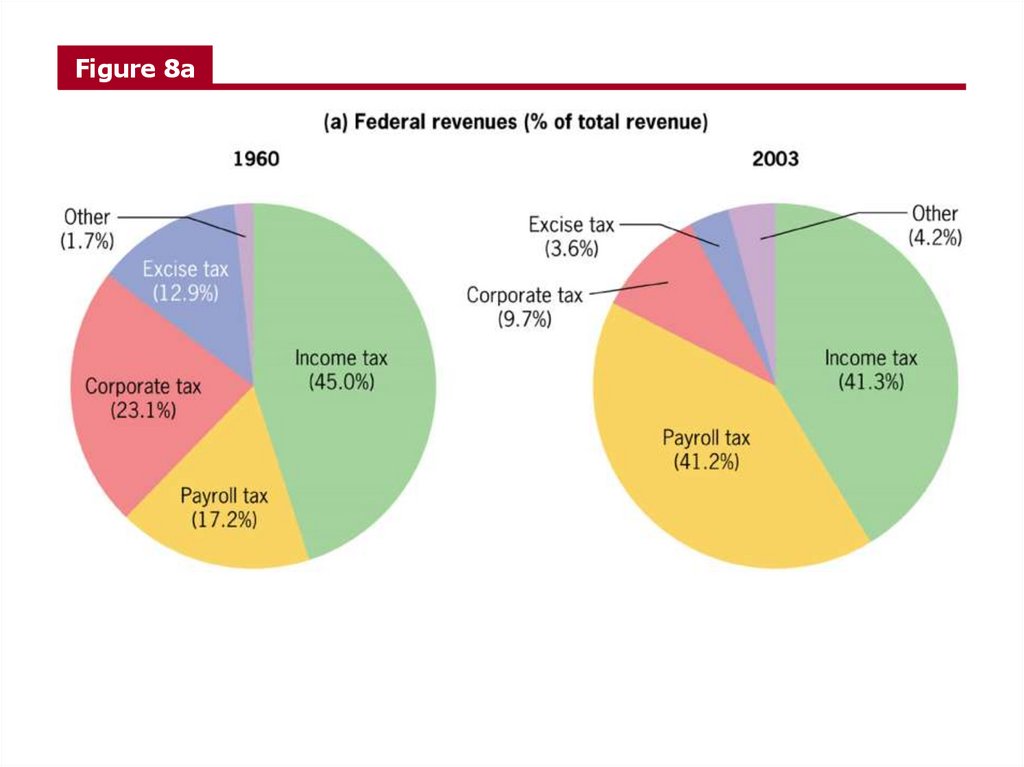
Figure 728. FACTS ON GOVERNMENT Distribution of revenue sources
Other featuresDistribution of revenue (Figure 8a and 8b).
The individual income tax provides somewhat less than
half of federal revenue and has remained roughly
constant over time.
Big decline in revenue from corporate income tax, now less
than 10% of federal tax revenue.
Reduction in excise taxes.
Large growth in payroll taxes; now one-third of revenue.
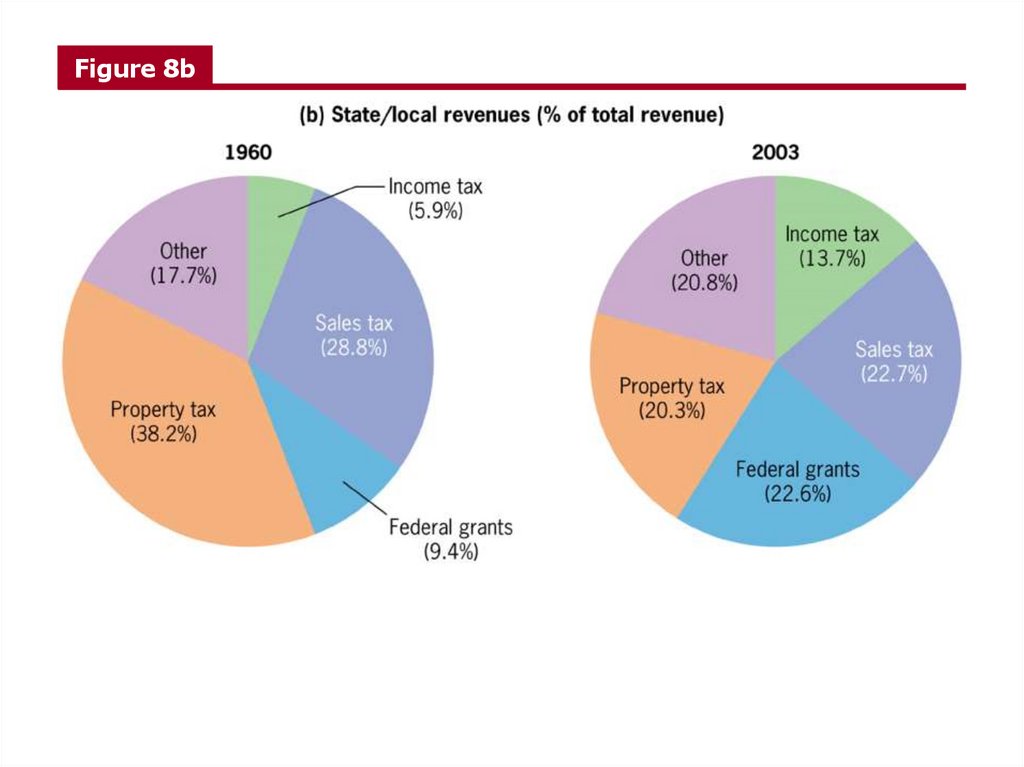
29. FACTS ON GOVERNMENT Distribution of revenue sources
Other featuresDistribution of revenue different at state/local level.
Sales taxes
Grants-in-aid (from federal government)
Income taxes
Property taxes
Roughly equal in importance.
30.
Figure 8a31.
Figure 8b32. FACTS ON GOVERNMENT Regulatory role of the government
Other featuresRegulatory role–does not usually show up as a
government “cost” but does increase the reach of
government.
FDA regulates nearly 25% of consumer
expenditures.
OSHA regulates workplace safety at 7 million job
sites.
FCC, EPA.
33. Recap
Four key questions in public financeWhen should the government intervene in the economy?
How might the government intervene?
What is the effect of those interventions on economic
outcomes?
Why do governments choose to intervene in the way that they
do?
How should the government intervene?
What is the optimal size of the government?
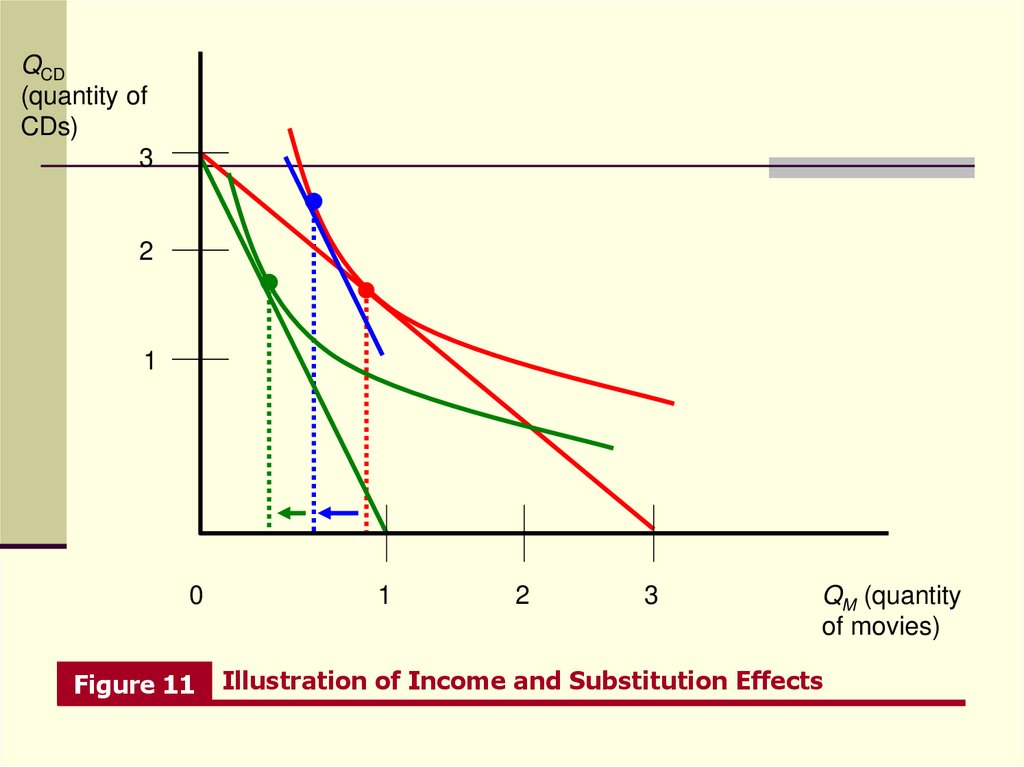
34. Theoretical tools (recap):
Income and substitution effects. Equivalent andcompensating variations. Consumer surplus.
What are the social objectives?
Asymmetric information modeling: adverse
selection and moral hazard.
Mechanism design: auctions/procurement/voting
schemes/optimal taxation.
Dynamic optimization.
35.
QCD(quantity of
CDs)
3
2
1
0
Figure 11
1
2
3
QM (quantity
of movies)
Illustration of Income and Substitution Effects
36. Spectrum auctions:
Governments sell licenses to use a certain range offrequencies (electromagnetic spectrum).
Many auctions. 3G are of particular interest.
“All” European countries “at the same time’’ conducted such
auctions. (2000-01)
What are your expectations about the price per capita?
Findings: UK 650 Euro/pc
Total: 39 Bln Euros, 2.5%
of GDP (!)
Switzerland : Expectations 1000 Epc after UK auction; 400600 Epc a week before.
Result: 20 Euro/pc
Problems: Low Reserve, “allowed collusion.”
37. Dynamic Optimal taxation. (Acemoglu, Golosov, Tsyvinski)
38. PUTTING THE TOOLS TO WORK TANF and labor supply among single mothers
TANF is “Temporary Assistance for NeedyFamilies.”
Cash welfare for poor families, mainly single
mothers.
For example, in New Mexico, family of three
receives $389 per month.
Assume the two “goods” in utility maximization
problem are leisure and food consumption.
Whatever time is not devoted to leisure is spent
working and earning money.
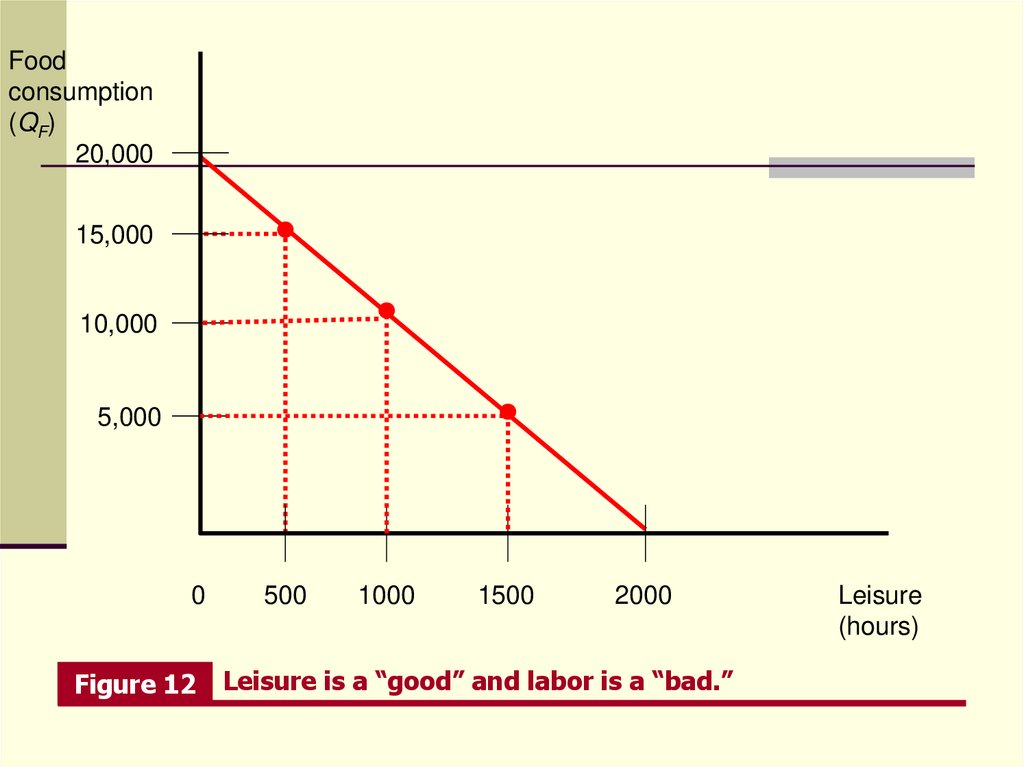
39. PUTTING THE TOOLS TO WORK Identifying the budget constraint
What does the budget constraint look like?Assume the person can work up to 2000 hours per
year, at a wage rate of $10 per hour, and that TANF
is not yet in place.
Price of food is $1 per unit.
40. PUTTING THE TOOLS TO WORK Identifying the budget constraint
The “price” of one hour of leisure is the hourlywage rate.
Creates a direct tradeoff between leisure and food:
each hour of work brings her 10 units of food.
Figure 12 illustrates this.
41.
Foodconsumption
(QF)
20,000
15,000
10,000
5,000
0
Figure 12
500
1000
1500
2000
Leisure is a “good” and labor is a “bad.”
Leisure
(hours)
42. PUTTING THE TOOLS TO WORK The effect of TANF on the budget constraint
Now, let’s introduce TANF into the framework.TANF has two key features:
Benefit guarantee, G – amount that a recipient with
$0 earnings gets.
Benefit reduction rate, J – rate at which benefit
guarantee falls as earnings increases.
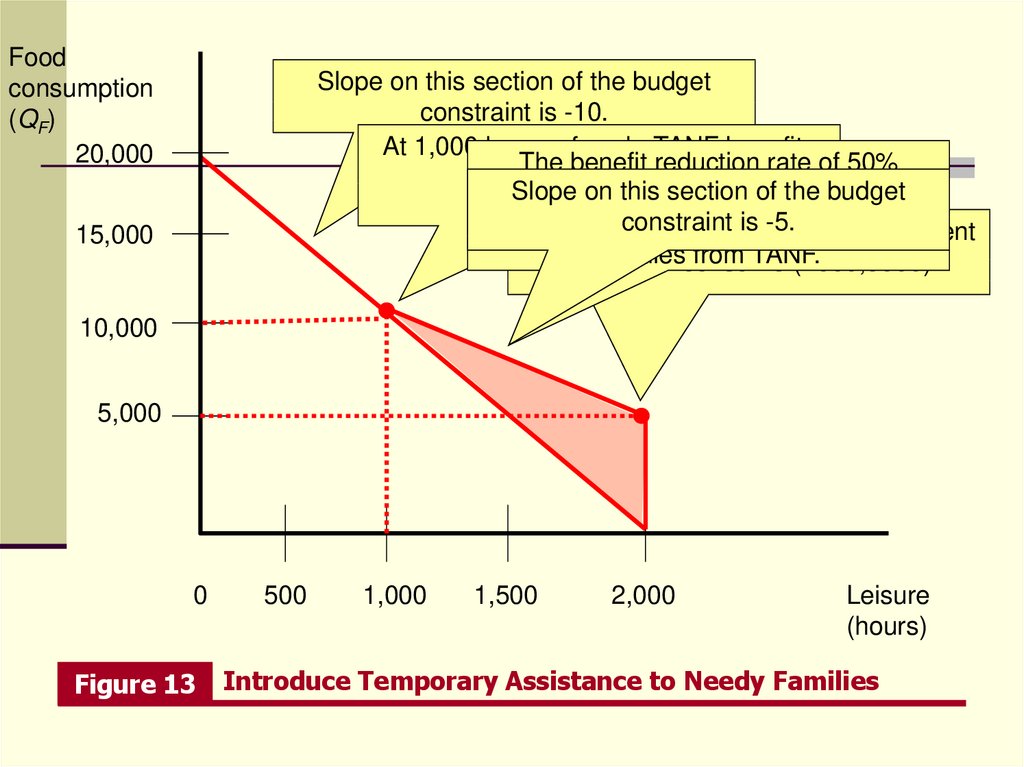
43. PUTTING THE TOOLS TO WORK The effect of TANF on the budget constraint
Assume that benefit guarantee, G, is $5,000 per year.Assume the benefit reduction rate, J, is 50%.
Figure 13 illustrates this.
44.
Foodconsumption
(QF)
20,000
Slope on this section of the budget
constraint is -10.
At 1,000 hours of work, TANF benefits
The benefit reduction rate of 50%
fall to zero.
Slope onthe
thisguarantee
section ofas
theearnings
budget
reduces
constraint
isrepresents
-5. that a new
increase.
Green
area
$5000 guarantee
means
recipient
bundles
from TANF.
could
now consume
(2000,5000).
15,000
10,000
5,000
0
Figure 13
500
1,000
1,500
2,000
Leisure
(hours)
Introduce Temporary Assistance to Needy Families
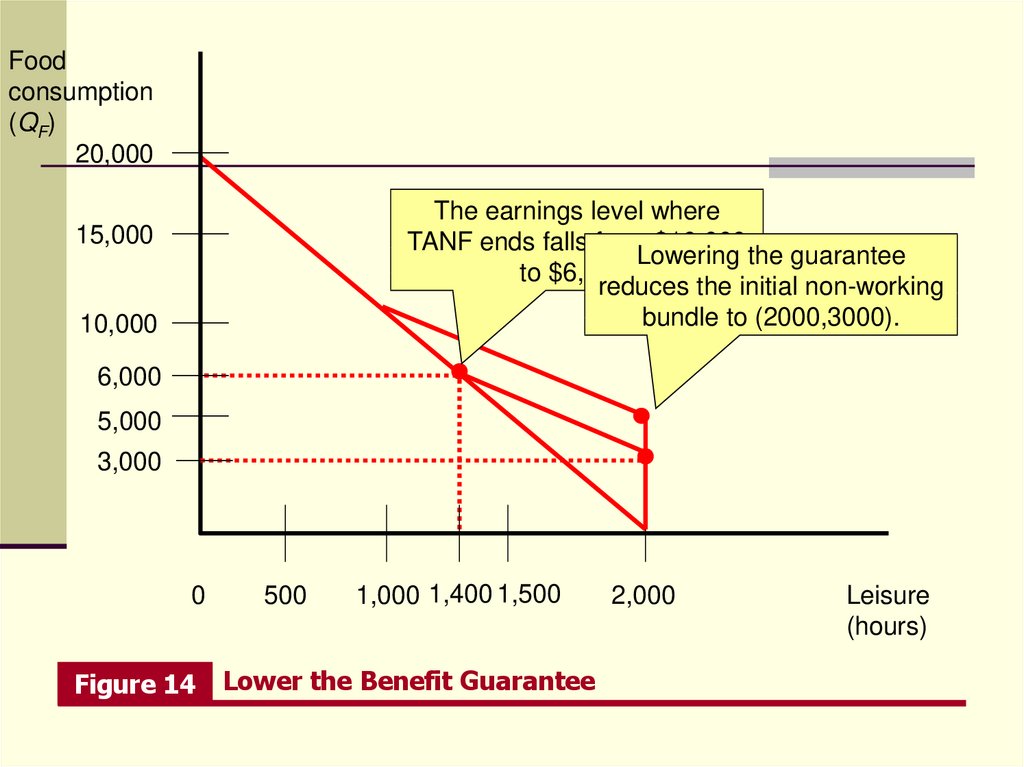
45. PUTTING THE TOOLS TO WORK The effect of changes in the benefit guarantee
One possible “policy experiment” is reducing thebenefit guarantee level G.
What happens when G falls from $5,000 to $3,000,
holding all other parameters constant?
Figure 14 illustrates this.
46.
Foodconsumption
(QF)
20,000
The earnings level where
TANF ends falls from $10,000
Lowering the guarantee
to $6,000.
reduces the initial non-working
bundle to (2000,3000).
15,000
10,000
6,000
5,000
3,000
0
Figure 14
500
1,000 1,400 1,500
Lower the Benefit Guarantee
2,000
Leisure
(hours)
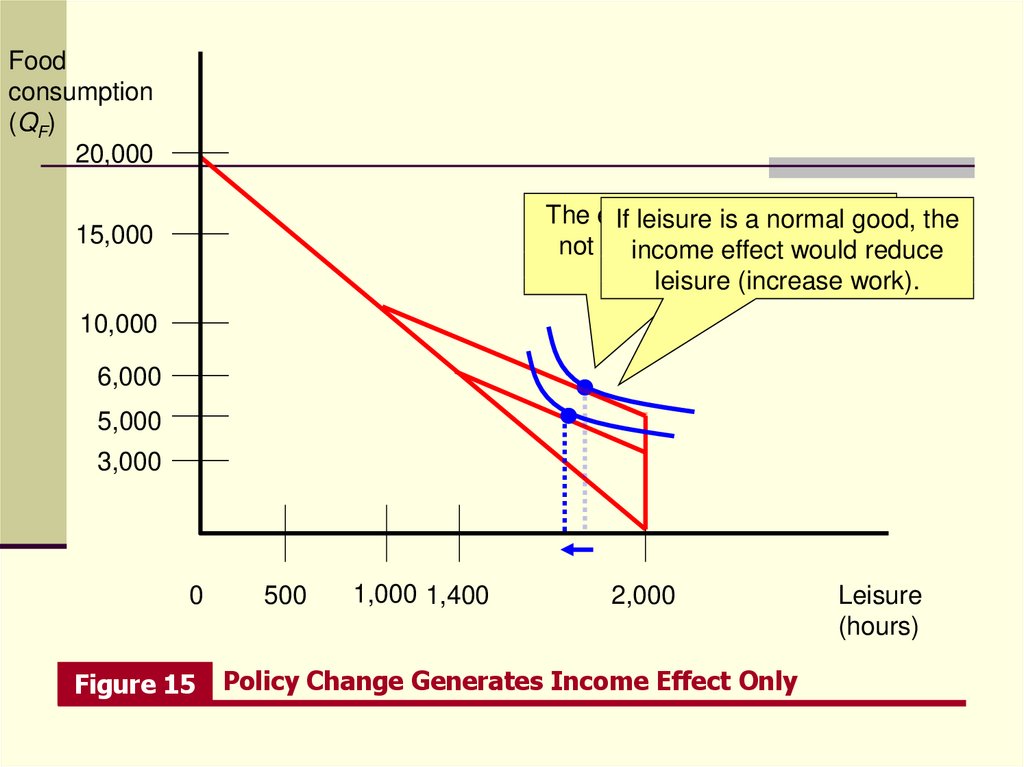
47. PUTTING THE TOOLS TO WORK How large will the labor supply response be?
What is the expected labor supply response to sucha policy change?
It depends on where the single mother initially was
on the budget constraint.
If she initially earned less than $6,000 per year, the
policy change involves only an income effect, not a
substitution effect.
Figure 15 illustrates this.
48.
Foodconsumption
(QF)
20,000
The effective
rate does
If leisurewage
is a normal
good, the
not change
foreffect
this person.
income
would reduce
leisure (increase work).
15,000
10,000
6,000
5,000
3,000
0
Figure 15
500
1,000 1,400
2,000
Policy Change Generates Income Effect Only
Leisure
(hours)
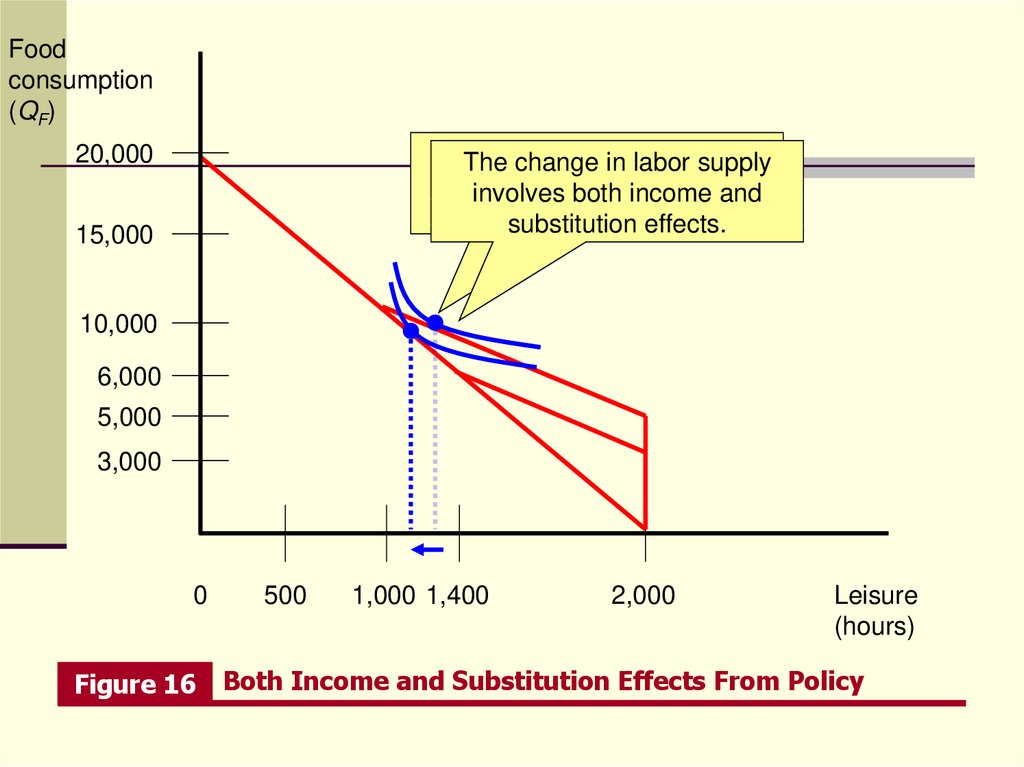
49. PUTTING THE TOOLS TO WORK How large will the labor supply response be?
If she initially earned between $6,000 and $10,000per year, the policy change involves both an income
and substitution effect.
The substitution and income effects go in the same
direction.
Figure 16 illustrates this.
50.
Foodconsumption
(QF)
20,000
The change
effectiveinwage
The
laborrate
supply
changes
thisincome
person.
involvesfor
both
and
substitution effects.
15,000
10,000
6,000
5,000
3,000
0
Figure 16
500
1,000 1,400
2,000
Leisure
(hours)
Both Income and Substitution Effects From Policy
51. PUTTING THE TOOLS TO WORK How large will the labor supply response be?
Economic theory clearly suggests that such a benefitreduction will increase labor supply, but does not
speak to the magnitude of the response.
For example, some welfare recipients who were not
initially working continue to choose not to work.
Figure 17 illustrates this.
52.
Foodconsumption
(QF)
20,000
15,000
This person was initially out of
the labortoforce.
She continues
stay out of
the labor force, even with the
benefits reduction.
10,000
6,000
5,000
3,000
0
Figure 17
500
1,000 1,400
2,000
No Labor Supply Response To Policy Change
Leisure
(hours)
53. PUTTING THE TOOLS TO WORK How large will the labor supply response be?
The actual magnitude of the labor supply responsetherefore depends on the preferences of various
welfare recipients.
To the extent the preferences are more like the first
two cases, the larger the labor supply response.
Thus, theory alone cannot say whether this policy
change will increase labor supply, or by how much.
Must analyze available data on single mothers to
figure out the magnitude.
54. WELFARE IMPLICATIONS OF BENEFIT REDUCTIONS: TANF continued
Efficiency and equity considerations in introducingor cutting TANF benefits.
In a typical labor supply/labor demand framework,
these changes shift the labor supply curve for single
parents.
Figure 27 illustrates this.
55.
WageEquilibrium
Inefficient,with
but generous
entails
substantial
TANF
redistribution.
benefit.
Entails
Equilibrium
some
redistribution
with TANF
w3
Labor
supply
Labor
supply
and some
benefit
inefficiency.
cut.
Equilibrium with no
government intervention,
no deadweight loss.
Labor
supply
w2
w1
Labor
demand
H3
Figure 27
H2
H1
Hours
worked
Market Equilibrium with Labor Supply and Demand
56. WELFARE IMPLICATIONS OF BENEFIT REDUCTIONS: TANF continued
Different policies involve different deadweight losstriangles, but also different levels of redistribution for the
poor.
SWF helps determine the right policy for society.
SWF U i
i
Is SWF the right objective?
Why its maximization might lead to an outcome that is not
efficient (why redistribution necessary)?
How to do it in practice?