Similar presentations:
Основы системного администрирования. Мониторинг производительности и устранение неполадок
1. Глава 20
Основы системного администрирования. Часть 2.Глава 20
Мониторинг производительности
и устранение неполадок
2. Обзор главы
• Инструменты мониторинга• Использование Performance Monitor
• Мониторинг журналов событий
3. 20.1. Инструменты мониторинга
• Обзор Task Manager• Обзор Performance Monitor
• Обзор Resource Monitor
• Обзор Reliability Monitor
• Обзор Event Viewer
• Мониторинг сервера с помощью Server
Manager
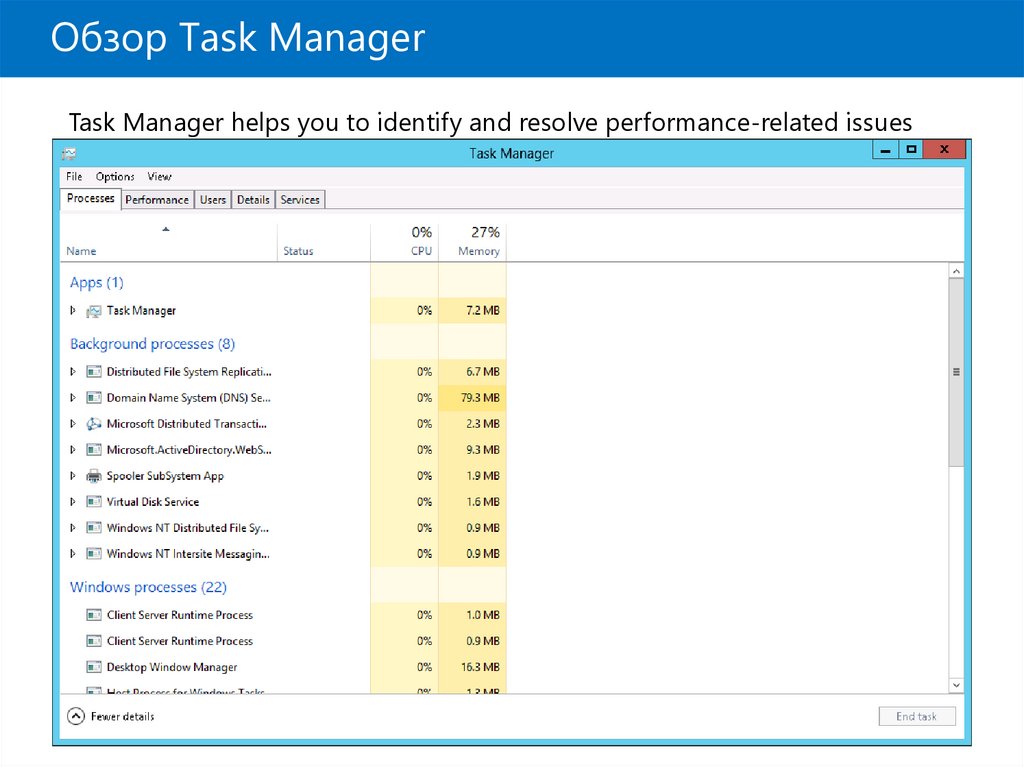
4. Обзор Task Manager
Task Manager helps you to identify and resolve performance-related issues5. Обзор Performance Monitor
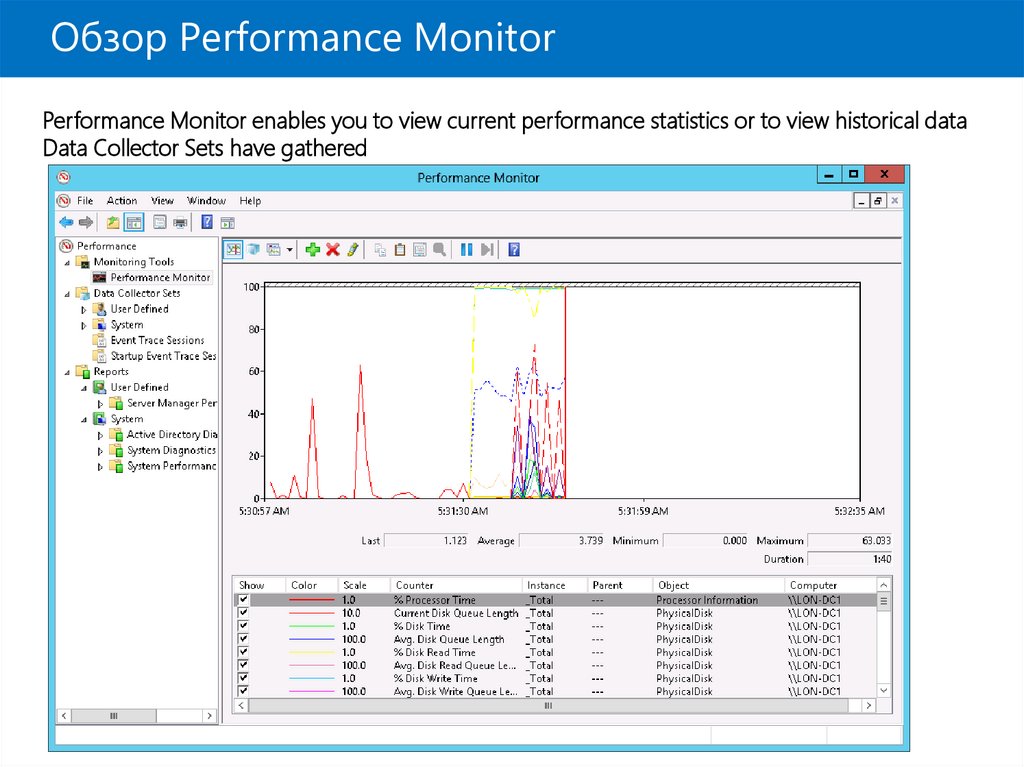
Performance Monitor enables you to view current performance statistics or to view historical dataData Collector Sets have gathered
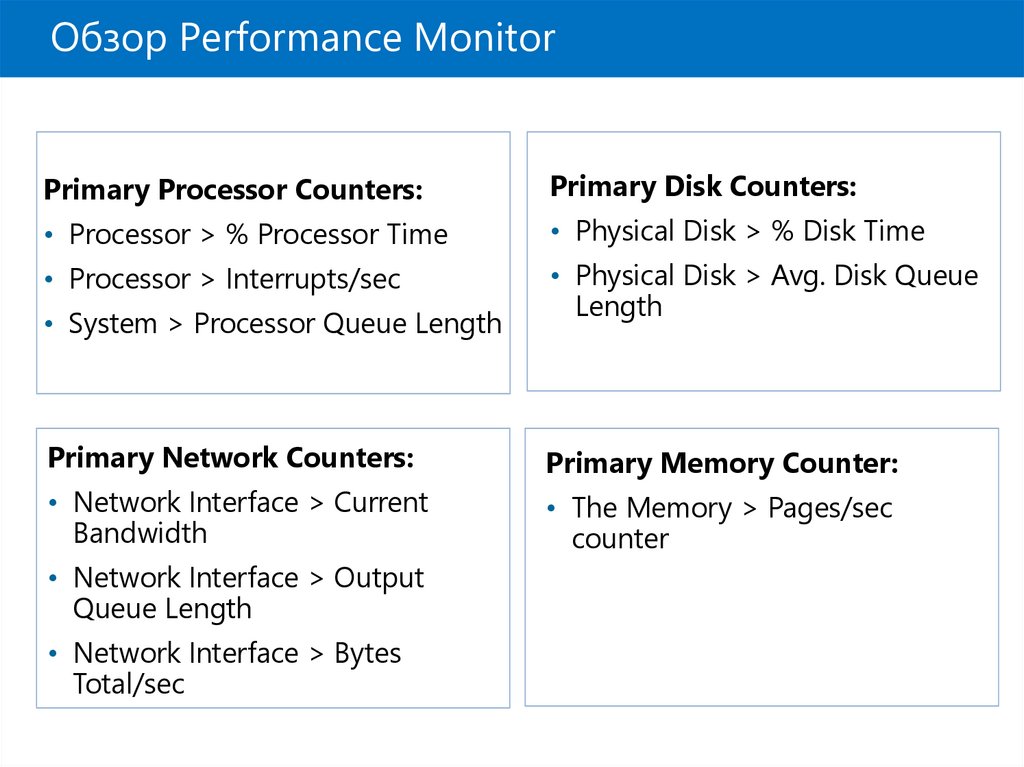
6. Обзор Performance Monitor
Primary Processor Counters:Primary Disk Counters:
• Processor > % Processor Time
• Physical Disk > % Disk Time
• Processor > Interrupts/sec
• Physical Disk > Avg. Disk Queue
Length
• System > Processor Queue Length
Primary Network Counters:
Primary Memory Counter:
• Network Interface > Current
Bandwidth
• The Memory > Pages/sec
counter
• Network Interface > Output
Queue Length
• Network Interface > Bytes
Total/sec
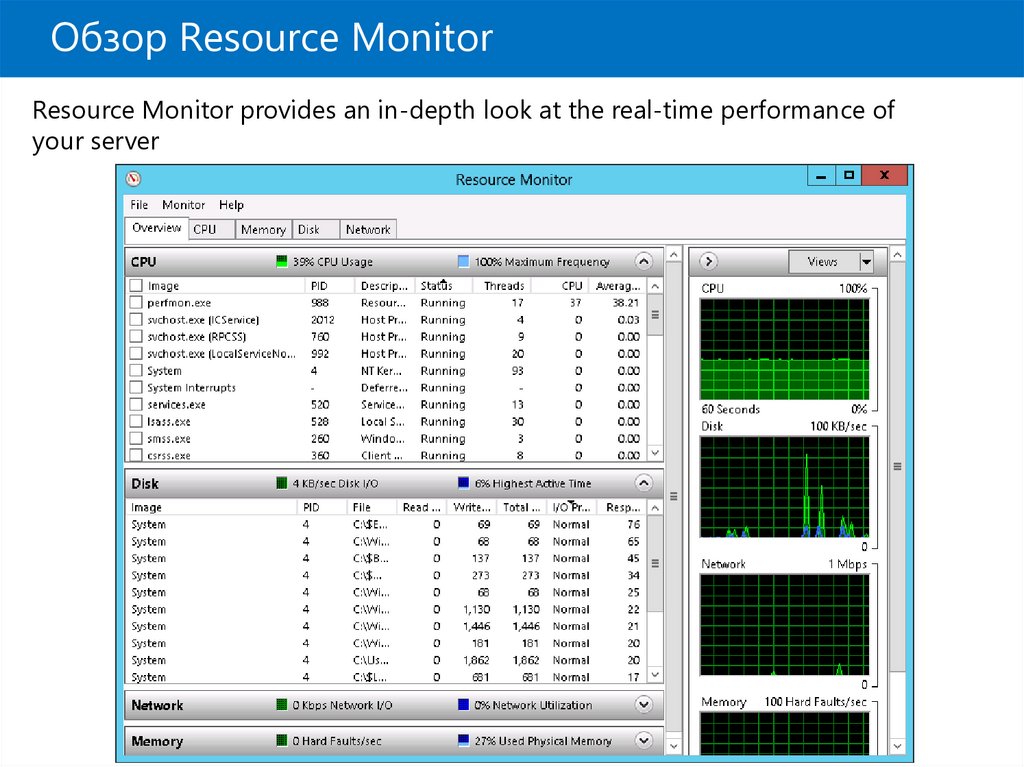
7. Обзор Resource Monitor
Resource Monitor provides an in-depth look at the real-time performance ofyour server
8. Обзор Reliability Monitor
• Monitors hardware and software issues• Provides Stability Index number (from 1 to 10)
• 1 represents lowest stability
• 10 represents highest stability
• Reliability monitor window components include:
• Historical reports on stability index
• Reliability details
• Action to be performed: saving historical data, starting
Problem Reports console, checking online for a
solution to specific problem
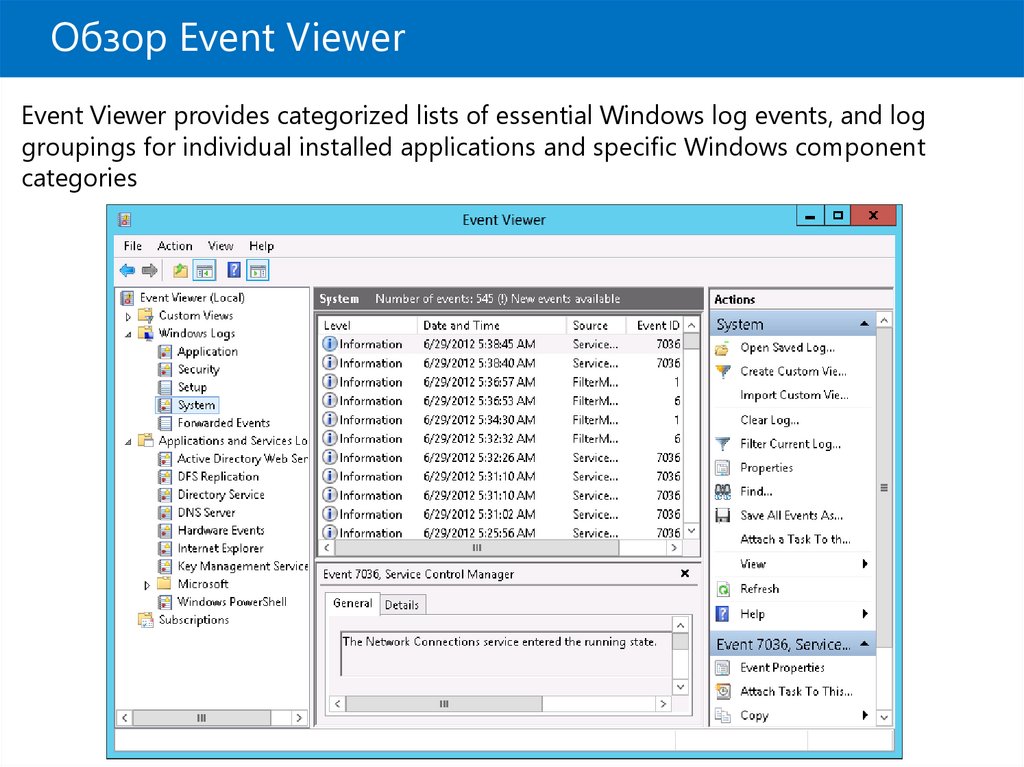
9. Обзор Event Viewer
Event Viewer provides categorized lists of essential Windows log events, and loggroupings for individual installed applications and specific Windows component
categories
10. Обзор Event Viewer
• Event Viewer provides the ability to• View multiple logs
• Create customized views
• Configure tasks scheduled to run in response to events
• Create and manage event subscriptions
• Event Viewer has many built-in logs such as
• Application log
• Security log
• Setup log
• System log
• Forwarded events
11. Мониторинг сервера с помощью Server Manager
Server Manager console:• Installed by default on Windows Server 2012, can
be installed on Windows 8
• Supports monitoring of Windows Server
operating systems
• Provides a centralized monitoring dashboard
• Analyzes or troubleshoots different types of
issues
• Identifies critical events
• Monitors the status of Best Practices Analyzer
tool
12. 20.2. Использование Performance Monitor
• Performance Baselines, Trends, and CapacityPlanning
• What Are Data Collector Sets?
• Demonstration: Capturing Counter Data with a
Data Collector Set
• What Are Alerts?
• Demonstration: Configuring an Alert
• Demonstration: Viewing Reports in Performance
Monitor
• Monitoring Network Infrastructure Services
• Considerations for Monitoring Virtual Machines
13. Performance Baselines, Trends, and Capacity Planning
• By calculating performance baselines for your serverenvironment, you can more accurately interpret real-time
monitoring information
• By establishing a baseline, you can:
• Interpret performance trends
• Perform capacity planning
• Identify bottlenecks
• Analyze performance trends to predict when existing
capacity is likely to be exhausted
• Plan the capacity for the key hardware components:
processor, disk, memory and network
14. What Are Data Collector Sets?
• Data collector sets enable you to gather performance-related and other system statistics for analysis
• Data collector sets can contain the following types of
data collectors:
• Performance counters
• Event trace data
• System configuration information
15. Demonstration: Capturing Counter Data with a Data Collector Set
In this demonstration, you will see how to:• Create a data collector set
• Create a disk load on the server
• Analyze the resulting data in a report
16.
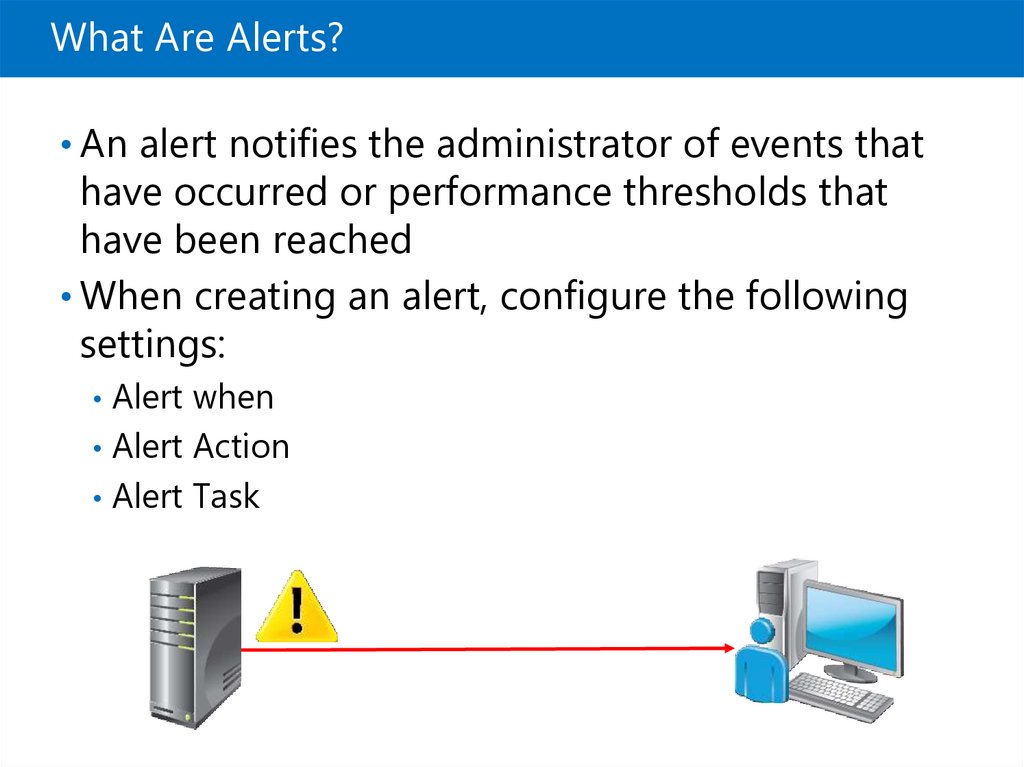
What Are Alerts?• An alert notifies the administrator of events that
have occurred or performance thresholds that
have been reached
• When creating an alert, configure the following
settings:
Alert when
• Alert Action
• Alert Task
17.
Demonstration: Configuring an AlertIn this demonstration, you will see how to:
• Create a data collector set with an alert counter
• Generate a server load that exceeds the configured
threshold
• Examine the event log for the resulting event
18. What Are Alerts?
Demonstration: Viewing Reports in PerformanceMonitor
In this demonstration, you will see how to view a
performance report
19. Demonstration: Configuring an Alert
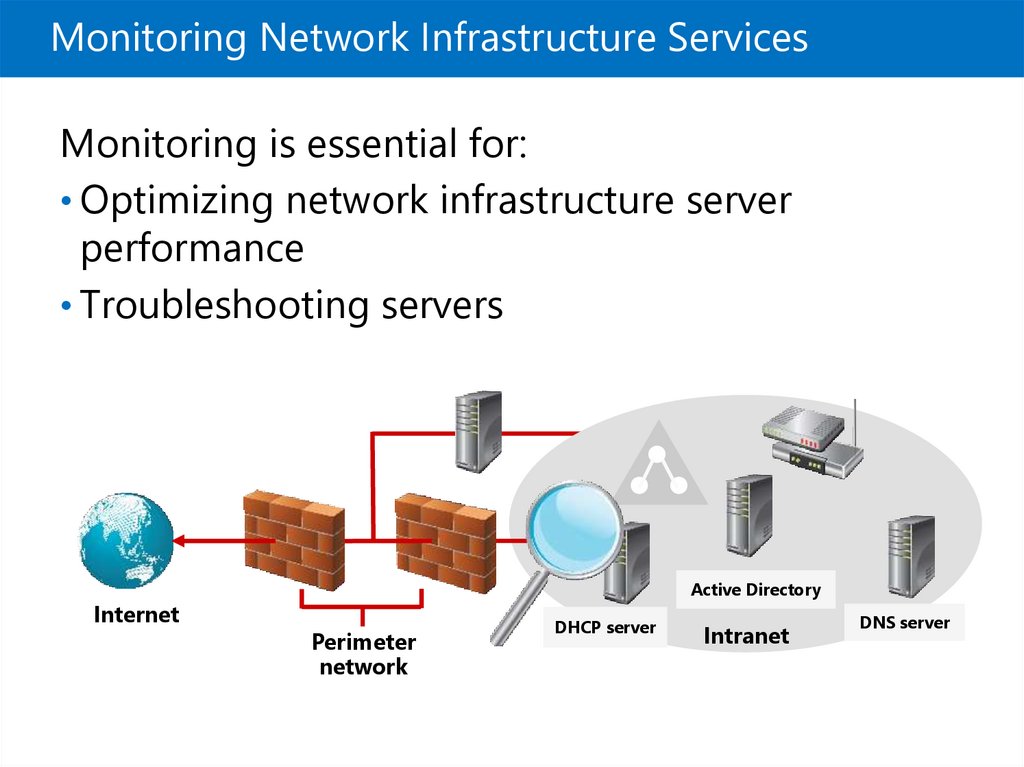
Monitoring Network Infrastructure ServicesMonitoring is essential for:
• Optimizing network infrastructure server
performance
• Troubleshooting servers
Internet
Active Directory
Perimeter
network
DHCP server
Intranet
DNS server
20.
Considerations for Monitoring Virtual MachinesConsiderations for monitoring virtual machines:
• Virtual machines must be assigned sufficient
resources for their workload
• If multiple virtual machines run on a host, ensure
the host has enough resources
• Resources are shared, so performance of one
virtual machine can affect the performance of
others
• You must remember to monitor the resource
utilization on the host as well as the guests
21. Demonstration: Viewing Reports in Performance Monitor
20.3. Мониторинг журналов событий• Using Server Manager to View Event Logs
• What Is a Custom View?
• Demonstration: Creating a Custom View
• What Are Event Subscriptions?
• Demonstration: Configuring an Event Subscription
22. Monitoring Network Infrastructure Services
Using Server Manager to View Event Logs• Server Manager provides a centralized location
for event logs from remote servers
• Event logging
Enabled by default
• Categorized by technology: AD DS, DNS, Remote
Access
• Customized views
• Create queries for specific types of events that need to
be displayed
• Configure event data that needs to be displayed
23. Considerations for Monitoring Virtual Machines
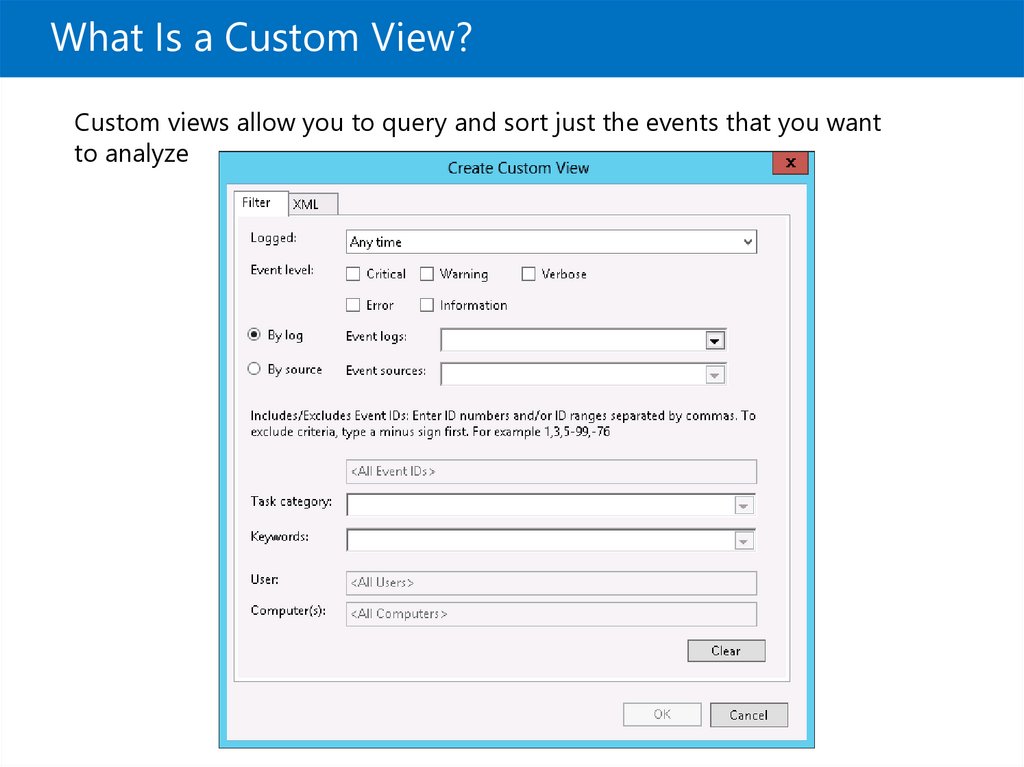
What Is a Custom View?Custom views allow you to query and sort just the events that you want
to analyze
24. 20.3. Мониторинг журналов событий
Demonstration: Creating a Custom ViewIn this demonstration, you will see how to:
• View Server Roles custom views
• Create a custom view
25. Using Server Manager to View Event Logs
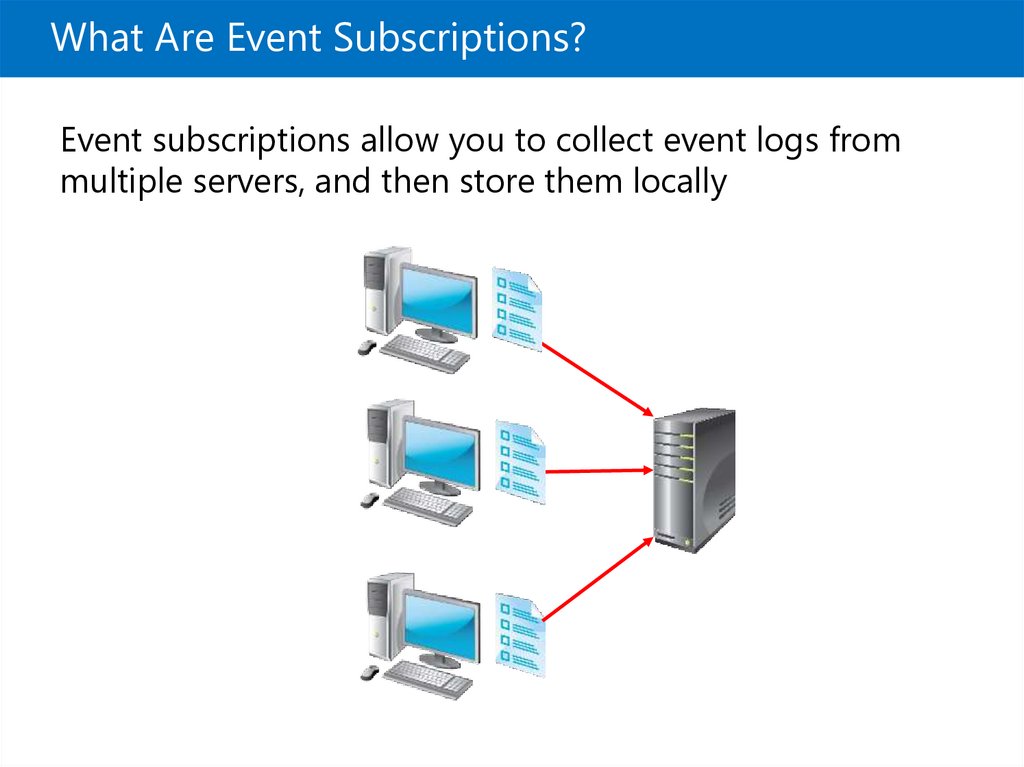
What Are Event Subscriptions?Event subscriptions allow you to collect event logs from
multiple servers, and then store them locally
26. What Is a Custom View?
Demonstration: Configuring an EventSubscription
In this demonstration, you will see how to:
• Configure the source computer
• Configure the collector computer
• Create and view the subscribed log




 internet


