Similar presentations:
Network monitoring & forensics
1. Network Monitoring & Forensics
Network Monitoring &Forensics
Jim Irving
1
2. Agenda
Network ForensicsUsefulness
Intro to forensic data types
Working with PCAP data
What it looks like
How to interpret it
How to get it
Working with flow data
What it looks like
How to interpret it
How to get it
Host Forensics
PCAP and flow recap
Working with logs and alerts
What they look like
How to interpret them
Getting them all in one place
SIEM’s and their familiars
Fielding a monitoring solution
2
3. Introduction
Networkforensics is the capture, recording, and
analysis of network events in order to discover the
source of security attacks or other problem incidents.
Course
Goal: To give the student a broad understanding of the
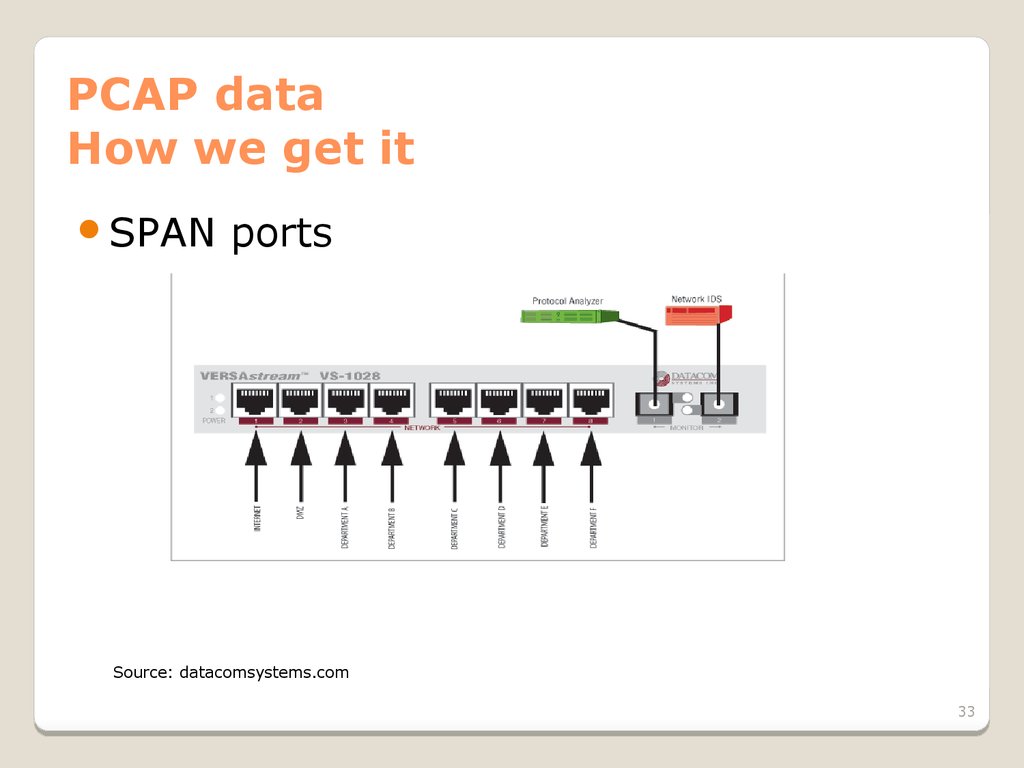
main types of network forensic data gathering and an
introduction to low level concepts necessary for a proper
understanding of the task of performing network forensics.
After completion, a student should be able to plan and
execute a reasonable network monitoring program and use
the gathered forensic data to perform a wide range of
investigations.
3
4. Benefits
Whydo you care
If this isn’t in your toolbelt already, you’ll get a
lot of new capabilities when you go on a
project.
If you’re already seasoned, you can learn from
everyone else here.
Why
do I care
The Socratic method works.
4
5. Disclaimer
The information and views presented duringthis course concerning software or hardware
does not in any way constitute a
recommendation or an official opinion. All
information presented here is meant to be
strictly informative. Do not use the tools or
techniques described here unless you are
legally authorized to do so.
5
6. Agenda
Day 1Agenda and motivation
Intro to forensic data types
Working with PCAP data
What it looks like
How to interpret it
How to get it
Working with flow data
What it looks like
How to interpret it
How to get it
Day 2
PCAP and flow recap
Working with logs and alerts
What they look like
How to interpret them
Getting them all in one place
SIEM’s and their familiars
Fielding a monitoring solution
6
7. Performing Network Forensics What do we need to know?
Whatdoes our network even look like?
Are we being attacked?
Is anything compromised?
How did it get compromised?
Where are the attacks coming from?
7
8. Performing Network Forensics What do we have to work with?
Loadsof recorded network data
(PCAP and flow)
Logs and alerts from security products
Logs from applications
8
9. Main types of forensic data
We’llbe grouping forensic data into three
main data types based on the tools and
analysis techniques used
Full packet capture (PCAP)
Flow data (netflow, IPFIX, etc.)
Log / alert data (giant text files)
9
10. Forensic Data Type #1 Full Packet Capture (PCAP)
Afull copy* of a set of packets travelling
over the network
The most complete form of monitoring
possible
Takes up a lot of space
*it’s possible to do partial captures, too
10
11. Forensic Data Type #2 Flow Data
Recordsof conversations on the network
Stores info such as time, duration,
number of packets, total bytes sent,
received, etc.
Does not contain any application layer
data
Good for understanding how data flows on
your network quickly
11
12. Forensic Data Type #3 Log/Alert data
Anytext that gets written to a file that we
can monitor
Some of it is very important (firewall
alerts, availability alerts, etc.) and some
of it is less so
We have to set up things to produce
GOOD alerts
There are a lot of log sources, so some
sort of management is preferable
12
13. Forensic Bonus Data People
Thisis when someone comes up to you
and tells you that they can’t connect to
the network, the mail server is down, etc.
Pretty darned close to real time
Hard to digitize…
13
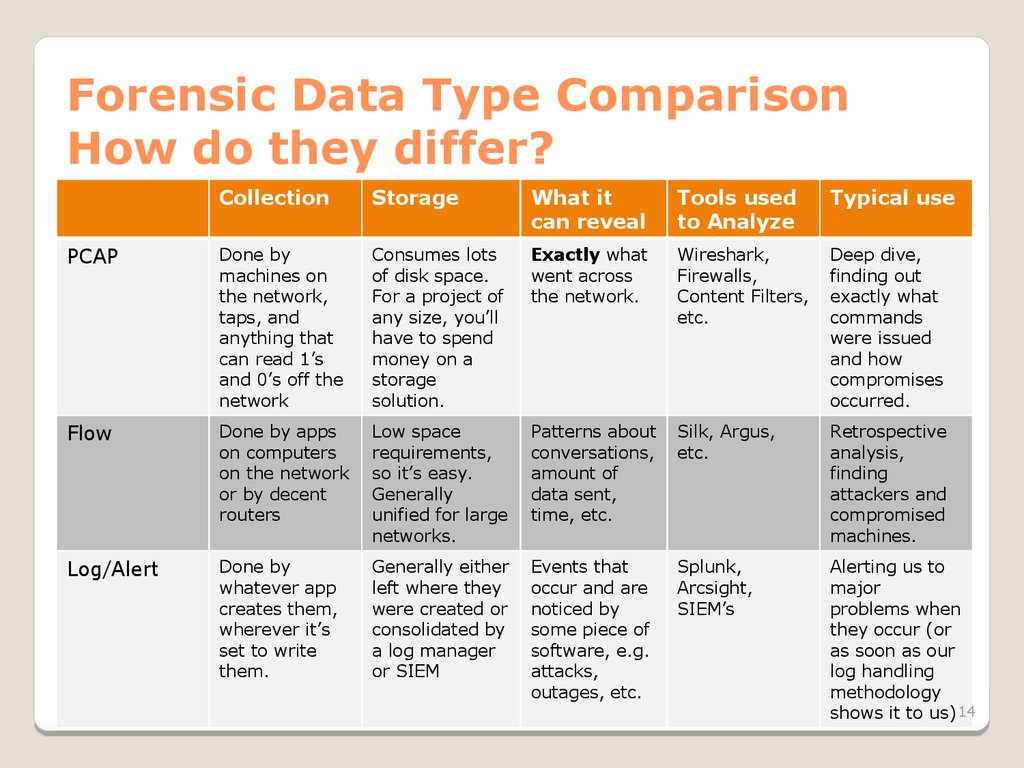
14. Forensic Data Type Comparison How do they differ?
CollectionStorage
What it
can reveal
Tools used
to Analyze
Typical use
PCAP
Done by
machines on
the network,
taps, and
anything that
can read 1’s
and 0’s off the
network
Consumes lots
of disk space.
For a project of
any size, you’ll
have to spend
money on a
storage
solution.
Exactly what
went across
the network.
Wireshark,
Firewalls,
Content Filters,
etc.
Deep dive,
finding out
exactly what
commands
were issued
and how
compromises
occurred.
Flow
Done by apps
on computers
on the network
or by decent
routers
Low space
requirements,
so it’s easy.
Generally
unified for large
networks.
Patterns about
conversations,
amount of
data sent,
time, etc.
Silk, Argus,
etc.
Retrospective
analysis,
finding
attackers and
compromised
machines.
Log/Alert
Done by
whatever app
creates them,
wherever it’s
set to write
them.
Generally either
left where they
were created or
consolidated by
a log manager
or SIEM
Events that
occur and are
noticed by
some piece of
software, e.g.
attacks,
outages, etc.
Splunk,
Arcsight,
SIEM’s
Alerting us to
major
problems when
they occur (or
as soon as our
log handling
methodology
shows it to us) 14
15. So what do we capture and when?
Whateverthey’ll let you capture
A lot of times the people/systems that you’re
working with will be totally opposed to you
actually using the network for anything
because the world might end or people might
explode. I’ll try to give you ways to work your
way around this.
15
16. So what do we capture and when?
Firstget your easy wins
Turn on flow data recording on your switches
and routers and pump it to some machine.
Figure out what log and alert sources are
already present and get them into a log
manager.
Now you’ve got some flow data and
some log/alert data! For free(-ish)!
16
17. So what do we capture and when?
Findout what you’re missing
Look at your network diagram and if there’s
any part where you’re not getting data from,
toss a sensor out there.
Look
at your data and find trouble spots
Find events/hosts of interest by analyzing the
flow and log data that you’re getting. (More on
how to do this later.)
17
18. So what do we capture and when?
Increasemonitoring in trouble spots
Grab PCAP data from links where you think
compromises are occurring.
Set up IDS/SIEM/etc. products to produce
alerts tailored to the problems you see.
Throw host based monitoring apps on suspect
machines.
18
19. So what do we capture and when? Breakdown
Log/alertdata: Whenever possible, and
particularly once you’ve tweaked your
alerts.
Flow data: Whenever possible. It’s easy to
capture and easy to work with.
PCAP data: When you need to look closer
than flow or log/alert data allows OR
when you have tons of resources to blow
on disk space.
19
20. How you’ll typically start an investigation
SIEM pops up an alert to your screen, fellow coworker, cellphone, etc saying “Something is horribly wrong on host X!”
You then go look at other logs on host X. Maybe you find
something scary. Maybe you can’t see the forest for the trees.
Then you open up your flow data for the time in question.
See any patterns? Identify suspicious conversations, capture
the packets (if you can) and investigate further. Mount some
sort of defense against whatever you find.
OR
20
21. How you’ll typically start an investigation
Somebody hands you a big pile of PCAP or flow data.Put it through an app to create flow data or IDS alert data (if
you don’t have it already)
Look for patterns using some analysis tool. Focus down to
specific data using those patterns or human reports of
problems and get as close to the problem as possible.
Figure out what kind of monitoring you need to get the data
you truly need to find the problem, catch the bad guy, or get
the conviction. Then go deploy it, assuming you can get client
buy-in. (or… create ticket, walk away)
21
22. How we’re going to learn this
We’ll be exploring the data typesstarting at the most finely grained (PCAP)
and working up, so that we’ll better
understand the limitations of each type,
even though in a real investigation, you’d
end up using the data in the reverse
order.
22
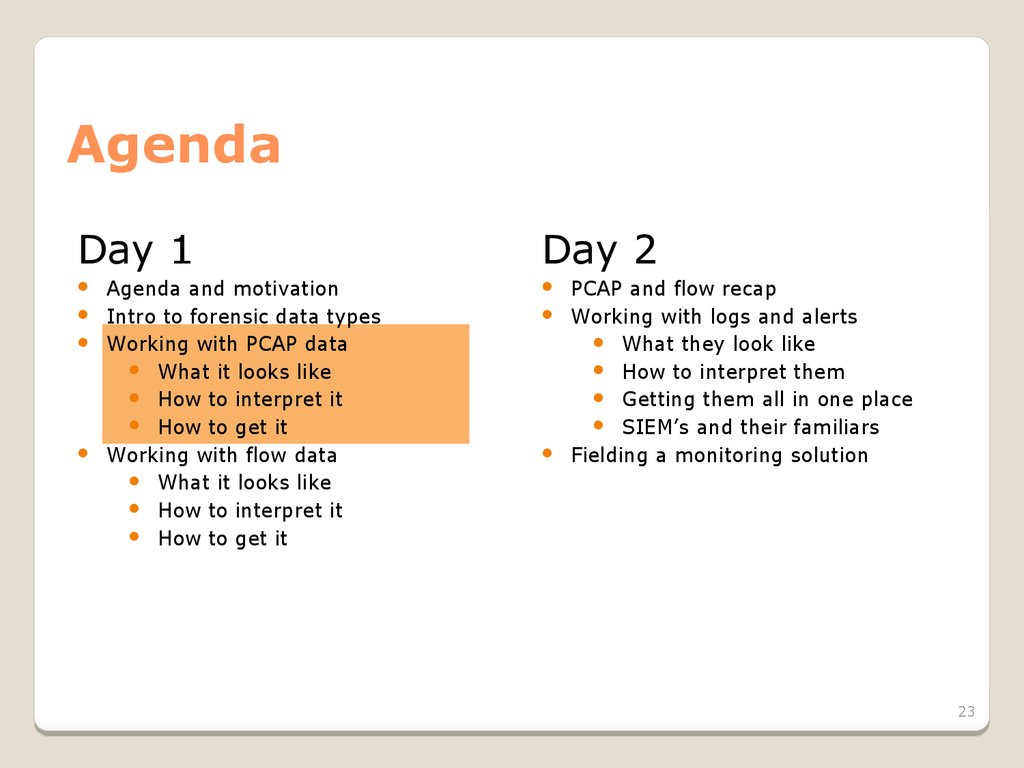
23. Agenda
Day 1Agenda and motivation
Intro to forensic data types
Working with PCAP data
What it looks like
How to interpret it
How to get it
Working with flow data
What it looks like
How to interpret it
How to get it
Day 2
PCAP and flow recap
Working with logs and alerts
What they look like
How to interpret them
Getting them all in one place
SIEM’s and their familiars
Fielding a monitoring solution
23
24. PCAP data Things to think about
PCAP is a straight copy of ALL* networktraffic that flows through the pipe for as
long as you keep recording. That can be
a LOT of data!
How long do you need to listen?
Can your NIC capture it fast enough?
Can your hard drive store it fast enough?
How long can you listen before you have
to free up space?
24
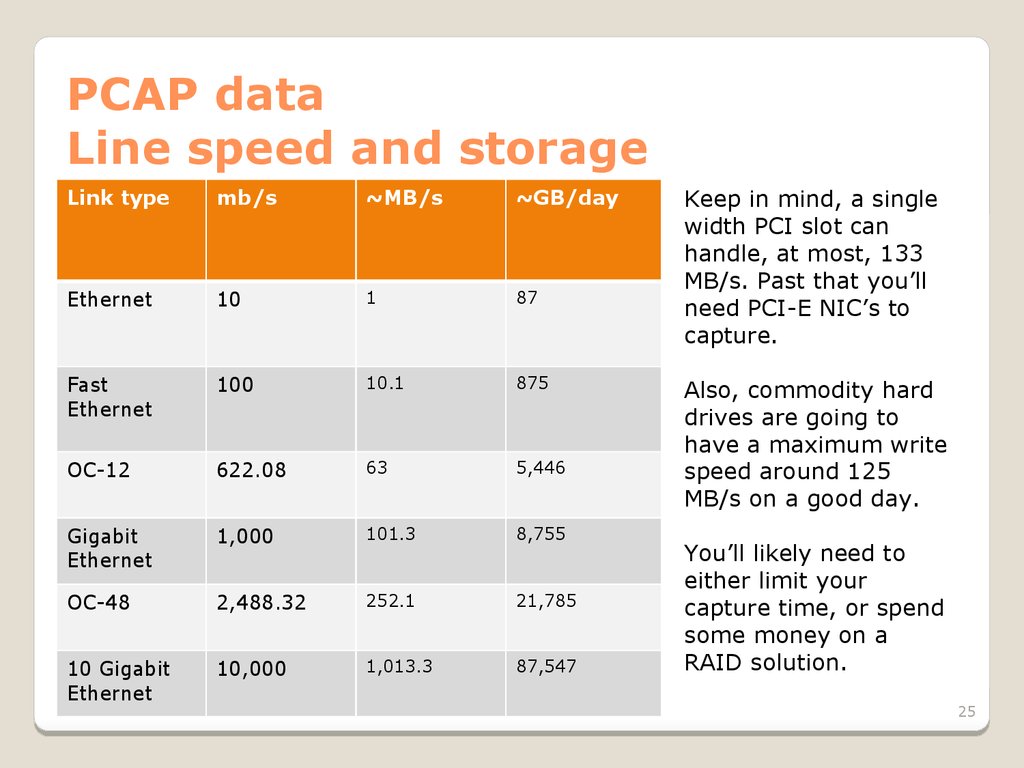
25. PCAP data Line speed and storage
Link typemb/s
~MB/s
~GB/day
Ethernet
10
1
87
Fast
Ethernet
100
10.1
875
OC-12
622.08
63
5,446
Gigabit
Ethernet
1,000
101.3
8,755
OC-48
2,488.32
252.1
21,785
10 Gigabit
Ethernet
10,000
1,013.3
87,547
Keep in mind, a single
width PCI slot can
handle, at most, 133
MB/s. Past that you’ll
need PCI-E NIC’s to
capture.
Also, commodity hard
drives are going to
have a maximum write
speed around 125
MB/s on a good day.
You’ll likely need to
either limit your
capture time, or spend
some money on a
RAID solution.
25
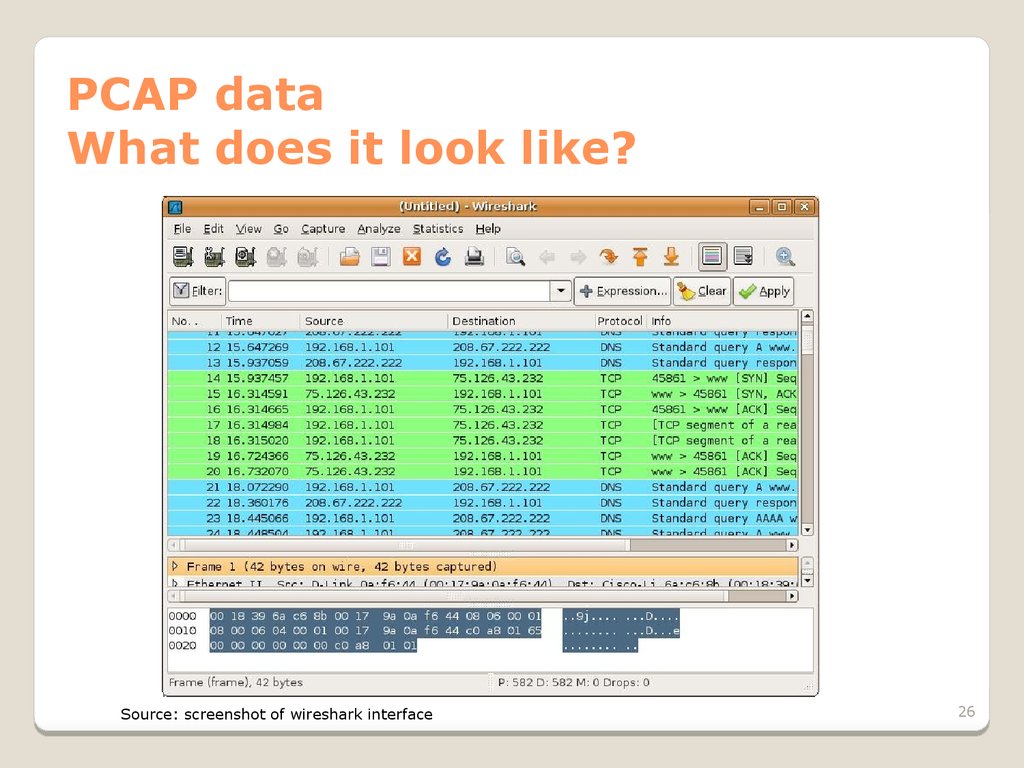
26. PCAP data What does it look like?
Source: screenshot of wireshark interface26
27. PCAP data How we get it
Networktaps
Devices that are connected between two other
network devices
Passively monitors traffic, and reproduces it on
one or more monitor ports
Available for all media types and speeds
27
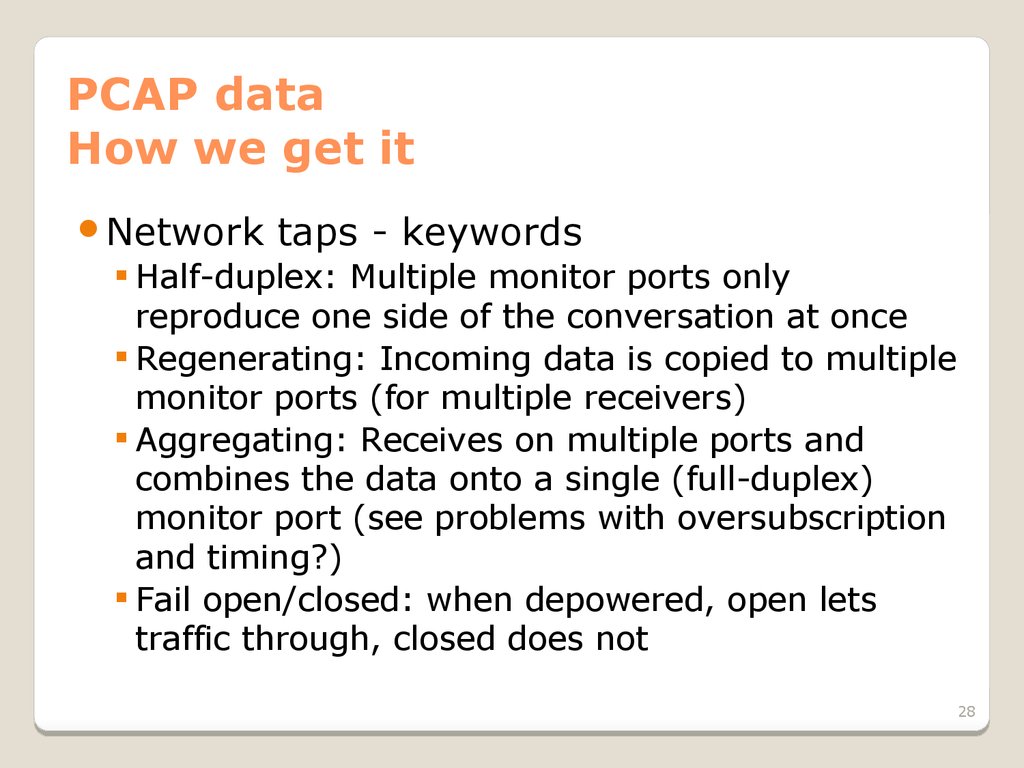
28. PCAP data How we get it
Networktaps - keywords
Half-duplex: Multiple monitor ports only
reproduce one side of the conversation at once
Regenerating: Incoming data is copied to multiple
monitor ports (for multiple receivers)
Aggregating: Receives on multiple ports and
combines the data onto a single (full-duplex)
monitor port (see problems with oversubscription
and timing?)
Fail open/closed: when depowered, open lets
traffic through, closed does not
28
29. PCAP data How we get it
Networktaps – dealing with fiber
Fiber taps actually split a portion of the light
used to carry the signal, causing the signal
downstream to be weaker. When dealing with
this, there’s a lot more math involved. You will
need to calculate a “Loss Budget”. This will
involve the transmitter power, receiver sensitivity,
cable loss, distance, tap characteristics, and
anything else that will affect photons. If we end
up having lots of extra time, we’ll cover this.
29
30. PCAP data How we get it
Networktaps
Source: netoptics.com, hackaday.com
30
31. PCAP data How we get it
Makinga field expedient cat5 tap
Instructions can be found at
http://thnetos.wordpress.co
m/2008/02/22/create-a-passi
ve-network-tap-for-your-hom
e-network
/
Or
http://hackaday.com/2008/09
/14/passive-networking-tap
/
Source: thnetos.wordpress.com
31
32. PCAP data How we get it
SPANports
Ports on most enterprise grade switches/routers
which mirror all* traffic on other ports.
Will drop packets if there’s not enough
bandwidth on the port.
You’ll still need a machine connected to it to do
the capture.
DON’T FORGET TO DO TX AND RX!
Make your own impromptu SPAN port with the
ARP flood trick
32
33. PCAP data How we get it
SPANports
Source: datacomsystems.com
33
34. PCAP data How we get it
Directcapture from the NIC on a machine
You’ll always do this at some point.
Very easy and convenient in low traffic
settings. Just start capturing to the hard drive
and stop when you feel like it.
Storage becomes an issue when
(traffic * time) > hard drive capacity OR
(traffic / time) > hard drive write speed
Can only see the traffic going to that host (so
use taps or SPAN ports to gain visibility)
34
35. PCAP data How we get it
Directcapture from the NIC on a machine
tcpdump
wireshark
Netwitness
etc.
35
36. Network coverage – an aside
Network coverage is how much of thetraffic on the network that your sensor
network can see. You can have different
types of monitoring on different parts of
the network, but the main idea is to avoid
blind spots. This applies to PCAP, flow,
logs, and everything else.
36
37. Network coverage – an aside
Since different segments of the networkcarry different traffic, where you decide to
place you sensors will determine what you
can see.
What would you see on the outside of
the border firewall that you wouldn’t see
inside? What kinds of things do you WANT
to see?
37
38. Network coverage – an aside
Things to think aboutNAT – solve with placement of sensors
VPN – solve with placement of sensors
or VLAN specific configuration
Multiple border gateways – solve using
channel bonding/aggregation
38
39. Network coverage – an aside
On the outside of your firewall, you seethe attacks that didn’t get through in
addition to the things that did. On the
inside of your firewall you see things that
actually got through. The outside tells
you who’s attacking and how. The inside
tells you what attacks worked.
39
40. Network coverage – an aside
In addition to the amount of the networkthat’s covered, we can also think about
WHEN the network is being covered.
Sometimes you’ll want PCAP data for a
couple of hours, but couldn’t handle 24/7.
When might that be? Could you perhaps
trigger full PCAP for a time based on some
event? Absolutely!
40
41. PCAP data Hands on
Now that we know where, why, and howto collect PCAP data, let’s go do some
captures.
41
42. PCAP data Doing analysis - Wireshark
Wireshark is your good old fashioned,run of the mill, go-to, protocol analyzing,
packet capturing, file carving buddy.
Learn to love it.
42
43. PCAP data Doing analysis - Wireshark
Whatwe’ll be doing today
Learning the layout of the interface
Capturing PCAP data
Looking at the structure of packets
Filtering packets to find interesting things
Following a TCP session
Carving files
Reading emails
43
44. PCAP data Doing analysis - Wireshark
Sourcesfor pcaps
http://wiki.wireshark.org/SampleCaptures
http://packetlife.net/captures/
http://www.pcapr.net
http://www.icir.org/enterprise-tracing/downloa
d.html
Your own machine
44
45. PCAP data Doing analysis - Wireshark
So that’s Wireshark. Pretty nice, huh?When it comes to finding out exactly how
your machine got pwned (aka owned,
pwnt, etc.), it’s pretty effective.
Also, the functionality of Wireshark can
be extended by coding up plugins and
decoders, and anything else you want.
It’s open source!
45
46. PCAP data Doing analysis - Wireshark
But what if we don’t have time to do allthat poking about and sifting through
packets? Is there a better way to look
through a big pile of PCAP data?
I thought you’d never ask…
46
47. PCAP data Doing analysis - Netwitness
Whatwe’ll be doing today
Learning the interface
Importing some PCAP data
Doing (almost) everything we just did in
Wireshark in less time than it took us before
Catching things that we might have missed
before
47
48. PCAP data Doing analysis - Netwitness
Netwitness is a tool for getting a quick picture ofwhat someone was doing on the network,
especially if you’re going after less advanced
threats, like insider threats or the average
criminal.
Currently there’s a freeware version and a paid
version. Give it a try next time you get stuck
during an investigation. Often you can catch
certain clues via the session based view that you
wouldn’t simply by digging through PCAPs.
48
49. PCAP data Doing analysis – Other tools
In addition to sitting down and doing deepdive analysis on PCAP data by hand, we can
also run it through automated processes
(sometimes even at line speed!) to do all
sorts of other stuff. This is how firewalls and
IDS work, after all.
Depending on the audience, this is where
we discuss our organization’s custom tools
49
50. PCAP data Generating flow and alert data
Usefulwhen someone hands you a big
wad of PCAP and you have no other data
Can be done when you’ve got data from
before you fielded your flow monitoring or
alert generating apps (IDS, firewall, etc.)
Makes analysis of large data sets easier
since it’s faster to look at coarse grained
data.
We’ll cover this when appropriate.
50
51. PCAP Data Conclusion
Whenyou have PCAP you can see pretty
much everything.
It’s
very heavy weight whenever you start
dealing with enterprise level networks.
It’s
the only way you’ll see what’s being said
on the network, but it’s not as good as flow or
log/alert data for figuring out what’s
important to look at.
51
52. Agenda
Day 1Agenda and motivation
Intro to forensic data types
Working with PCAP data
What it looks like
How to interpret it
How to get it
Working with flow data
What it looks like
How to interpret it
How to get it
Day 2
PCAP and flow recap
Working with logs and alerts
What they look like
How to interpret them
Getting them all in one place
SIEM’s and their familiars
Fielding a monitoring solution
52
53. Flow data Things to keep in mind
Thisis easy data to get, so make sure you do.
Better
used to figure out where to look, than to
figure out exactly what happened.
Even
when you’re not on an investigation, you
should collect flow data to do baselining.
Visualization
helps a lot.
53
54. Flow data What is flow data?
There’s some variation, but generally arecord contains the following:
Source and dest ip
Source and dest port
Protocol
Start time + (duration | end time)
# of packets
# of bytes
Directionality? Depends on format.
54
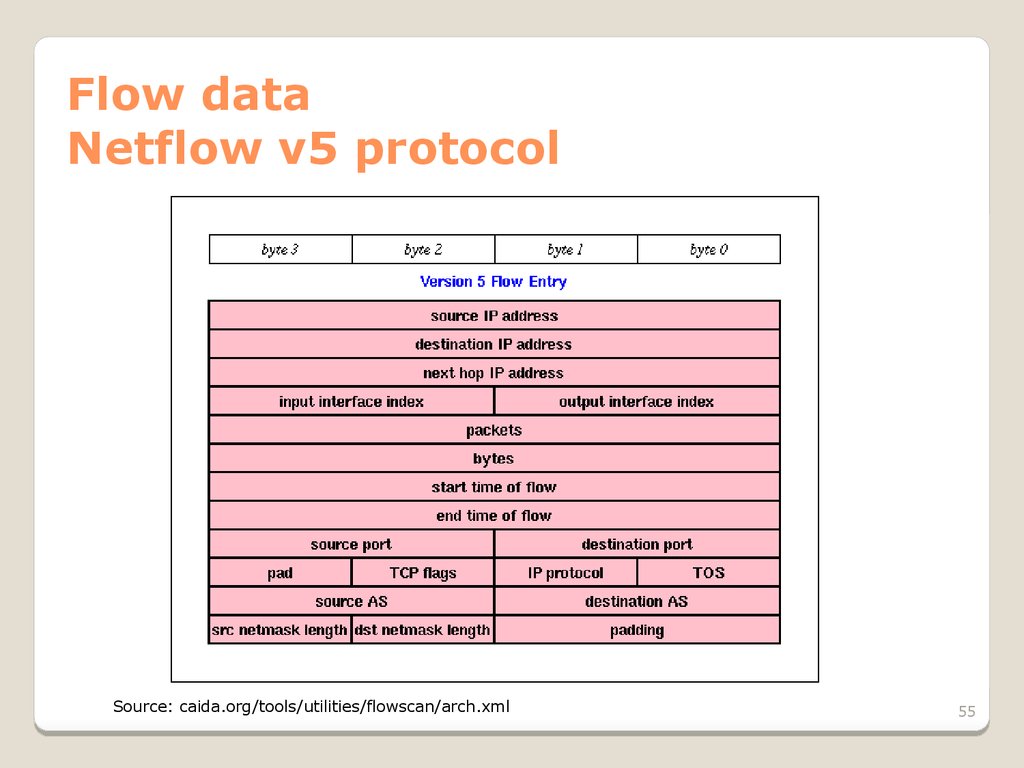
55. Flow data Netflow v5 protocol
Source: caida.org/tools/utilities/flowscan/arch.xml55
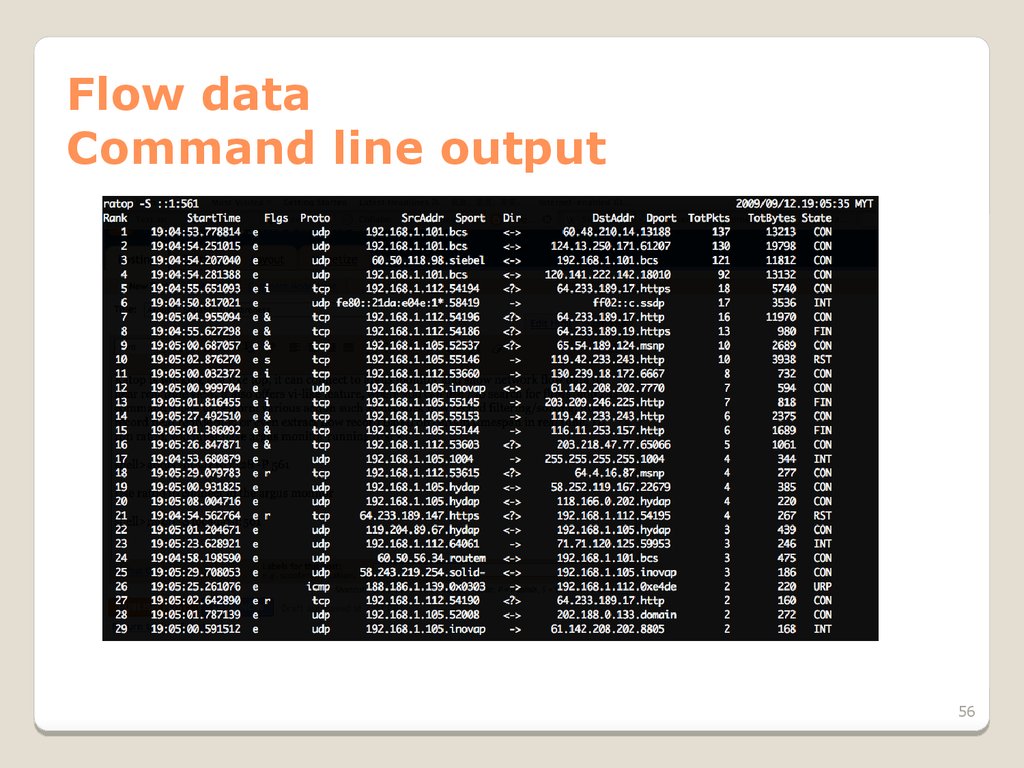
56. Flow data Command line output
5657. Flow data Directionality
Some types of flow records are unidirectional (SiLK,rw tools), and others are bidirectional (argus, ratools,
original flow data).
Unidirectional flow data has a separate record for
both sides of the conversation. This is how Cisco
NetFlow v5, v9, and IPFIX records are specified.
Bidirectional flow data combines both sides into one
record, usually having extra fields for “# of sender
packets”, “# of destination bytes”, and other things
that would get muddled by combining two
unidirectional flows.
57
58. Flow data Directionality
Depending on what you need, you canconvert between bidirectional and
unidirectional using whatever tool is
appropriate to your data set.
58
59. Flow data Cutoff and Aging
Until conversations end, their flow data sits in therouter/switch/etc. memory, taking up space (DOS?). So if
we’ve got lots of very long lived flows or flows that didn’t
end well (FIN ACK) we need to free up that memory and
write the flows.
For long flows, we have a configurable time (say 30
minutes) after which we write a record and start a new one.
Figuring out how long the flow actually was will require
massaging your data.
For broken flows, another cutoff time (maybe 15
seconds?) will clear them out.
59
60. Flow data Sampling
When there’s too much traffic for your switch, NIC, orwhatever to handle, sampling is used to throttle the
workload.
Instead of every packet being recorded in a flow
(sample rate = 1 out of 1), we take 1 out of N packets,
make flow records, and then scale the appropriate
values by N.
We will miss flows due to this but for very large
throughputs it’s necessary. Also, N is not always
constant over time.
60
61. Flow data Formats
And then there are different formats…Cisco NetFlow v5 and v9 are very common. V5 will only
do IPv4, though.
IPFIX is a lot like v9 plus some interesting fields. Open
protocol put out by IETF.
sFlow hardware accelerated, forced sampling, mainly an
HP thing.
And there are others, but we’ll focus on v5/v9 and IPFIX.
61
62. Flow data Formats
There isn’t a current standard for how tostore flow data on disk, so different
software suites will store it differently to
suit their search and compression
capabilities. Choose your software suite
based on what formats it can consume,
and be prepared to perform a conversion
if you switch.
62
63. Flow data Capturing
Switchesand routers
Flow data is gathered by the network
hardware, and then sent over the network to
one or more listeners.
To set up collection and forwarding, look up
instructions particular to your device and the
revision of its OS (typically Cisco IOS).
Remember, this is going over the network, so it
can be intercepted, falsified, or blocked by
attackers, outages, and misconfigurations!
63
64. Flow data Capturing
Machineson the network
Creates flow data based on what network
traffic that machine can see.
Can either generate flow data and forward it to
another collector, store it locally, or both.
Also possible to collect flow data from other
machines or network hardware.
Eventually your flow data will have to end up
somewhere. You want that somewhere to be
handy to your analysts.
64
65. Flow data Analyzing with argus
Argus is another popular tool which is mucheasier to deploy, so we’ll be using it to do
some sleuthing.
Become familiar with a few of the tools
Locate a scanning machine
Detect beaconing
Find activities by a compromised machine
Find routing misconfigurations
65
66. Flow data Capturing with SiLK
YAF– yet another flowmeter
Produces IPFIX data from files or network
traffic
Can write to disk or push out over network
Lightweight, easy to install
Works well with SiLK tools
66
67. Flow data Capturing – consolidating in SiLK
rwflowpackPart of the SiLK toolset
Designed to receive input from multiple sensors
and build a consolidated repository for analysis
Just one of the pieces of a full sensor network.
67
68. Flow data Analyzing with SiLK
SiLKtools
Produced by CERT NetSA
Relatively easy to use
We’ve already been using them and have done
a decent amount of writing on how to use them
(check my transfer folder)
68
69. Flow data SiLK tools - conclusion
Free, very powerful, extensible, pretty easy touse.
Command line tools are great for things that
we have running as daemons, but for
visualizing flow data we can find a better
interface. With the right tools, we can add
better visualization.
69
70. Flow data Visualizing
Opensource
Afterglow + graphviz: cheap, but too much
work to set up
Free/commercial
Scrutinizer: quick and easy, consumes pretty
much any flow data, free version is limited to
24 hours of data
Lynxeon: belongs in the SIEM category,
visualization tool is worth a mention though, 60
day trial
70
71. Flow data Visualization
http://www.networkuptime.com/tools/netflow/http://freshmeat.net/search/?q=netflow§ion=projects
TONS
more
Source: plixer.com, vizworld.com, networkuptime.com
71
72. Flow data Continuing research
Flowcon,Centaur Jam, etc.
Come join us!
Share your tools!
Statistical
anomaly/group detection
Complicated math
New-ish technology, but worth a look if you’ve
got a pile of netflow data that you’re sitting on.
72
73. Agenda
Day 1Agenda and motivation
Intro to forensic data types
Working with PCAP data
What it looks like
How to interpret it
How to get it
Working with flow data
What it looks like
How to interpret it
How to get it
Day 2
PCAP and flow recap
Working with logs and alerts
What they look like
How to interpret them
Getting them all in one place
SIEM’s and their familiars
Fielding a monitoring solution
73
74. PCAP reCAP
Mostgranular data we can collect
Takes a lot of resources to gather
Great for finding out how machines got
pwned
Bad for figuring out what’s going on
quickly
Can be converted into flow and alert data
with the right tools
74
75. FLOW reFLOW
Infoabout conversations on the network
Cheap and easy to collect
Quick to analyze with the right tools
Different analysis suites, formats
75
76. Learning styles to use
Moretool use?
More theory?
More collaboration!
You’ve got threats. I’ve got solutions.
76
77. Questions about anything up to now?
7778. Agenda
Day 1Agenda and motivation
Intro to forensic data types
Working with PCAP data
What it looks like
How to interpret it
How to get it
Working with flow data
What it looks like
How to interpret it
How to get it
Day 2
PCAP and flow recap
Working with logs and alerts
What they look like
How to interpret them
Getting them all in one place
SIEM’s and their familiars
Fielding a monitoring solution
78
79. Log/Alert data What are we dealing with?
Logs are any continual text output stored byapplications or devices in the process of their
functioning.
Alerts are specialized logs produced by
something when certain conditions occur that
we had the foresight to set an alarm for. If a
log is created saying that something we’ve
set up a trigger for has happened, then we’ll
get an alert.
79
80. Log data Typical sources
Webserver
Web proxy
DNS
Operating system (/var/log/*)
SMTP
Whatever you’re using to manage logons
Building access controls
HVAC/ICS/SCADA/Power
80
81. Alert data Typical sources
IDSFirewall
Host
based IDS
SIEM (Security Information & Event Manager)
Your server uptime and HA (high availability) stuff
What else?
Typically alerts are being produced because triggers
that we’ve written are being tripped. If you’re not
getting useful alerts, then you’ve configured
something wrong!
81
82. Alert data Redundant IDS, etc?
Extraconfiguration
Add personnel
When one dies- “Multiple TippingPoint IPS
Malformed Packet Detection Bypass
Vulnerability”
Increased attack surface
More filtration, more rules, etc.
82
83. Alert data Let’s go set up some triggers
Here’s how you go about getting good alertsFind an incident that you want to be alerted about
Research
what went over the network or got written to a
log when that incident was occurring
Write
a rule in your IDS or whatever to create an alert
when that traffic is seen
Test
your rule
Continue
testing…
83
84. Alert data What will we use as a trigger?
Snort!Open source, support packages available
Basis for Sourcefire appliances
Very popular, good support among SIMs
Very robust community providing rules,
extensions, add ons, and anything else you
can think of
Rule set subscriptions can be had from
Sourcefire, and rules become free 30 days
after they’re made available to subscribers
84
85. Alert data How Snort works
1.2.
3.
4.
5.
Reads traffic from network
Decodes packets
Performs stream reassembly
Applies filters
Upon the first filter match, an alert is
generated
85
86. Alert data Writing Snort rules
Fire up your VM’s. Time to go to work.We’re going to look at how snort rules are
written, what alerts look like, and how to
write our own rules.
86
87. Alert data Writing better rules
Writeto the vulnerability, not the exploit
Understand
Inspection
Test
the base rate fallacy
chain
and tune your alerts
Dumbpig,
external checking tools, profiling
87
88. Log/Alert data Priority of sources
Obviously not all data is equal, so here’s thebasic order of which ones you should
concentrate on first.
Alerts
from security products (e.g. IDS, SIEM)
Netflow data, so you can track what those
alerts are related to
OS event logs, so you can see what happened
when those alerts were caused
What else?
88
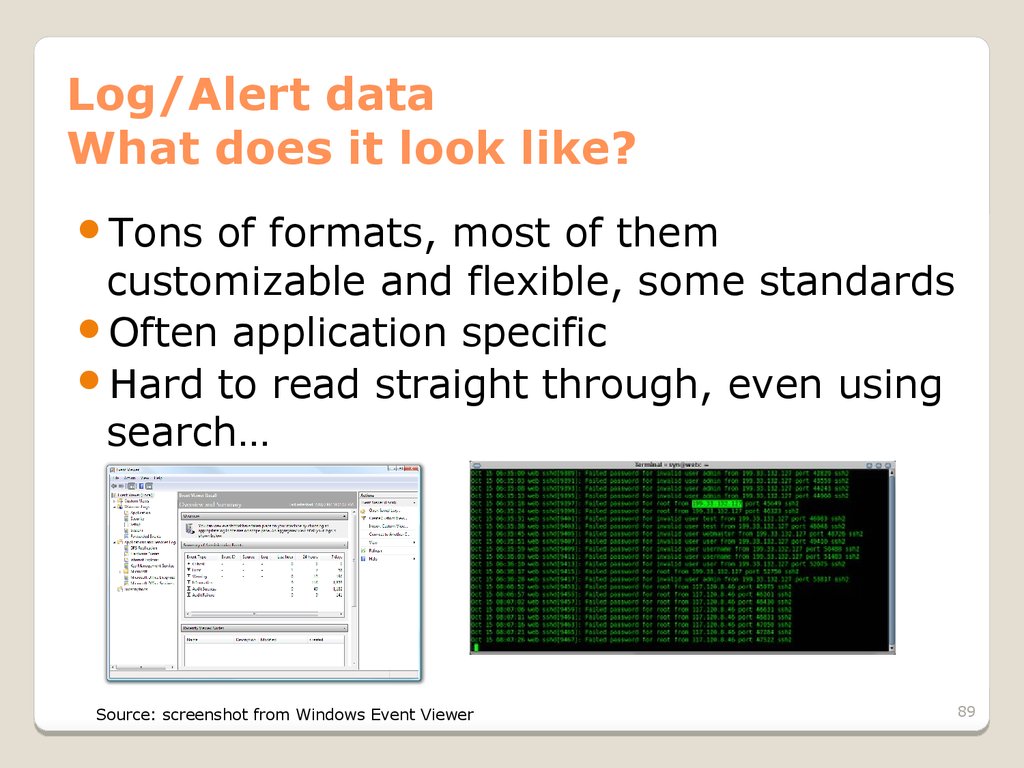
89. Log/Alert data What does it look like?
Tonsof formats, most of them
customizable and flexible, some standards
Often application specific
Hard to read straight through, even using
search…
Source: screenshot from Windows Event Viewer
89
90. Alert data Event formats
CEE– Common Event Expression
CVE – Vulnerability
CCE – Configuration
CWE – Weakness
CPE – Platform
CAPEC – Attack Patterns
…
90
91. Log/Alert data Dealing with disparate data
There’s too much text and not enoughcontext. We need a way to get to the
important logs and alerts quickly.
That’s why we use log managers and
SIEM’s. They import the logs into one
place, give us some pretty graphs, and
(hopefully) make sure that the important
entries catch our attention quickly.
91
92. Log/Alert data SIM, SEM, SIEM…
SIM= Security Information Management
SEM
= Security Event Management
SIEM
= Security Information and Event
Management
SIM is for bookkeeping, SEM is for correlating
data into events, and SIEM is a combo of the
two.
92
93. Log/Alert data SIEMs
Performevent correlation, reduce false positives
Help
filter logs and alerts to bring us the important
data quickly under one monitor
Typically
types
have a method for reading lots of log
This
is what you have running on a dedicated
monitor in your lab for a technician to keep an eye
on and call you when it turns red
93
94. Log/Alert data Some common managers/SIEMs
Splunk:free version will read 500MB/day of logs, has a
decent interface to set up log parsing, technically just a
log manager
ArcSight:
popular SIEM suite, has its own log manager,
could have a class just on Arcsight alone (and there
are). BIG player in government and commercial sector,
owing greatly to pushbutton compliance auditing.
RSA
enVision: another big player, focused on
appliances
Disclaimer: the information expressed here is meant only to be informative and does not imply a
recommendation
94
95. Log/Alert data Using Splunk
Splunk is common enough that it’s worthyour time to get to know. So for that
reason, we’ll now take a quick look through
its capabilities and the resources available
for learning Splunk 4.0.
95
96. Log/Alert data Some common managers/SIEMs
http://www.gartner.com/technology/media-products/reprints/nitrosecurity/article1/article1.htmlSource: Gartner (May 2010)
96
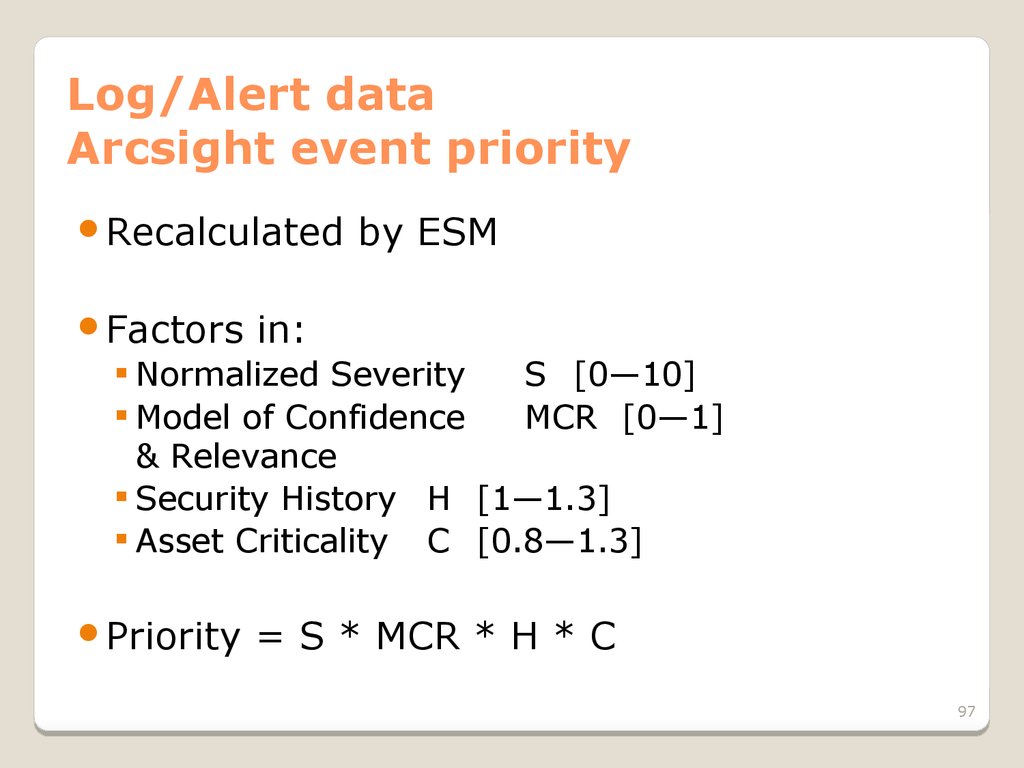
97. Log/Alert data Arcsight event priority
RecalculatedFactors
by ESM
in:
Normalized Severity
S [0—10]
Model of Confidence
MCR [0—1]
& Relevance
Security History H [1—1.3]
Asset Criticality C [0.8—1.3]
Priority
= S * MCR * H * C
97
98. Log/Alert data Arcsight event priority
PriorityMCR
= S * MCR * H * C
is the only factor that can drop P to 0
Fully modeled asset, zero ports, zero vulnerabilities
MCR = 0 Priority = 0
False
positives fed into SIEM force H > 1
Avalanche multiplication of false positives
Worst
case: False positives + no asset modeling
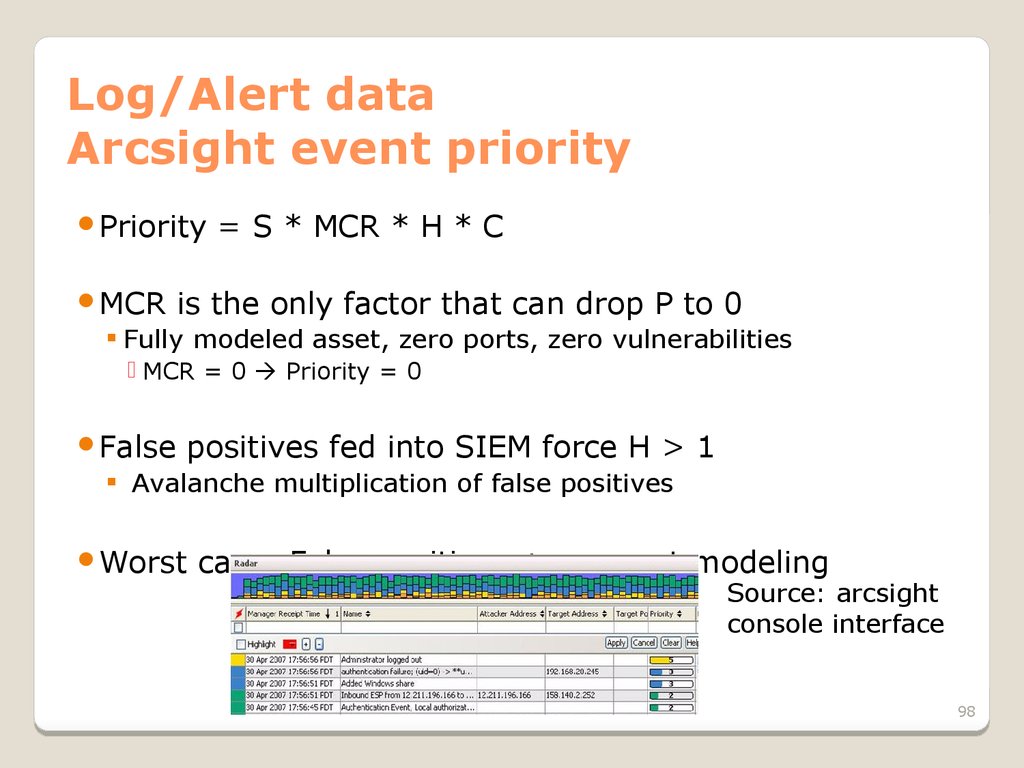
Source: arcsight
console interface
98
99. Log/Alert data Using SIEMs effectively
Understandthe complexity of the tools you are using
and allocate personnel appropriately.
Standardize
what information your organization
collects. Prioritize which information you set up
collection for.
Regularly
look at your flow data. Don’t depend on the
SIEM to see everything.
Write
new alert rules to handle your own particular
threats.
99
100. Deploying a monitoring solution
What you need to monitor a network willvary greatly depending on the size of the
network, its purpose, the threats it will
face, the technology used to build it, and
countless other things.
Now go to
www.ratemynetworkdiagram.com and
let’s play pin the sensor on the network.
100
101. Extended topics (if we have time)
Privacy/confidentialitylaws
Attacking network monitoring devices
Evading network monitoring
Wireless monitoring
What products have you used and which
ones did you like?
What else?
101
102. The End!
Pleasegive feedback!
Tell your friends!
102

































 internet
 law
law


