


")


")


 informatics
Similar presentations:
")

")
")
")
")
")

")
")
Introduction to UML
1. Introduction to UML
Credits: Slides burrowed heavily from http://sunset.usc.edu/classes/cs590_s2002/CPT-Readings.html1
2. About this lecture…
• Will attempt to introduce you to UML andRational Rose
• Not possible to teach everything
• Requires that you study on you own after
• Goal is to get you familiar
• Make use of on-line tutorials, books, etc.
2
3. Introduction to UML
What is UML?
Motivations for UML
Types of UML diagrams
UML syntax
Descriptions of the various diagram types
– Rational Rose and UML
• UML pitfalls
3
4. What is UML?
• A standardized, graphical “modeling language” forcommunicating software design.
• Allows implementation-independent specification of:
–
–
–
–
–
–
user/system interactions (required behaviors)
partitioning of responsibility (OO)
integration with larger or existing systems
data flow and dependency
operation orderings (algorithms)
concurrent operations
• Pretty pictures.
• UML is not “process”. (That is, it doesn’t tell you how to
do things, only what you should do.)
4
5. Motivations for UML
• UML is a fusion of ideas from severalprecursor modeling languages.
• We need a modeling language to:
– help develop efficient, effective and correct
designs, particularly Object Oriented designs.
– communicate clearly with project stakeholders
(concerned parties: developers, customer, etc).
– give us the “big picture” view of the project.
5
6. Types of UML diagrams
• There are different types of UML diagram, eachwith slightly different syntax rules:
–
–
–
–
–
–
–
use cases.
class diagrams.
sequence diagrams.
package diagrams.
state diagrams
activity diagrams
deployment diagrams.
6
7. UML syntax, 1
• Actors: a UML actor indicates an interface (pointof interaction) with the system.
– We use actors to group and name sets of system
interactions.
– Actors may be people, or other systems.
– An actor is NOT part of the system you are modeling.
An actor is something external that your system has to
deal with.
• Boxes: boxes are used variously throughout UML
to indicate discrete elements, groupings and
7
containment.
8. UML syntax, 2
• Arrows: arrows indicate all manner ofthings, depending on which particular type
of UML diagram they’re in. Usually,
arrows indicate flow, dependency,
association or generalization.
• Cardinality: applied to arrows, cardinalities
show relative numerical relationships
between elements in a model: 1 to 1, 1 to
many, etc.
8
9. UML syntax, 3
• Constraints: allow notation of arbitrary constraints onmodel elements. Used, for example, to constrain the value
of a class attribute (a piece of data).
• Stereotypes: allow us to extend the semantics of UML
with English. A stereotype is usually a word or short
phrase that describes what a diagram element does. That
is, we mark an element with a word that will remind us of
a common (stereotypical) role for that sort of thing.
Stereotypes should always be applied consistently (with
the same intended meaning in all instances).
9
10. UML diagrams: use cases
• A use case encodes a typical user interaction with thesystem. In particular, it:
– captures some user-visible function.
– achieves some concrete goal for the user.
• A complete set of use cases largely defines the
requirements for your system: everything the user can see,
and would like to do.
• The granularity of your use cases determines the number
of them (for you system). A clear design depends on
showing the right level of detail.
• A use case maps actors to functions. The actors need not
10
be people.
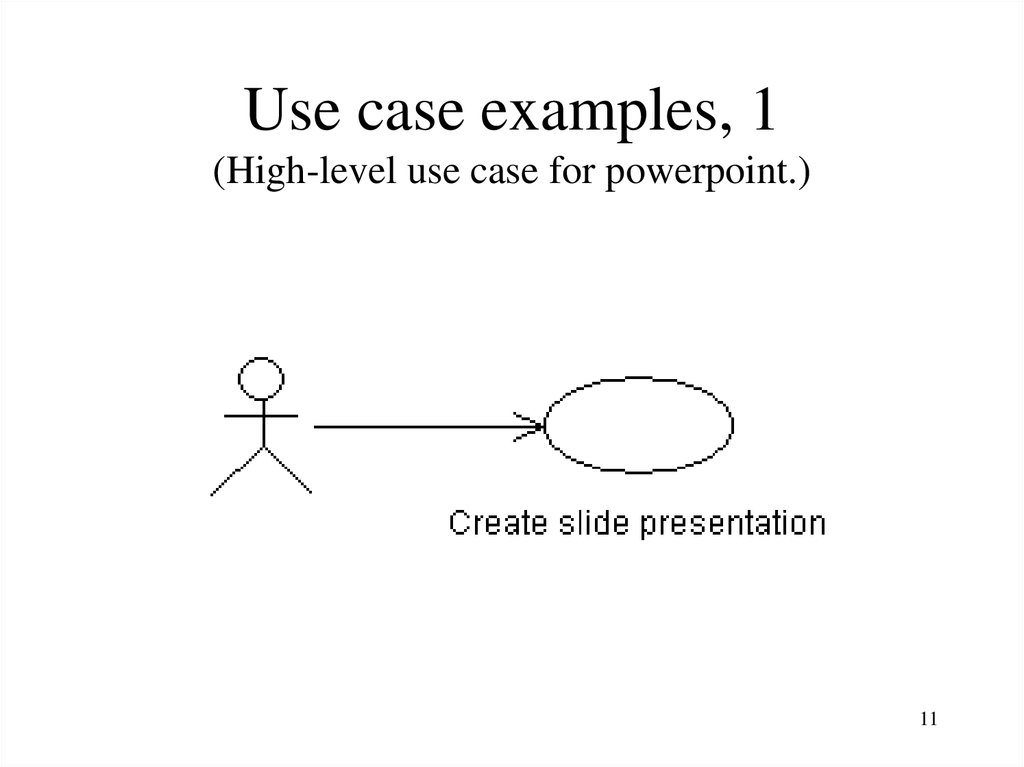
11.
Use case examples, 1(High-level use case for powerpoint.)
11
12. About the last example...
• Although this is a valid use case forpowerpoint, and it completely captures user
interaction with powerpoint, it’s too vague
to be useful.
12
13.
Use case examples, 2(Finer-grained use cases for powerpoint.)
13
14. About the last example...
• The last example gives a more useful view ofpowerpoint (or any similar application).
• The cases are vague, but they focus your attention
the key features, and would help in developing a
more detailed requirements specification.
• It still doesn’t give enough information to
characterize powerpoint, which could be specified
with tens or hundreds of use cases (though doing
so might not be very useful either).
14
15. Use case examples, 3 (Relationships in a news web site.)
1516. About the last example...
• The last is more complicated and realistic use casediagram. It captures several key use cases for the system.
• Note the multiple actors. In particular, ‘AP wire’ is an
actor, with an important interaction with the system, but is
not a person (or even a computer system, necessarily).
• The notes between << >> marks are stereotypes:
identifiers added to make the diagram more informative.
Here they differentiate between different roles (ie, different
meanings of an arrow in this diagram).
16
17. More UML later,
now on to…17
18. Using Rational Software
1819. IBM Rational resources
• Getting the program:– http://www-01.ibm.com/software/rational/
– http://en.wikipedia.org/wiki/Rational_Software
• Installed in A32
19
20. What is Rational Rose?
• An expensive CASE (Computer-Aided SoftwareEngineering) tool for object-oriented modeling.
• Based on UML (more or less).
• Provides semantics (a ‘compiler’) for UML.
• Has a reasonably intuitive GUI similar to standard
drawing programs, like Illustrator. Is available for
Windows and other platforms.
• Makes creating and maintaining your UML
diagrams easier (or at least more consistent).
• Has many bizarre features, including generation of
C++ (and other) code from your diagrams.
20
21.
What is a Rose Model?• A Rose “model” is a representation of the
problem domain and system software
– Each model contains views, diagrams, and
specifications to visualize and manipulate the
elements in the model
– There are many views of each underlying element
– Every “object” in the design is represented once in
the Rose “model”
– Rose maintains a consistent semantic representation
in the “model”
21
22.
About the next 2 slides…• The next slides introduce the Rose UI.
• Main points are the:
– “Browser”, a drop-down list of things in your
model.
– “Documentation window”, where you can add
notes to a thing in your model.
– “Diagram windows”, where you draw your
pictures.
22
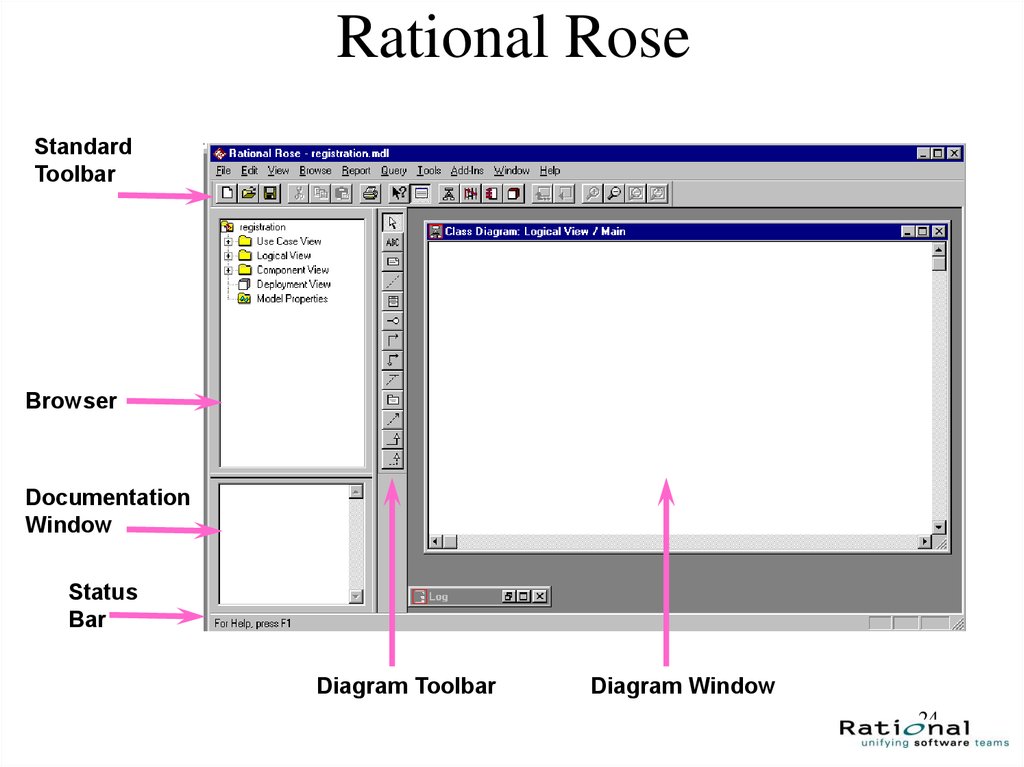
23.
The Rose User Interface• Rose consists of:
–
–
–
–
–
–
–
Standard toolbar
Diagram toolbar
Browser
Documentation window
Diagram windows
Specifications
Status bar
23
24.
Rational RoseStandard
Toolbar
Browser
Documentation
Window
Status
Bar
Diagram Toolbar
Diagram Window
24
25.
About the next slide…• Most things in your model (classes, use
cases, actors, etc) have all manner of
attributes and parameters. You edit these
via the “Specification” dialogue associated
with each.
• To get the specifications, right-click a thing
in the browser or a diagram and choose
“Specification”.
25
26.
Specifications• Most modeling elements have a Specification
that contains additional information about the
modeling element
26
27.
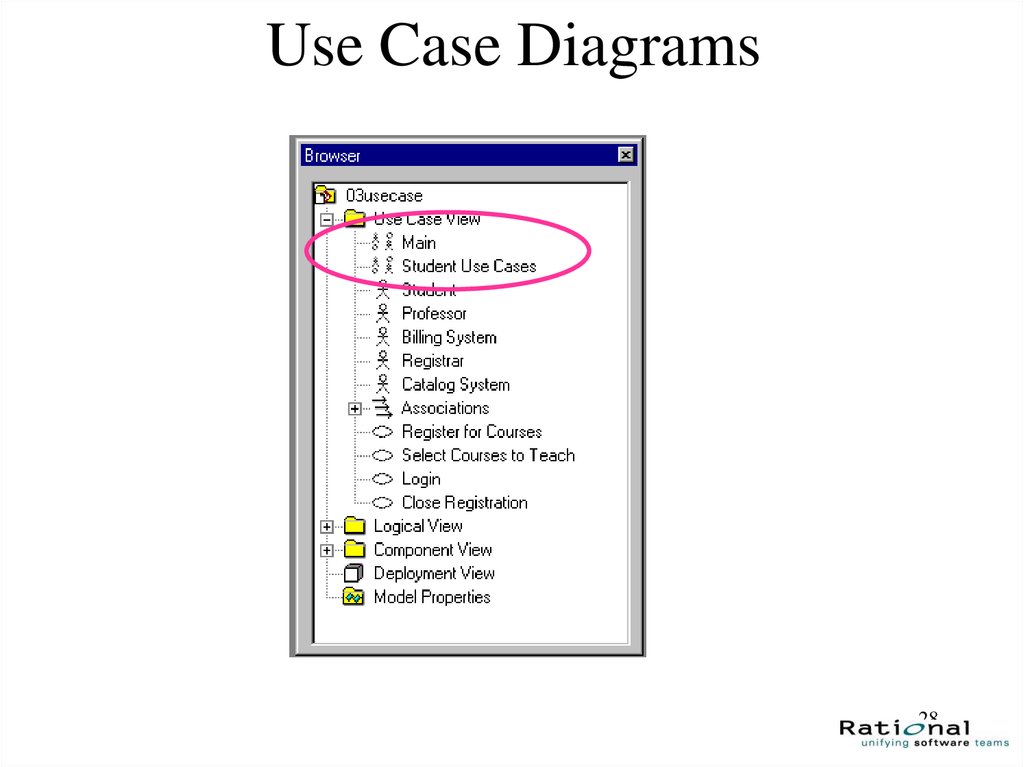
About the next slide…• The next several slides refer to use cases, a
particular type of diagram
• The next slide shows the “Use Case View” section
of the browser. Any actors, use cases and use case
diagrams each get an entry. “Associations”, ie
arrows, are grouped together.
• Use the browser to add elements to your model,
then draw a picture to show how they go together.
27
28.
Use Case Diagrams28
29.
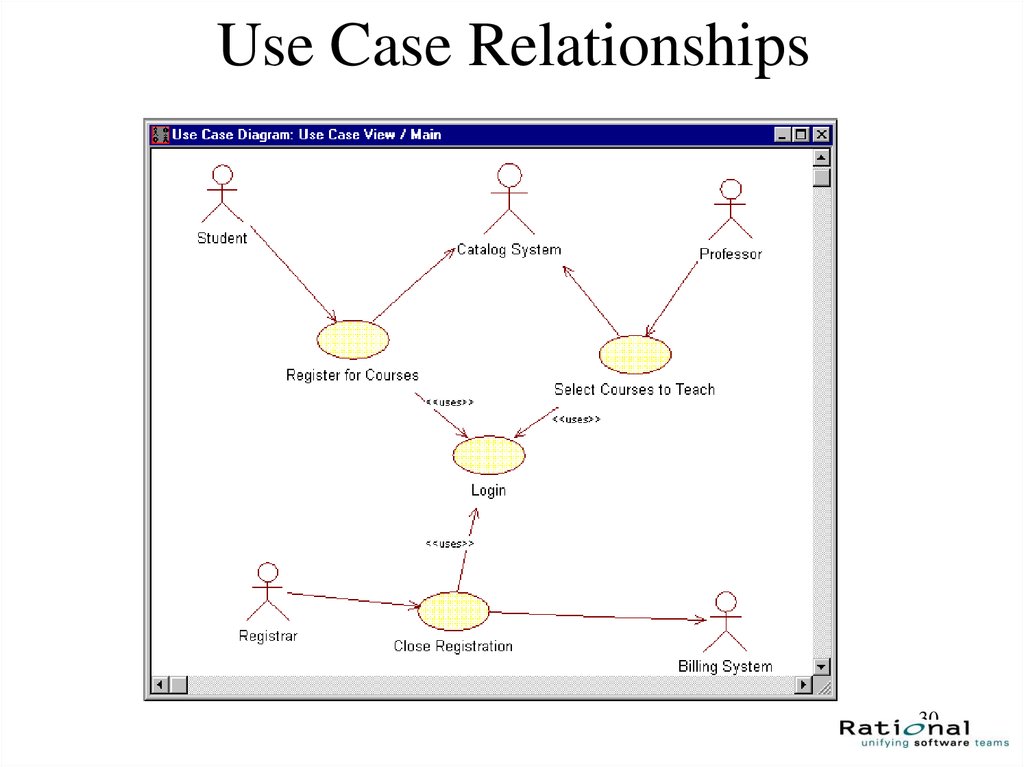
About the next slide…• The next slide shows a full use case diagram.
• The stick figures denote actors, and the ovals are use cases (a function
or behavior or interface your software provides).
• The arrows indicate ‘use’ or dependency. For example, the “Student”
uses the function “Register for Courses”, which in turn uses the
external “Catalog System”.
• The <<uses>> tokens attached to some of the associations (arrows) are
stereotypes, an indication of what the association means. In this
diagram, <<uses>> indicates that the association means a direct
software link, ie, that the function “Register for Courses” will directly
use the function “Login”. This is different than the unmarked arrows,
which indicate “use” in the vague sense of manipulating or interacting.
29
30.
Use Case Relationships30
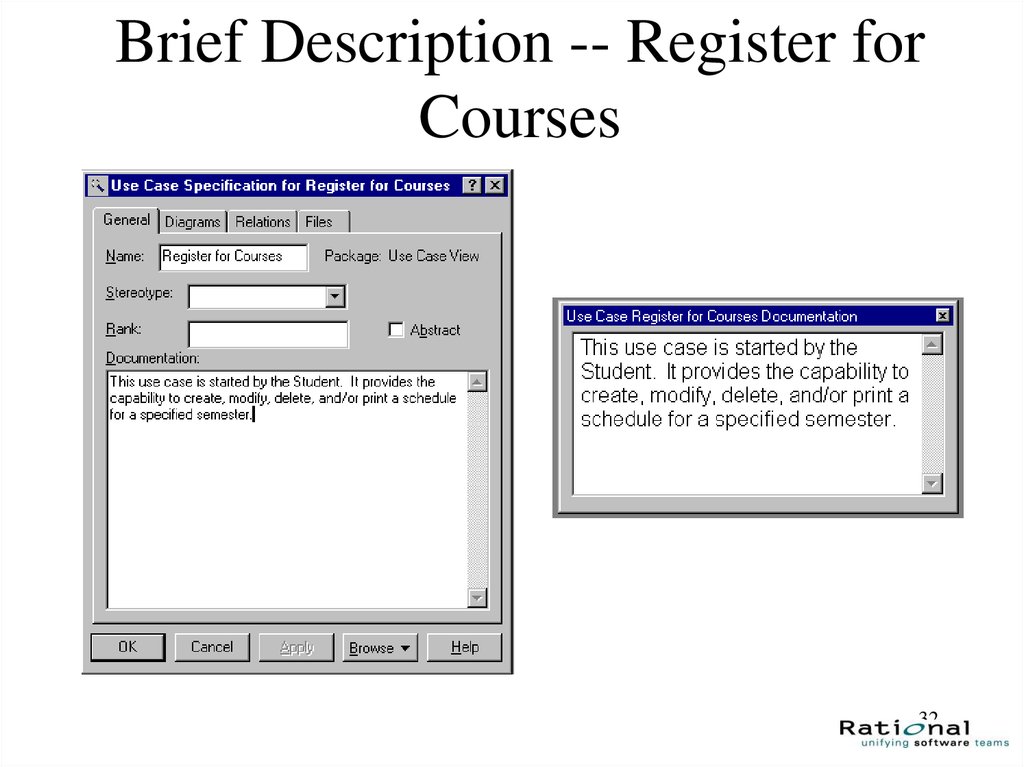
31.
About the next slide…• The next slide shows how documentation
(notes, etc) can be added to a particular
element.
• Here, they’re adding the documentation via
the Specification dialogue.
31
32.
Brief Description -- Register forCourses
32
33. UML in your documents
• UML is intended to ease the task ofcommunicating software designs.
• Typical uses of UML in G64HLL:
– conceptual component diagrams in the concept
document.
– use cases and class diagrams in the
requirements document.
– class, sequence, state, package and deployment
diagrams in the architecture document.
33
34. UML pitfalls, 1
• UML is a language, with a (reasonably) rigoroussyntax and accepted semantics; that is, the
diagrams have a meaning. Thus you have to be
careful that the meaning of your diagram is what
you intended.
• However, the semantics of UML are less welldefined than a programming language (where the
semantics are defined by the compiler). Thus
there is some leeway to use UML your own way:
but you must be consistent in what you mean by
the things you draw.
34
35. UML pitfalls, 2
• Arrow happiness: people tend to draw arrows(associations) everywhere in their diagrams, inconsistently
without much regard for the UML meaning of a given
arrow.
• Diagram fever: it’s easy to do too many diagrams. The
trick is to get the correct granularity. Eg, the requirements
document should leave implementation detail to the
architecture.
• General loopiness: be careful about slapping together
UML diagrams, or doing a diagram without thoroughly
understanding your system. You should always be able to
give a clear and concise explanation of your diagram, and
why you did it that way.
35
36. Exporting Rational diagrams?
• You can use screen captures• Find out other ways to do this …
36
37. Learning Rational …
• Lots of practice• Read online tutorial
37
38. Citation
These slides borrow heavily:Martin Fowler, UML Distilled
Addison-Wesley, 1997
You can also get the material from:
Sinan Si Alhir, UML In A Nutshell
O’Reilly, 1998
38
39. Back to UML
Class Diagrams39
40. UML diagrams: class diagram
• Motivated by Object-Oriented design andprogramming (OOD, OOP).
• A class diagram partitions the system into areas of
responsibility (classes), and shows “associations”
(dependencies) between them.
• Attributes (data), operations (methods),
constraints, part-of (navigability) and type-of
(inheritance) relationships, access, and cardinality
(1 to many) may all be noted.
40
41. Class diagram “perspective”
• Class diagrams can make sense at three distinctlevels, or perspectives:
– Conceptual: the diagram represents the concepts in the
project domain. That is, it is a partitioning of the
relevant roles and responsibilities in the domain.
– Specification: shows interfaces between components in
the software. Interfaces are independent of
implementation.
– Implementation: shows classes that correspond directly
to computer code (often Java or C++ classes). Serves
as a blueprint for an actual realization of the software in41
code.
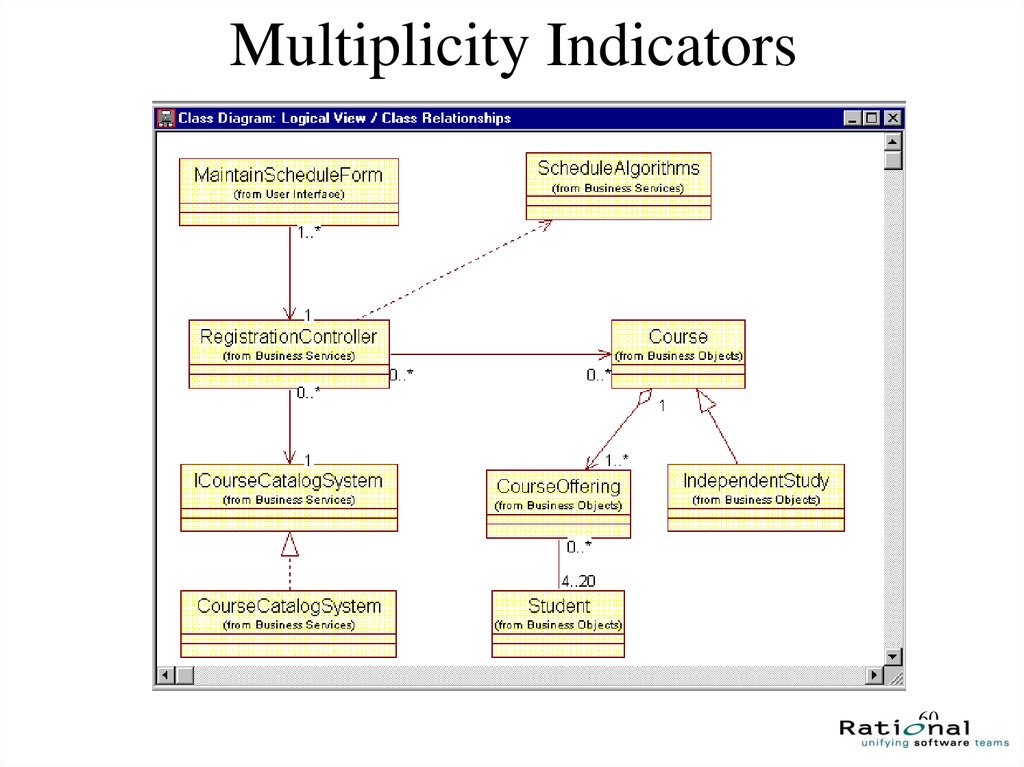
42. Class diagram examples (A classroom scheduling system: specification perspective.)
4243. About the last example...
• Each box is a class, with necessaryattributes and operations specified.
• Navigability arrows show which classes can
reference which others.
• Cardinality marked in bi-directional manner
on arrows.
• The classes together represent the complete
system; thus the the classes are a
43
partitioning of the system.
44. Rational Software
Class Diagrams44
45.
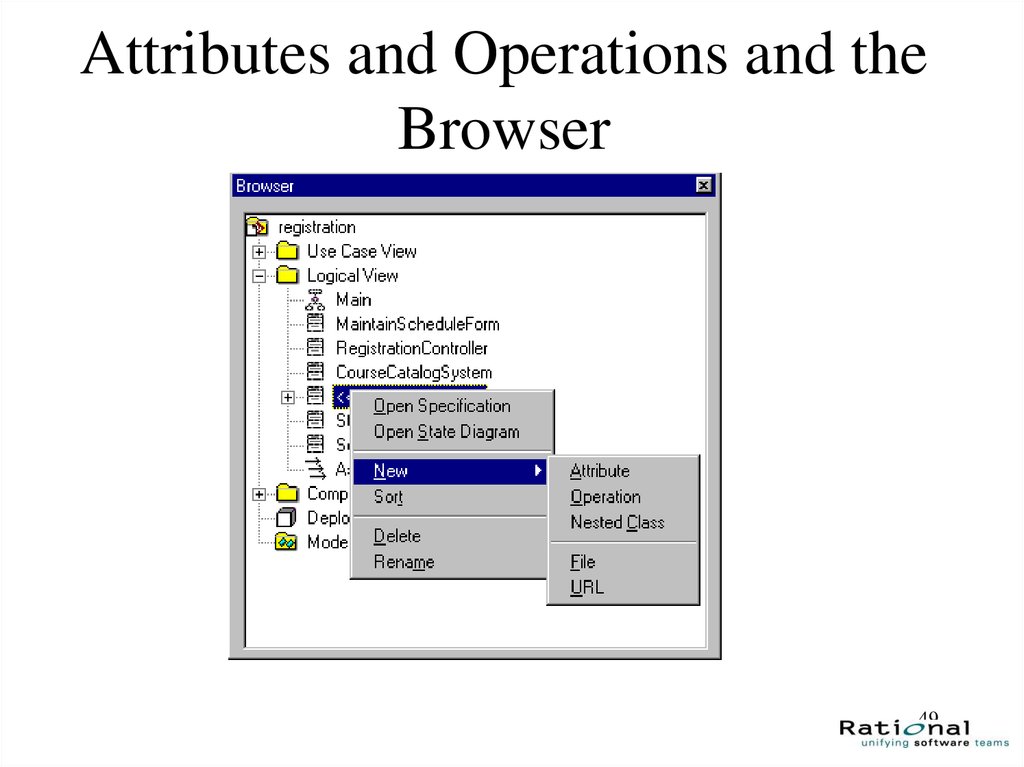
About the next 4 slides…• The next several slides deal with classes and class
diagrams.
• The next two slides show classes and packages in
the browser. A package contains some classes.
• The following two slides show adding attributes (a
class’s data; “operations” are a classes methods) to
a class from the Specification dialogue, and from
the browser directly.
• As you’d expect, the menus pop up when click the
right mouse button.
45
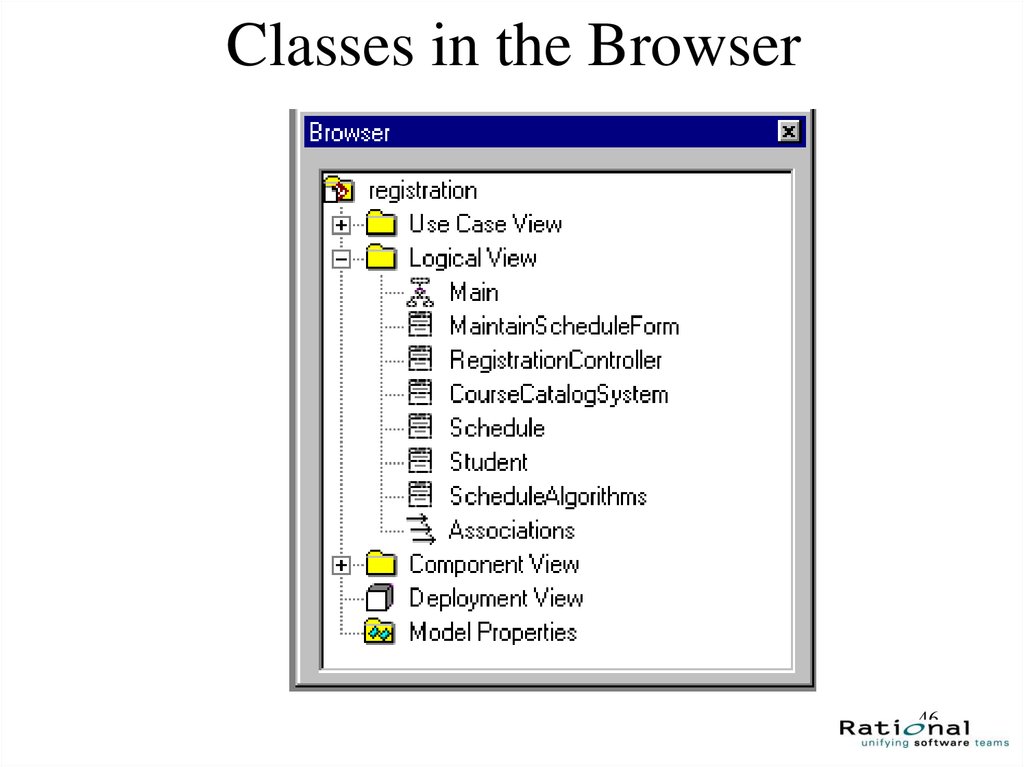
46.
Classes in the Browser46
47.
Packages in the Browser47
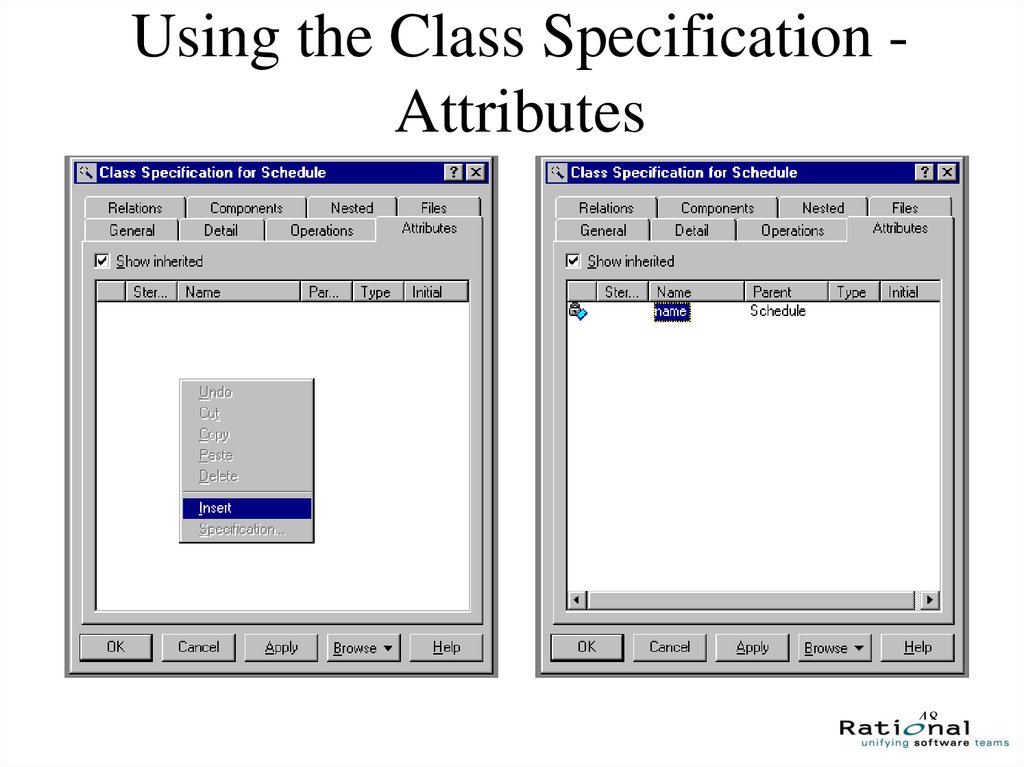
48.
Using the Class Specification Attributes48
49.
Attributes and Operations and theBrowser
49
50.
About the next slide…• The next slide shows how to specify the
visibility of class attributes in the model.
• The visibilities correspond to the notions of
visibility in Java (public, private, protected,
etc).
50
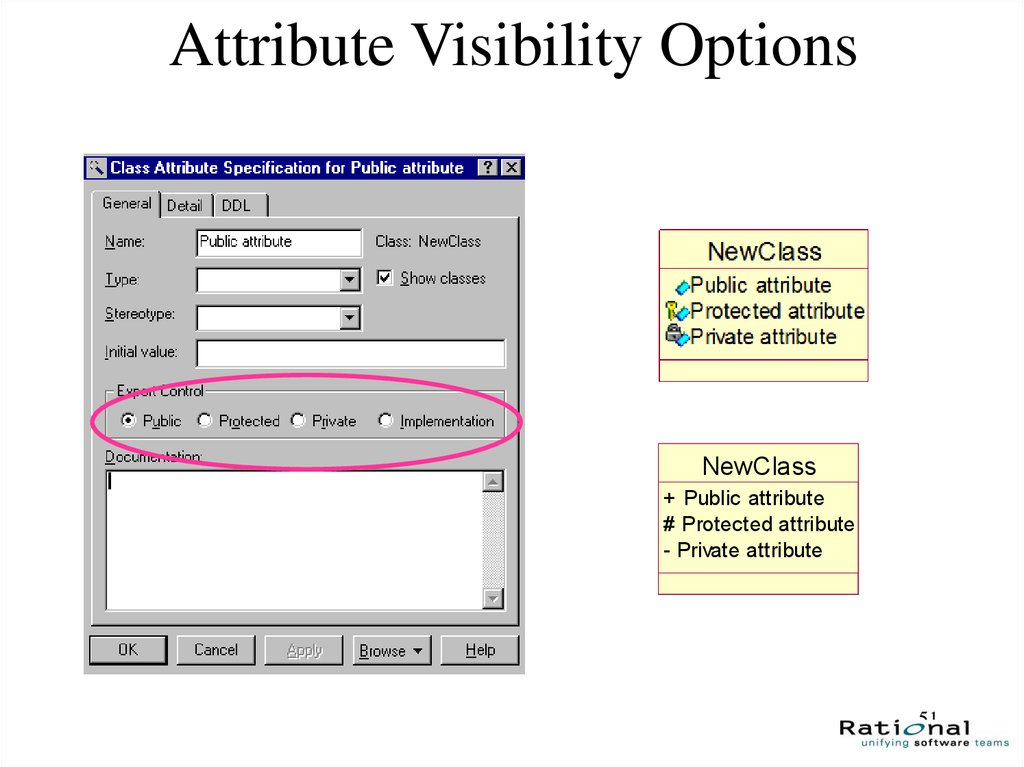
51.
Attribute Visibility OptionsNewClass
+ Public attribute
# Protected attribute
- Private attribute
51
52.
About the next 2 slides…• The next slide shows the icons for packages and
classes in a class diagram.
• The third icon is a class, marked with a stereotype.
Here the stereotype indicates a type of class, ie
that it is an “interface”. This doesn’t necessarily
mean that the class is a Java-type interface (but
that’s probably what they mean).
• The following slide shows the types of
associations (arrows) Rose allows in a class
diagram. They correspond to constructs in OO 52
design and programming.
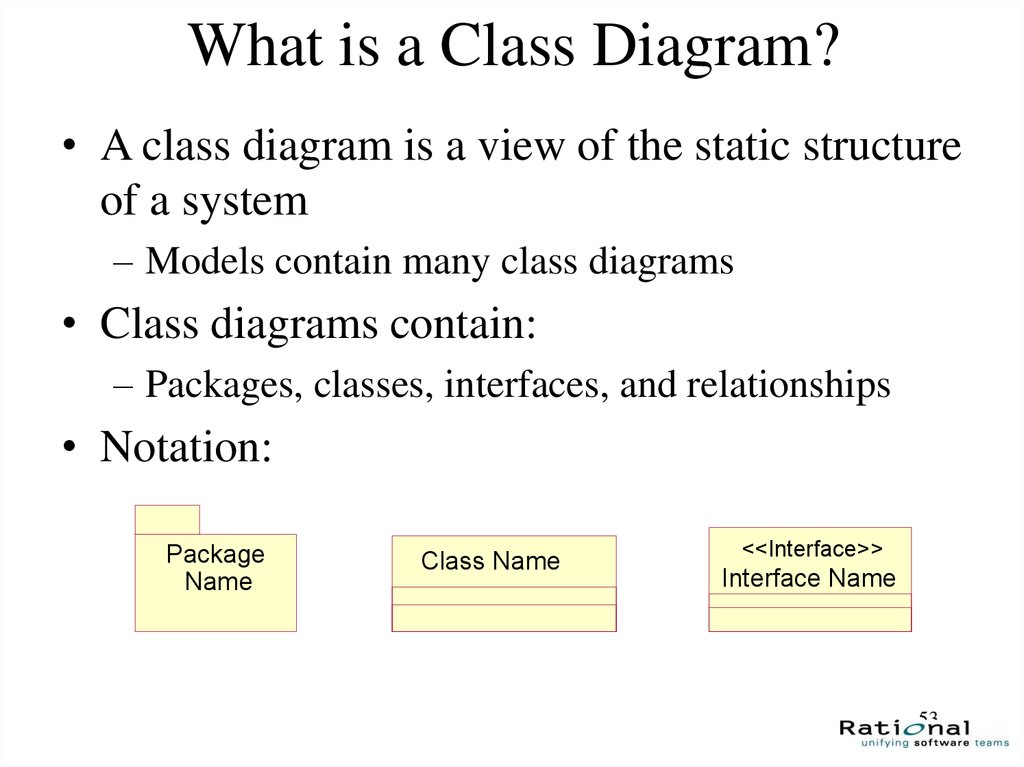
53.
What is a Class Diagram?• A class diagram is a view of the static structure
of a system
– Models contain many class diagrams
• Class diagrams contain:
– Packages, classes, interfaces, and relationships
• Notation:
Package
Name
Class Name
<<Interface>>
Interface Name
53
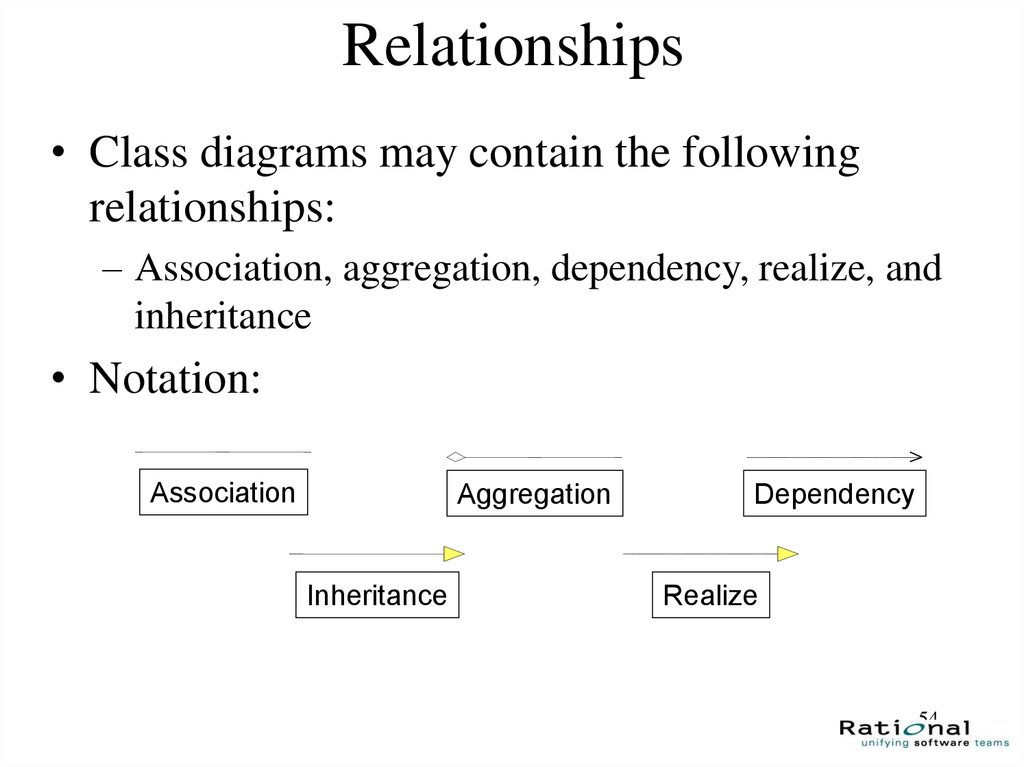
54.
Relationships• Class diagrams may contain the following
relationships:
– Association, aggregation, dependency, realize, and
inheritance
• Notation:
Association
Aggregation
Inheritance
Dependency
Realize
54
55.
About the next 2 slides…• The next slide shows a package diagram,
with dependencies.
• The following slide shows a class diagram,
with various associations between the
classes.
55
56.
Package Relationships56
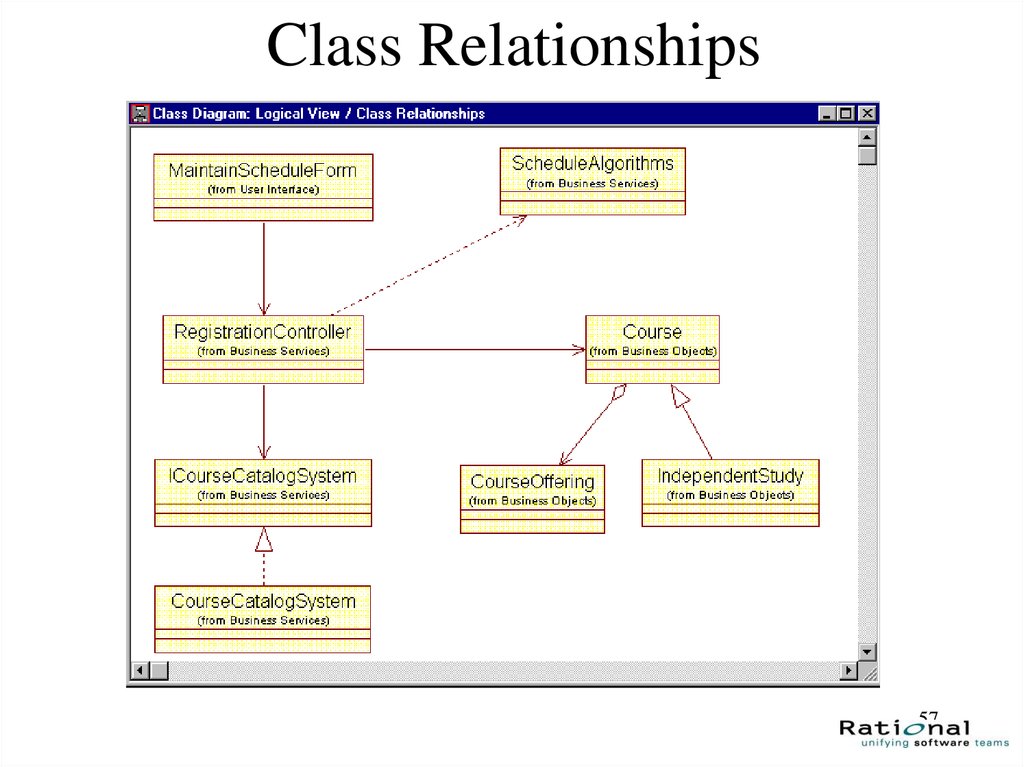
57.
Class Relationships57
58.
About the next 2 slides…• The next slide shows how cardinalities are
denoted in Rose.
• The following slide is the class diagram
example from before, but this time with
cardinalities marked on the associations.
58
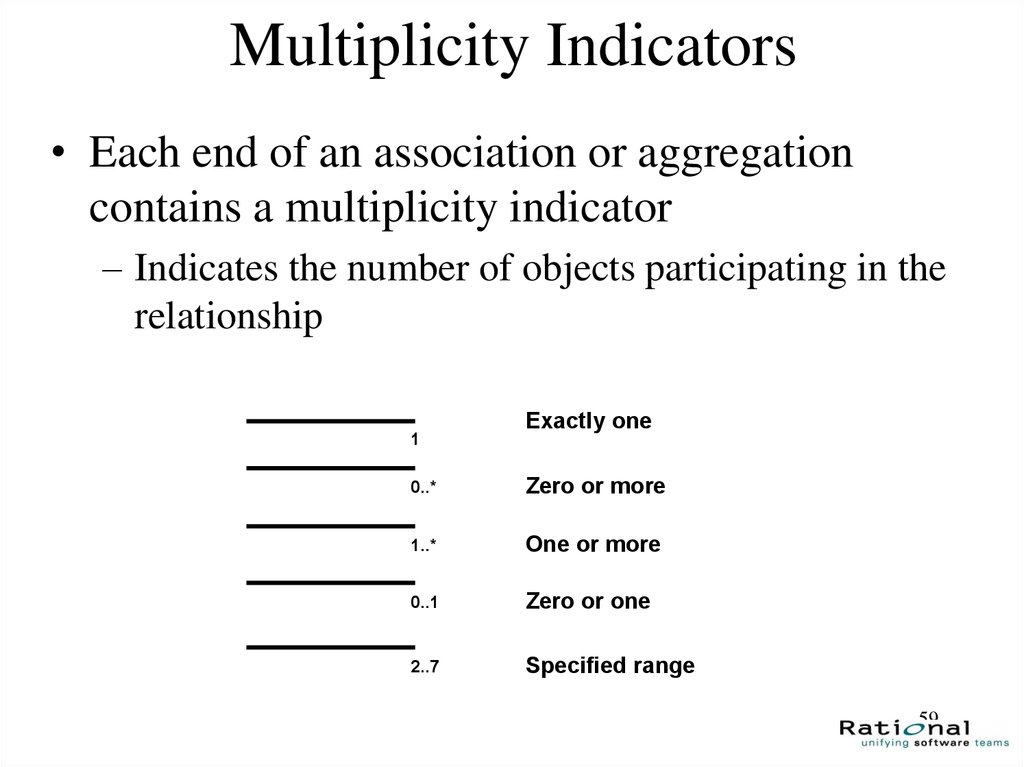
59.
Multiplicity Indicators• Each end of an association or aggregation
contains a multiplicity indicator
– Indicates the number of objects participating in the
relationship
1
Exactly one
0..*
Zero or more
1..*
One or more
0..1
Zero or one
2..7
Specified range
59
60.
Multiplicity Indicators60
61. Sequence Diagrams
6162. UML diagrams: sequence diagram
• Sequence diagram describe algorithms, though usually at ahigh level: the operations in a useful sequence diagram
specify the “message passing” (method invocation)
between objects (classes, roles) in the system.
• The notation is based on each object’s life span, with
message passing marked in time-order between the objects.
Iteration and conditional operations may be specified.
• May in principle be used at the same three levels as class
diagrams, though the specification level will usually be
most useful. (At the implementation level, you might
better use pseudocode.)
62
63. Sequence diagram example
6364. About the last example...
• Each box with connected line represents a distinct thing, where all thethings aren’t necessarily in the same piece of software, or software at
all.
• Arrows indicate message passing. That is, an arrow indicates that one
thing tells another thing to do something.
• Reverse arrows are implied. If arrow goes from A to B, and then
immediately afterward an arrow goes from A to something else, it is
understood that B completed it’s operation and returned control (and a
result, probably) to A.
• Time runs down the page. An comes before an arrow that is below it.
• Bracketed expressions indicate conditions. In the diagram, an error
document is returned if the fileLoad() operation returns and error.
64
65.
About the next 3 slides…• The next several slides are about sequence diagrams (for
algorithms, processes).
• The next slide shows how to create a sequence diagram in
browser, by associating it with a use case.
• The following slide shows some “objects” in a sequence
diagram, and the slide after shows how to associated an
object with a class. Objects are a bit more general than
classes, but you’ll get the best results if you create a oneto-one association between the objects in your sequence
diagrams and the classes you’ve defined (define your
classes first, if you can!).
65
66.
Creating a Sequence Diagram66
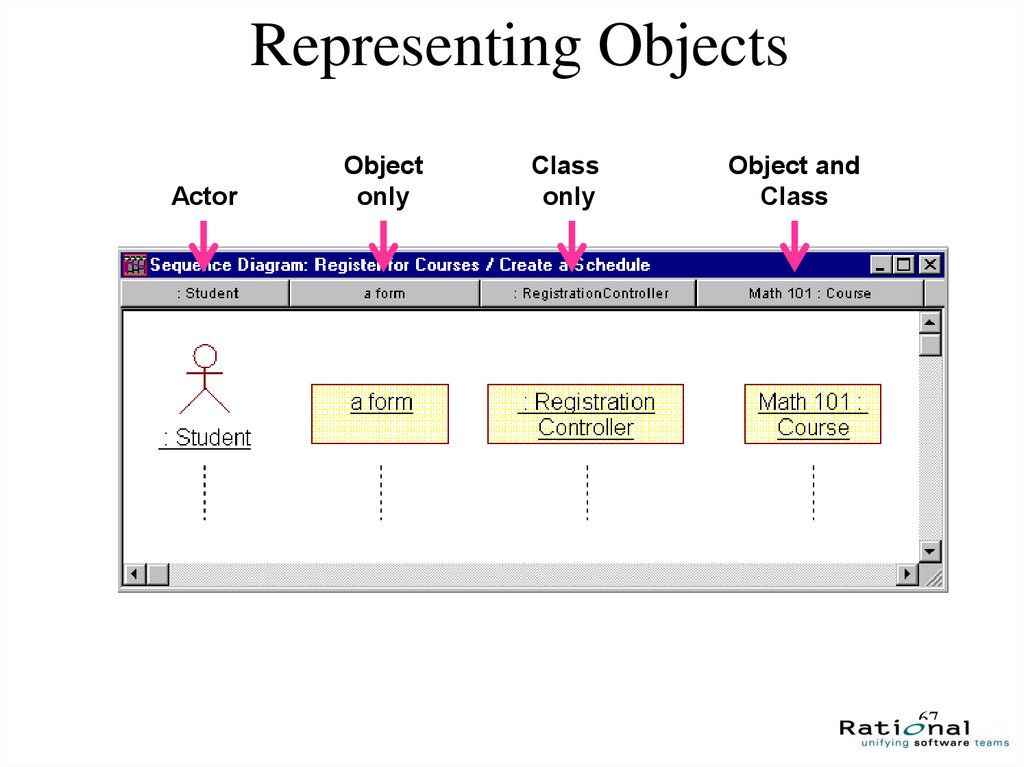
67.
Representing ObjectsActor
Object
only
Class
only
Object and
Class
67
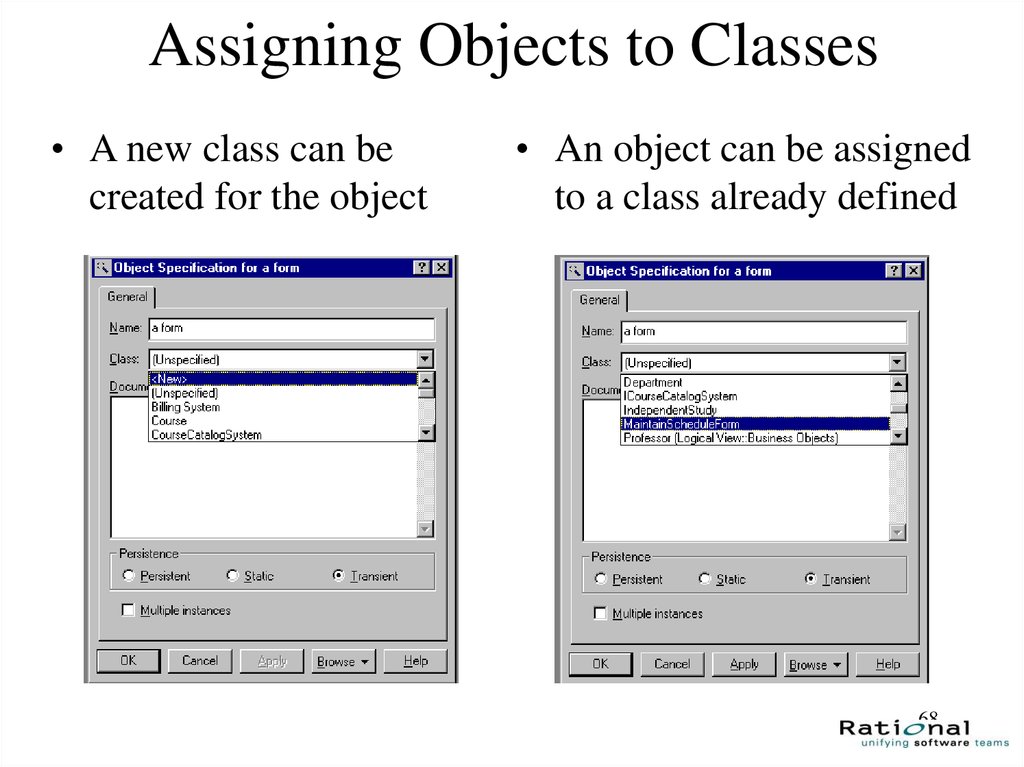
68.
Assigning Objects to Classes• A new class can be
created for the object
• An object can be assigned
to a class already defined
68
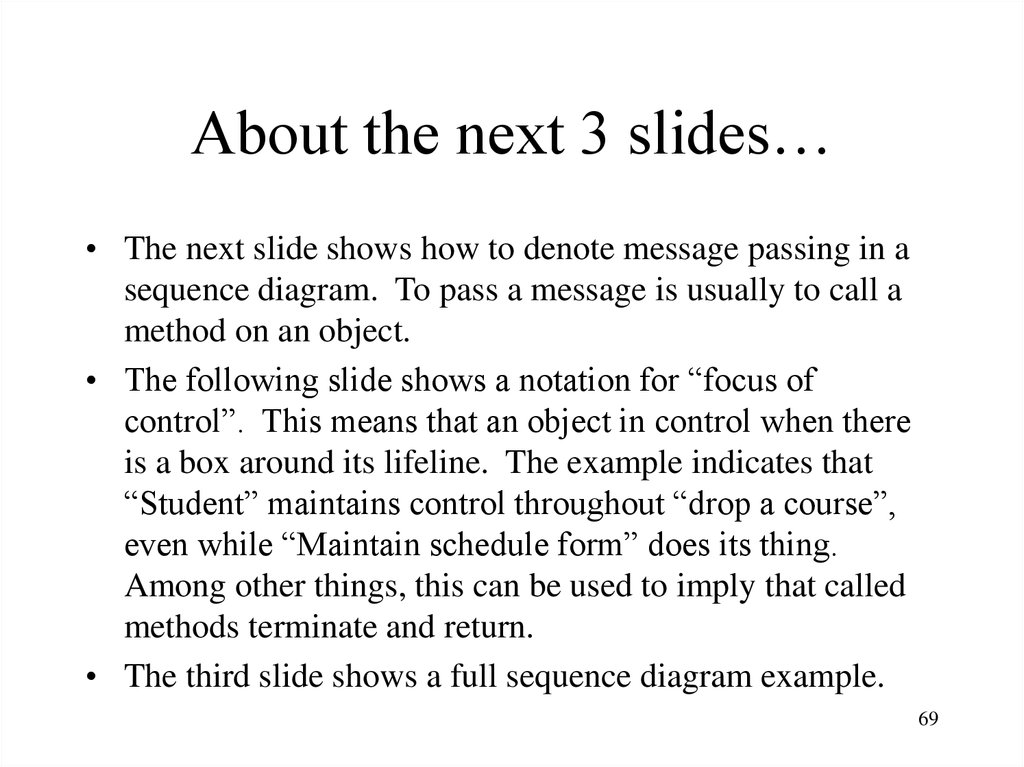
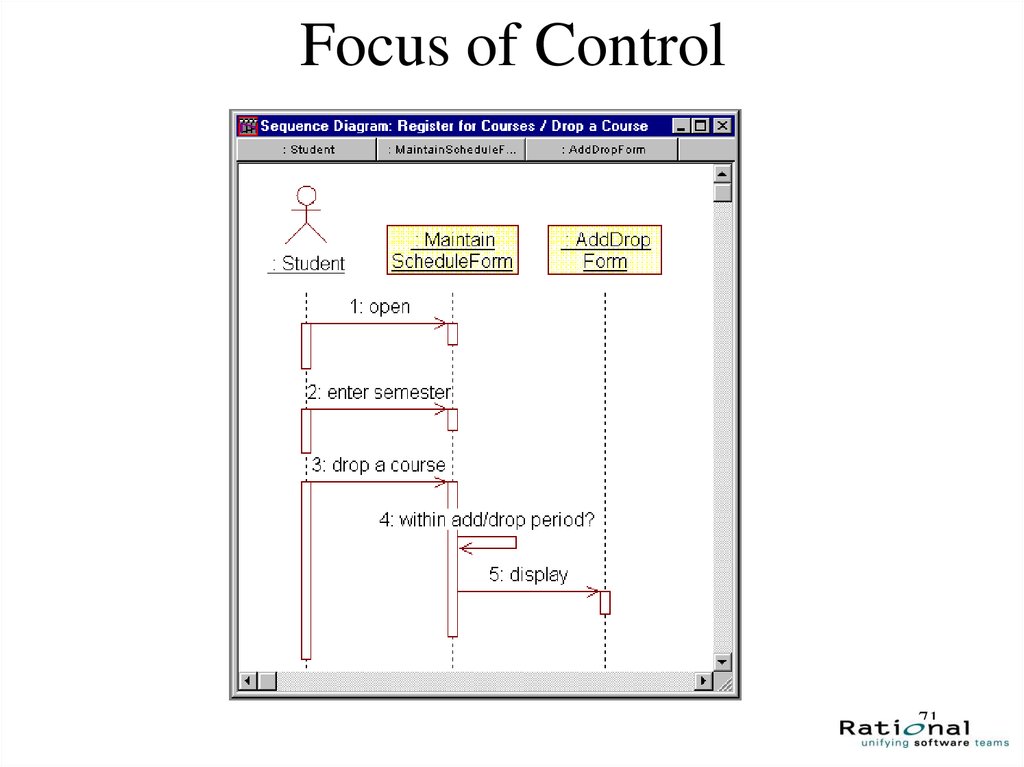
69.
About the next 3 slides…• The next slide shows how to denote message passing in a
sequence diagram. To pass a message is usually to call a
method on an object.
• The following slide shows a notation for “focus of
control”. This means that an object in control when there
is a box around its lifeline. The example indicates that
“Student” maintains control throughout “drop a course”,
even while “Maintain schedule form” does its thing.
Among other things, this can be used to imply that called
methods terminate and return.
• The third slide shows a full sequence diagram example.
69
70.
Messages70
71.
Focus of Control71
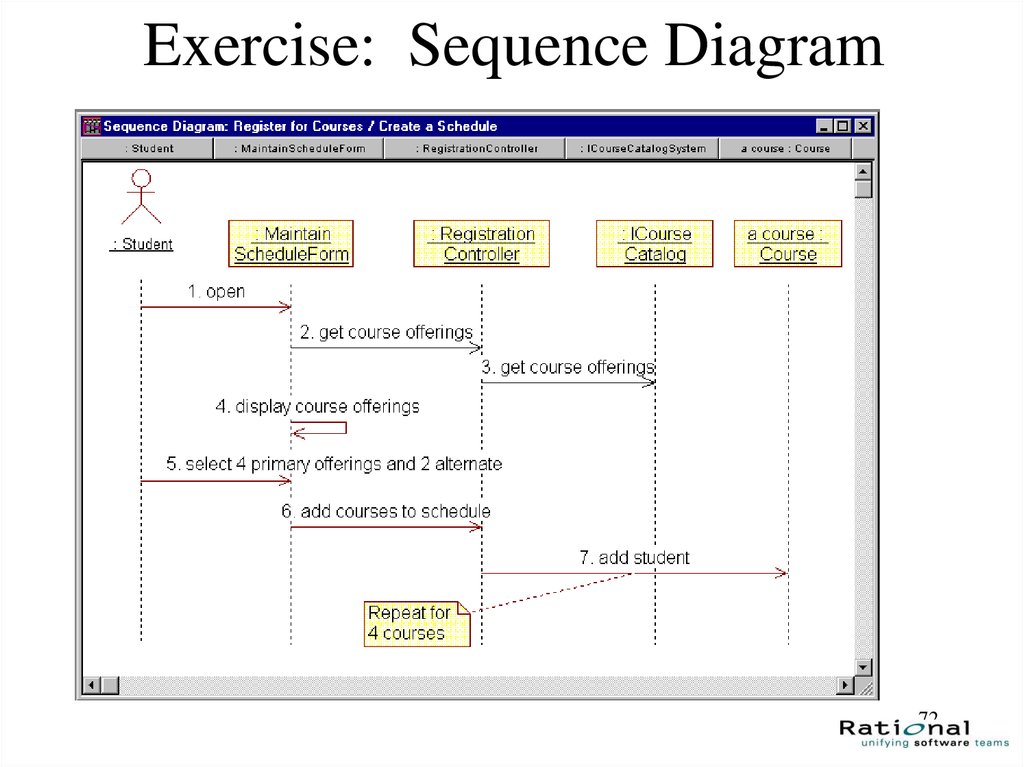
72.
Exercise: Sequence Diagram72
73. Other Diagrams
7374. UML diagrams: Package diagram
• A type of class diagram, package diagrams showdependencies between high-level system component.
• A “package” is usually a collection of related classes, and
will usually be specified by it’s own class diagram.
• The software in two distinct packages is separate; packages
only interact through well-defined interfaces, there is no
direct sharing of data or code.
• Not all packages in a system’s package diagram are new
software; many packages (components) in a complex
system are often already available as existing or off-theshelf software.
74
75. Package diagram example
7576. About the last example...
• This package diagram indicates that:– there are three dependent but decoupled software
components that will be developed in “My Project”,
which is itself a package or component.
– Parts of my software depend on some existing software
packages, which I won’t be developing, but just using
(“Webserver” and “Database”).
– There is a globally available package “User
authentication” which all the other packages depend on.
76
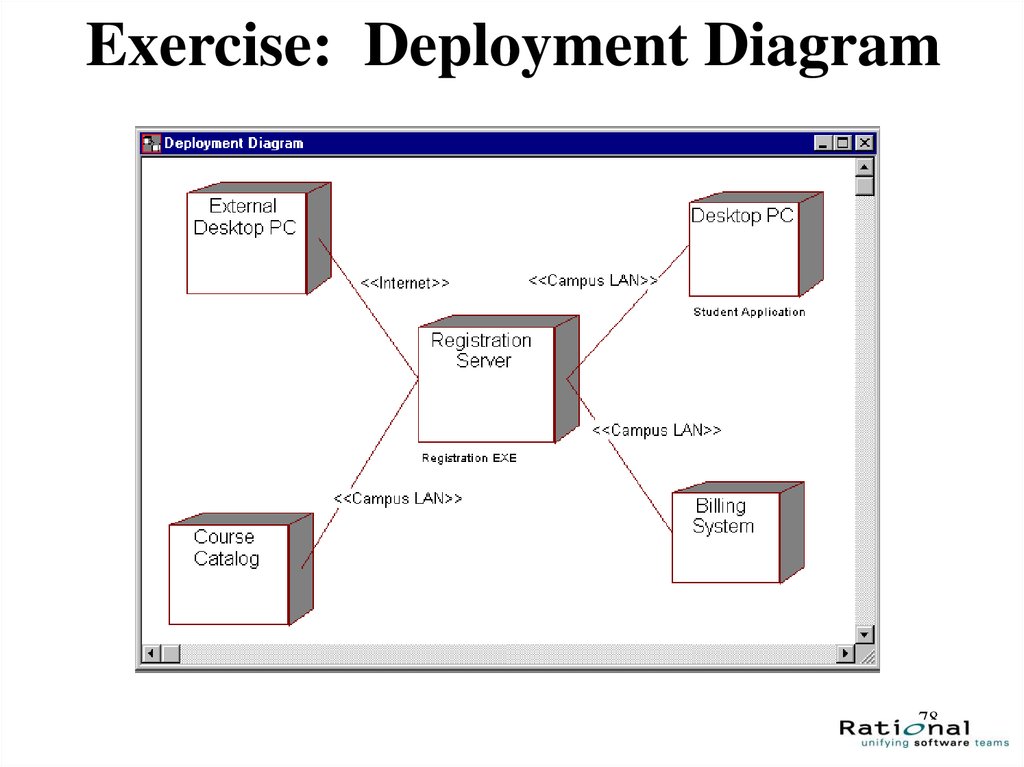
77.
About the next slide…• The next slide shows a complete deployment
diagram.
• A deployment diagram is useful for showing how
your software will be deployed on hardware. It
may show how your system will integrate with
existing systems in the domain.
77
78.
Exercise: Deployment Diagram78
79. UML diagrams: other diagrams
• State diagrams: similar in function to sequencediagrams, but with focus on the prerequisites for
an operation, rather than the exact sequence of
actions.
• Deployment diagrams: shows the installation of
software on hardware platforms.
• Others: activity diagrams, collaboration diagrams.
• Look in UML Distilled for examples.
79
80. UML diagrams: other diagrams
• UML Distilled: A Brief Guide to theStandard Object Modeling Language
Martin Fowler, Kendall Scott
• IBM Rational
http://www306.ibm.com/software/rational/uml/
80