
")
")


")


 education
Similar presentations:


Thematic group of experts CAHROM on enhancing the effective realization of Roma children’ compulsory school education
1. Thematic group of experts CAHROM on enhancing the effective realization of Roma children’ compulsory school education as the
mostefficient tool towards the mid-term improvement of the situation of
Roma communities, and added value of ensuring access to vocational
education for Roma youth
24-26/04/18
Iván Sörös
Head of Department
Ministry of Human Capacities
State Secretariat for Social Affairs and Social Inclusion
Chances For Children Department
2. Strategic background (EU)
EU Framework for National Roma Integration Strategies up to 2020„They should also widen access to quality early childhood education and care
and reduce the number of early school leavers from secondary education
pursuant to the Europe 2020 strategy. Roma youngsters should be strongly
encouraged to participate also in secondary and tertiary education.”
National Social Inclusion Strategy
3. Strategic background (HUN)
The government adopted strategies to promote quality, improve opportunities and tackle earlyschool leaving: 1) the Mid-term Strategy Against School Leaving Without Qualification (2014) to
prevent and tackle early-school leaving, to foster inclusive education; 2) the Public Education
Development Strategy (2014-20) to improve students’ skills and competences; and 3) the National
Social Inclusion Strategy (2011-20) to promote inclusion measures in child welfare, education and
employment.
Development of inclusive kindergarten education
Support of the integrative capacity of public educational institution, promotion of
desegregation process
Prevention of early school leaving especially among Roma girls
Continuation of individual and complex support for vulnerable students and development of
programmes (eg.: Útravaló Scholarship Programme, Arany János Program, After School Program)
Practice focused training of teachers and other professionals- „field” experience
Increase the number of disadvantaged students in higher education
Ensure educational follow up system, development of ESL early warning system
Targeted cultural and sport programs
Report on the implementation of the Hungarian Social Inclusion Strategy:
http://romagov.kormany.hu/
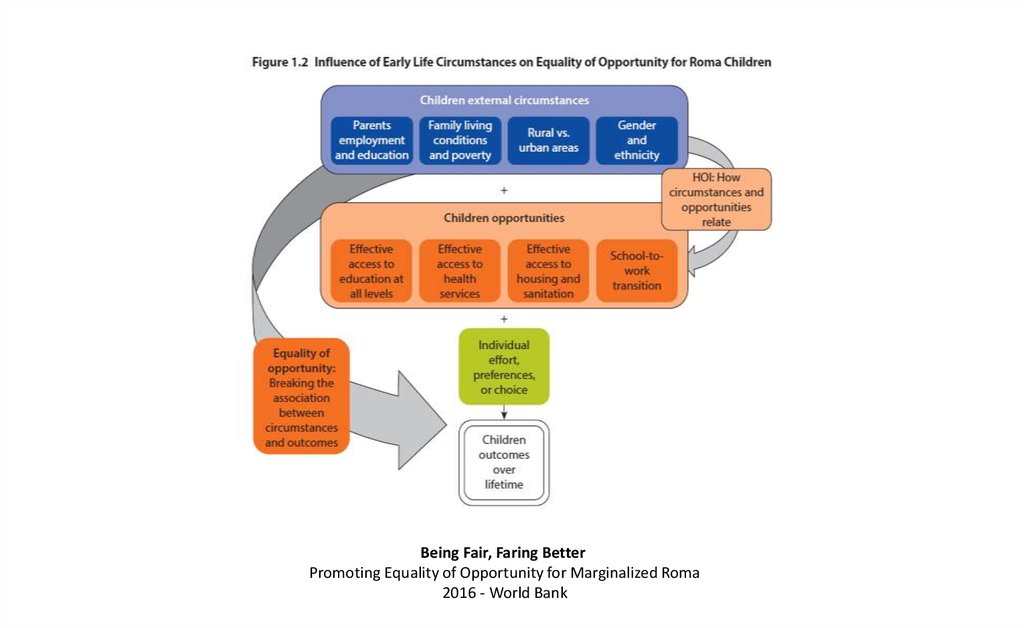
4.
Being Fair, Faring BetterPromoting Equality of Opportunity for Marginalized Roma
2016 - World Bank
5. Indicators from the indicator system of NSIS Data source: Hungarian Central Statistical Office (The table shows some of the
main indicators of the Hungarian Social Inclusion Strategy. The background color of the cellsindicates the direction of changes of the indicator: the red signs the worst value of the indicator the green stands for the
improvement of the indicator. The yellow and the light colors shows the changing situations.)
Index
Poverty
1.d
People at risk of poverty or social exclusion, AROPE, %
2009
2010
2011
2012
2013
29,6
29,9
31,5
33,5
34,8
12,4
12,3
14,1
14,3
15
20,3
21,6
23,4
26,3
27,8
11,3
11,9
12,8
13,5
13,6
People at risk of poverty or social exclusion aged 0–17
People at risk of poverty aged 0–17
Severe material deprivation among those aged 0–17
People living in households with low work intensity aged 0-17
37,2
20,6
25,5
11,9
Children with low birthweight, %
Rate of those having a difficulty paying utility bills
Overcrowding, %
Premature pregnancy rate
20,7
46,8
38,7
20,3
28,8
13,9
8,6
22,1
47,2
21,2
40,4
23,7
30,4
14,8
8,5
22,7
45,5
21,4
41,9
22,9
34,1
16,4
8,6
24,4
45,3
21,6
43,9
23,8
35,6
15,1
8,8
25
44
23,3
Roma
non-Roma
1.e
People at risk of poverty, AROP, %
Roma
non-Roma
1.f
Severe material deprivation, SMD, %
Roma
non-Roma
1.g
People living in households with low work intensity, LWI (aged 0-59)
Roma
non-Roma
2.1.b
2.1.c
2.1.d
2.1.e
2.1.3.a
3.1.a
3.1.b
3.3.c
2014
31,8
89,86
29,77
15
67,9
13,1
24
78,1
22,1
12,8
45,3
8,4
41,8
25
31,9
15,2
8,9
22,3
41,9
24,5
2015
28,2
83,7
26,8
14,9
63,1
13,7
19,4
67,8
18,1
9,4
26,7
6,6
36,1
22,7
24,9
11,2
19,4
41,1
23,9
2016
26,3
82,8
24,5
14,5
54,7
13,2
16,2
63,9
14,7
8,2
35,9
5,2
33,6
19,9
21,1
9,2
2017
25,6
75,6
24,7
13,4
48,4
12,8
14,5
55,5
13,8
6,5
25,2
4,5
31,6
14,8
19,2
7,5
6. Indicators from the indicator system of NSIS Data source: Hungarian Central Statistical Office (The table shows some of the
main indicators of the Hungarian Social Inclusion Strategy. The background color of the cellsindicates the direction of changes of the indicator: the red signs the worst value of the indicator the green stands for the
improvement of the indicator. The yellow and the light colors shows the changing situations.)
Index
2009
Education
1.1.1.
a
Rate of those with basic education at the maximum aged 15–74
2010
28,5
2011
2014
2015
24,4
23,8
Roma
81,5
81,2
78,4
non-Roma
23,2
22,9
21,8
41,9
40,8
40,6
Roma
34,0
37,2
29,4
non-Roma
42,7
43,0
41,2
20,9
20,5
20,6
43,7
2.2.c % of those aged 15–24 in tertiary education
23,1
44,2
22
26,6
2013
25,5
2.2.b % of those aged 15–24 in secondary education
27,8
2012
44,2
21,8
Roma
0,7
0,4
1,7
non-Roma
22,7
20,9
21,8
2.2.d Kindergarten attendance
2.3.a Early school leaving
87,8
87,8
88,3
89,7
90,2
91,5
10,8
11,4
11,8
11,9
11,4
11,6
Roma
64,2
57
59,9
non-Roma
8,7
10,3
8,9
15,5
13,6
11,6
Roma
47,0
38,2
40,9
non-Roma
13,6
12,7
9,8
2.3.b NEET among those aged 15–24
12,6
13,2
14,8
2016
12,4
11
2017
12,2
7. The proportion of the Roma population
Source: KSH – 2016. évi mikrocenzusból számított romanépesség-becslés, 20178. Ageing population
roma manroma woman
80-84
Ageing population
The Roma population is at
different
stages
of
demographic development
than
the
non-Roma
majority.
Within
the
roma
population
• the proportion of
young people is much
higher than in the nonRoma population;
• The proportion of
older generation is
much lower.
70-74
60-64
50-54
40-44
30-34
20-24
10-14
0-4
40 000
30 000
20 000
10 000
0
0
Non roma man
10 000
20 000
30 000
40 000
Non roma woman
80-84
70-74
60-64
50-54
40-44
30-34
20-24
10-14
0-4
500 000 400 000 300 000 200 000 100 000
Source: KSH – 2016. évi mikrocenzusból számított romanépesség-becslés, 2017
0
0
100 000
200 000
300 000
400 000
500 000
9.
100%97
95
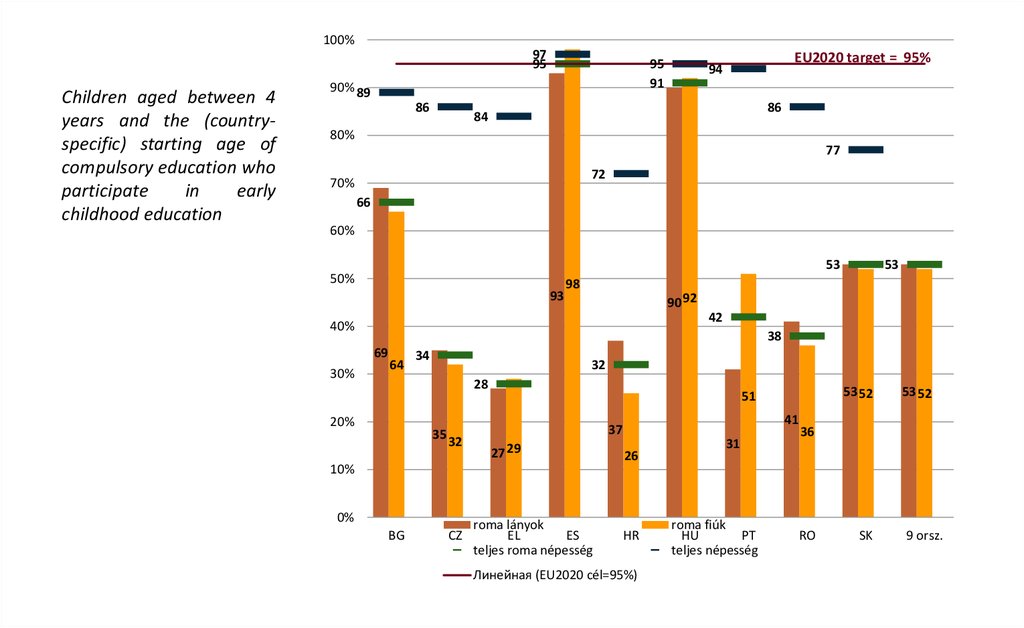
Children aged between 4
years and the (countryspecific) starting age of
compulsory education who
participate
in
early
childhood education
95
91
90% 89
86
EU2020 target = 95%
94
86
84
80%
77
72
70%
66
60%
53
50%
93
98
90 92
42
40%
38
69
30%
53
64
34
32
28
20%
35
32
BG
CZ
41
37
27 29
10%
0%
53 52
51
roma lányok
EL
ES
teljes roma népesség
26
HR
Линейная (EU2020 cél=95%)
31
roma fiúk
HU
PT
teljes népesség
53 52
36
RO
SK
9 orsz.
10. Age groups born in 1971 and 1991 (roma and non roma)
98100%
90%
100
93
98
92
89
Age groups born in 1971 and 1991
(roma and non roma)
The education of Roma youth has
significantly improved in the last twenty
years, but among non-Roma peers, the
proportion of those with higher education
has also increased considerably, so the big
differences remain.
80%
77
85
79
70%
68
60%
50%
46
40%
44
31
30%
23
20%
17
22
15
4
10%
1
0%
1 iskolai szint
Started
elementary
school
3 iskolai szint
4 iskolai szint
5 iskolai szint
0
6 iskolai szint
Started secondary
Finished
school
elementary school
Finished
secondary school
Graduation in
high school
Started college
or university
2 iskolai szint
1991-ben született roma fiatalok
1971-ben született roma fiatalok
1991-ben született teljes kohorsz
1971-ben született teljes kohorsz
Adatforrás: Hajdu-Kertesi-Kézdi 2014, 2. ábra "Roma fiatalok a középiskolában. Beszámoló a TÁRKI Életpálya-felmérésének 2006 és 2012 közötti
hullámaiból." Társadalmi Riport 2014, TÁRKI Budapest.
11.
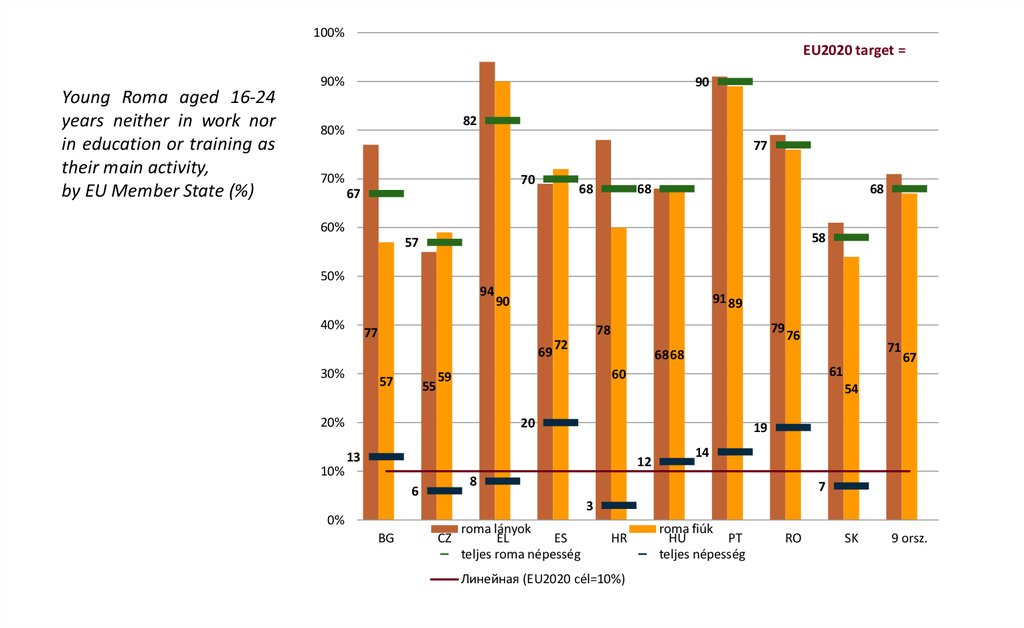
100%EU2020 target =
Young Roma aged 16-24
years neither in work nor
in education or training as
their main activity,
by EU Member State (%)
90%
90
82
80%
77
70%
70
68
67
68
68
60%
58
57
50%
94
40%
91 89
90
69
30%
57
55
72
76
67
61
60
54
20
19
13
12
14
8
6
71
68 68
59
20%
10%
79
78
77
7
3
0%
BG
CZ
roma lányok
EL
ES
teljes roma népesség
HR
Линейная (EU2020 cél=10%)
roma fiúk
HU
PT
teljes népesség
RO
SK
9 orsz.
12. Basic Information on education system
Educational statistics (2016/2017)Number of
schools/kindergarten
Number of
students
Average number of
pupils/school type
Number of RCCB
students
Number of
disadvantaged
students
Number of multi disadvantaged
students
Elementary school
3587
743 837
207
181 514
51 368
65 897
Kindergarten
4575
317 487
69
57 851
19 233
24 503
High school
894
214 464
240
12 686
3 747
2 051
Vocational - High school
830
205 062
247
21 970
7 070
4 254
Secondary school
148
7 109
48
1 254
578
1 257
Vocational school
610
105 742
173
22 668
7 777
8 793
SUM
10 644
1 593 701
297 943
89 773
106 755
13. Targeting children in need
We have data on the Roma population but there is no ethnic data collection within the publiceducation system. In the education system we target children and students based on socio
economic background.
Criteria
Benefit
Regular child care benefit
Low income of the family (per capita)
Free books, free meal, different projects and services
Disadvantaged
Low income of the family (per capita)
and one plus criteria (parent education level, poor
housing condition, unemployed)
Free books, free meal, targeted projects and services
to support school success, scholarship, no tuition fee
in arts school, extra points during the higher
education's recruitment process
Multi-disadvantaged
Low income of the family (per capita)
and two plus criteria (parent education level, poor
housing condition, unemployed)
Free books, free meal, targeted projects and services
to support school success, scholarship, no tuition fee
in arts school, extra points during the higher
education's recruitment process
14. The proportion of disadvantaged students in micro regions
Source: EDUMAP/micro regions/2016.15. Measures and tools within the educational system
I.II.
Extending compulsory kindergarten age from 5 to 3 (2015)
Early-warning and pedagogical support system has been developed (2016) to fight against dropout
III. Free school book from first grade up to ninth grade, 1 million pupils
IV. Improvement of low performing schools
V.
Free meals in kindergartens, schools and during school holidays
VI. Higher salary for teachers who are applying inclusive teaching methods with socially
disadvantaged children and students introduced (2018)
VII. Primary school districts have been regulated (2017)
VIII. System evaluations (national and international assessments of student learning outcomes to
monitor performance of the education system)
IX. Social workers or child-care professionals in schools where needed (pilot from 2016 – extended
in 2018)
X.
Participation in the InSchool project
16. The social inclusion measures
NameTanoda - Study Hall
Arany János Program
Goal
Preventing early school
leaving and service
development
Preventing early school
leaving and institutional
development in secondary
education
Target and age
group
Number of reached
students and institutions
Inside or outside
Public Education
System
Since when
6-18
280 Tanoda - 8500 student
OUT
2004
15-19
3000 student
IN
2000/2004/2007
For the journey – Útravaló scholarship
Preventing early school
leaving
12-25
13000 student
IN
2005
Second Chance Program
Preventing early school
leaving institutional
development
16-25
500 student
IN
2004
Preventing Roma girls from early
school leaving
Preventing early school
leaving service development
10-18
89 - 1800 student
OUT
2015
Kindergarten Development Program
Institutional development
3-6
570 (kindergarten) - 39000
children
IN
2007
Sure Start Children House
Early childhood
development and service
development
0-3
112 (70 more) institution
OUT
2003
Integrated Micro regional Children
Services
Institutional and service
development
0-25
31 (micro region) - 25000
children
OUT
2007
Creating equal opportunities in public
education
Institutional development
6-15
150 (school)
IN
2013
17. Common elements of the social inclusion measures
Started as a pilot and extended after years of experience
Reflect the needs (local and strategic level)
Strategic background (NSIS)
Continuously monitored end redesigned if needed
Target group: disadvantaged and Roma children
Built on one another
Aimed to become a regular and sustainable service
Support program or/and horizontal network
Different implementers and involvement of various stakeholders