


 english
Similar presentations:


")


The Scientific Research Process
1. The Scientific Research Process
Research Problems, Definitions, Theories, andHypotheses
2. Specifying the Research Question
The most important purpose of social science research is to answer questions aboutsocial phenomena.
As scientists we are driven by curiosity about the social world and search for causal
explanations.
Why is wealth distributed more equally in some countries than others?
Why do some persons vote in elections, while others do not?
Why do Supreme Court justices reach the decisions they do on the cases before them?
Do Supreme Court decisions affect people’s opinions on issues and people’s support for
the Supreme Court?
How sensitive is the American public to combat casualties, and does the flow of combat
casualties affect support for war?
Does negative campaign advertising affect support for particular candidates?
Do partisan divisions in Congress and between Congress and the presidency affect the
design of new federal agencies?
Does the design of federal agencies affect the ability of Congress and the president to
influence them?
3. Level of Analysis
Political scientists attempt to answer questions about:Individuals (voters, citizens, residents of a particular area, members of Congress,
Supreme Court justices, presidents)
Groups (political parties, interest groups, labor unions, international organizations)
Institutions (state legislatures, city councils, bureaucracies, district courts)
Jurisdictions (cities, states, nations)
Policies or policy responses (environmental policy, the response to Hurricane
Katrina, nuclear proliferation policy, etc.)
When faced with something that interests you, most students will begin by saying they
are interested in X (where X is a set of individuals, groups, institutions, or jurisdictions).
However, this is much too vague to be of much use in doing scientific research.
4. Limiting the Scope of the Investigation
The preceding is much too broad. What is required is that the researcher limit the scopeof the investigation to some question that can be answered scientifically.
A poorly worded research question leads to a lot of wasted time and ultimately no new
knowledge.
Framing the question enables the researcher to identify what information is needed to
answer the question, and makes the project more efficient.
Any of the following would probably be good research questions enabling the researcher
to gather data and formulate answers.
Why did some members of Congress vote for the health care bill, while others did
not?
Why did some members of the Supreme Court vote to stop the election recount in
Florida in 2000, while others did not?
Why do some states have laws strongly regulating the activities of lobbyists, while
others do not?
5.
What determines the amount of spending per pupil in school districts across thenation?
Why are some judges more protective of the rights of the accused than others?
What determines the level of U.S. financial support for the United Nations?
What determines the level of U.S. foreign aid given to other countries?
What determines how U.S. foreign aid is distributed, whether through multinational
organizations or unilaterally?
The number of questions available to political scientists is virtually limitless.
However, just saying you are interested in specific individuals, groups, institutions,
jurisdictions, or policies is not likely to be fruitful.
Political science research questions should pertain to political phenomena.
6.
Political science research questions should not be overly concerned with discrete facts.Examples:
What proportion of men and women voted for Obama in the 2008 election?
How many vetoes did each president issue since World War II?
What has been the average job approval of each president since World War II?
How much did each political party spend in presidential elections since the Federal
Election Campaign Act of 1976?
What percentage of registered voters voted in elections since World War II?
How long to political appointees serve?
Limiting the research question to factual matters limits its significance. Although
important, facts alone are not sufficient to yield scientific information.
What is missing is an association, dependence, or covariance.
Scientists are generally interested in how to advance and test generalizations relating one
phenomenon to another.
7.
Thus, each of the preceding factual questions can be restated in such a way as to makethem interesting objects of scientific investigation.
What determines proportion of men and women voted for Obama in the 2008
election?
What determines how many vetoes each president issued since World War II?
What determines presidential approval ratings?
What determined spending by political parties in presidential elections after 1976?
What determined the percentage of registered voters who voted in elections since
World War II?
What determines how long to political appointees serve?
8.
We can also restate each question more specifically to evaluate relations betweenresearch concepts?
How did policy perceptions of men and women affect voting for Obama in the 2008
election?
How did divided government affect the number of vetoes cast by presidents since
World War II?
How do the state of the economy and foreign policy crises affect presidential approval
ratings?
How did the Federal Election Campaign Act of 1976 affect spending by political
parties in presidential elections?
How did economic well-being affect the percentage of registered voters voting in
elections since World War II?
How do opportunities in the private sector of the economy affect how long political
appointees serve?
9. Where do research questions come from?
Facts may be useful in pointing us toward a research question of interest.For example, consider the gender gap in American voting behavior. We know factually
that women vote for Democrats more often than men vote for Democrats?
An interesting research question is “Why?”
10.
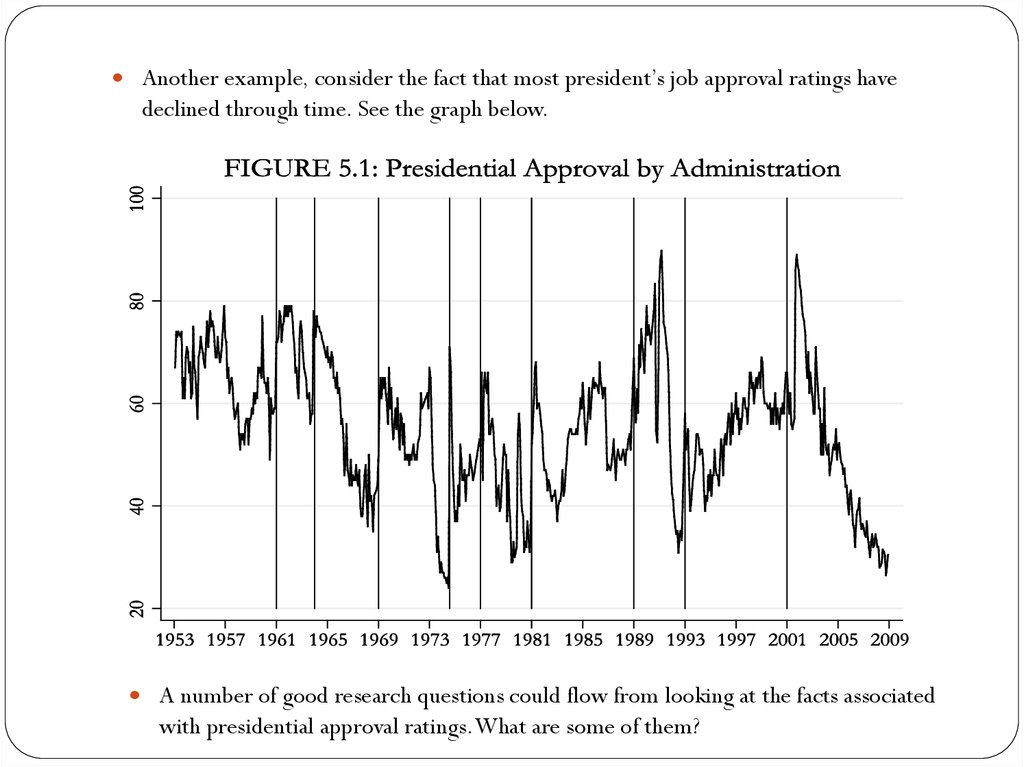
Another example, consider the fact that most president’s job approval ratings havedeclined through time. See the graph below.
A number of good research questions could flow from looking at the facts associated
with presidential approval ratings. What are some of them?
11.
Another example, consider the average liberalism/conservatism of the American publicsince World War II. See the graph below.
A number of good research questions could flow from looking at the facts associated
with this graph. What are some of them?
12. Drawing Normative Conclusions?
Questions asking the researcher to address normative issues are inappropriate topics forscientific research. Rather, our questions are always empirical. Political scientists do not
address the types of “debate topics” which you perhaps were exposed to in high school.
For example:
Should the United States have gone to war in 1991 after Iraq invaded Kuwait?
Should the U.S. eliminate tax breaks to companies who locate their businesses
outside our borders?
Should the U.S. desegregate the public schools?
Should the U.S. curtail support for the United Nations?
While these are interesting normative questions, they cannot be answered with empirical
data. Empirical analyses can provide information which might help in answering these
questions. However, this is not the primary business of social science. Answering these
types of questions are matters for policy makers.
Political scientists do not generally draw normative conclusions in their research reports.
13.
On the other hand, normative questions may sometimes drive us to want to do empiricalresearch.
For example, I firmly believed normatively in 1992, that bureaucracies such as the Equal
Employment Opportunity Commission should be unresponsive to political influence,
especially from a president who wanted to curtail enforcements. This led me to do a
research project on whether the EEOC was actually independent of presidential
influence.
The results of my research, which was empirical, led to threats against my career, as well
as a confrontation between former members of the Reagan administration who wanted
me to report something other than what I found.
14. Selecting a Research Problem
Selecting a research problem and defining it is perhaps the most difficult part of doingscientific research. For some of us, they come easy. For others, not so easy. Start early
Where do research problems come from?
Personal experience/observation of the world. For example, a former campaign
worker may want to know the determinants of winning campaigns. Or, an immigrant
may want to know what determines public attitudes on illegal immigration.
The research and writings of others pique’s your interest. For example, many
scholars have written about the “median voter”, asserting that this is a powerful
explanation for politician behavior.
Look for common wisdom among the media or population, and then test that
common wisdom scientifically. For example, the media seems to have a common
perception that the electorate is polarized. Is this true?
Find studies that reach conflicting conclusions, then attempt to reconcile them. For
example, studies using microdata on political participation often reach conflicting
conclusions from those using macrodata.
A general theory may interest you. For example, theories of rational decision making
have interested students of bureaucracy for a long time. Another example,
democratic theory is often of interest to political scientists.
There are no rules which limit what is a valid topic for research.
15. Proposing Explanations
Explanations are also called “theories.”A theory is just a proposed explanation for the phenomenon contained in our research
question.
As we noted last week, we define a dependent variable and attempt to explain it as a
function of independent variables.
Again, a dependent variable is the variable we seek to explain
An independent variable is a variable doing the potential explaining.
Variables are “variable.” Variables are necessary to find covariation. A constant can
NEVER explain a variable. For example, consider an explanation for the variable “public
mood” which was graphed above. Can we explain the variations in the variable “public
mood” using a constant such as the number of effective political parties in the American
system? What about the gender composition of the American electorate? It is true that
this composition is changing somewhat. However, has it changed enough to account for
variations in the liberalism/conservatism of the electorate?
16.
It is often the case that a theory entails inclusion of more than one dependent andindependent variables.
For example, consider the presidential “saber rattling” example from last time.
We posited that there are both foreign and domestic factors which may be at the root of
presidential threats.
Foreign Factors-War, major crises and event.
Domestic Factors-Elections, the mass media, presidential approval, economic performance,
scandal.
Similarly, there are often multiple factors which must be considered to fully account for
most political phenomena.
When there are multiple explanations to consider, we want to know the effect of each
factor INDEPENDENT of the other factors.
We are interested in “controlling for” other factors when considering the effect of a
single factor.
For example, in the case of saber rattling, we want to know the independent effect of
elections on saber rattling. Said differently, we want to know the effect of elections,
while controlling for war, major crises and events, and all of the other domestic factors.
17. Causality
A common definition of causality holds that X causes Z, iff 1) there is covariationbetween X and Z, and 2) the relation between X and Z is not spurious, and 3) X is
temporally antecedent to Z.
For example, consider the following causal diagram.
Note that variables can have both direct and indirect effects on other variables.
Y
X
Z
X affects Z directly.
X affects Y directly.
X also affects Z indirectly through the upward paths. In this case we say that Y has an
intervening effect in the relationship between X and Z. Or, another way of saying this is
that Y moderates or mediates the relationship between X and Z.
What happens if we hold the variation in Y constant?
18.
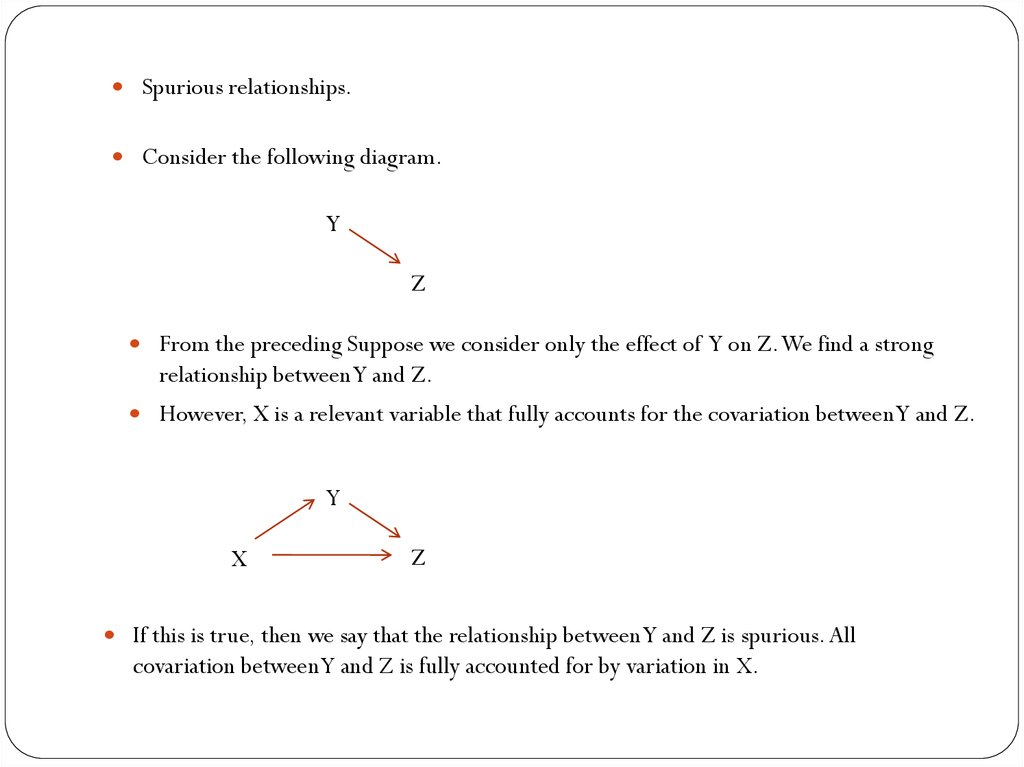
Spurious relationships.Consider the following diagram.
Y
Z
From the preceding Suppose we consider only the effect of Y on Z. We find a strong
relationship between Y and Z.
However, X is a relevant variable that fully accounts for the covariation between Y and Z.
Y
X
Z
If this is true, then we say that the relationship between Y and Z is spurious. All
covariation between Y and Z is fully accounted for by variation in X.
19.
So again, what does causality between two variables X and Z imply?Covariation – If outcomes of a variable Z move jointly with outcomes of a variable X,
then we say that there is covariation between X and Z.
Non-Spuriousness – If outcomes of a variable Z covary with outcomes of a variable
X, and are not fully determined by some other variable or variables, then we say that
the relation between X and Z are non-spurious.
Temporal Antecedence- If outcomes of a variable Z are preceded by outcomes of a
variable X in time, then we say that X is temporally antecedent to X.
How does one show covariation?
One approach is to conduct true experiments.
Another is to conduct quasi-experiments and use statistical methods.
Statistics can show covariation.
Statistics can demonstrate non-spuriousness through statistical control.
Statistics can also enable showing temporal sequence.
20.
Is covariation sufficient to show causality? Why/why not?If all three of the elements of causality can be demonstrated, does this mean that
relations may be truly causal? Why/why not?
Parsimony versus completeness of explanation. As social scientists we do not strive to
have a complete explanation of the phenomenon of interest. Having a complete
explanation is virtually always impossible. Social phenomena always have a range of
uncertainty.
Social scientists seek parsimonious explanations. We seek causal explanations which do
not omit any important variables which might produce spurious results.
21. Ways of Depicting a Theory
One way of depicting a theory is through simpleverbalization. Examples:
Economic self-interest explains people’s voting behavior.
The reelection incentive explains congressmens’ voting
decisions.
Party Identification determines people’s attitudes about global
warming.
Gender explains the propensity of people to vote democratic.
22.
However, it may also be of use to construct a causal diagram.Consider, for example, this causal diagram which was published in my article in the
American Journal of Political Science entitled “Presidential Saber Rattling and the Economy.”
Figure 1: Potential Paths of Influence of Presidential
Saber Rattling on Economic Behavior and Performance
Heard Negative
Economic News
President’s Saber
Rattling
Economic
Performance
-
+
-
-
-
-
Personal
Consumption
-/+
+
+
+/-
Events
+
-
+/-
Consumer Confidence
Interest
Rates
23.
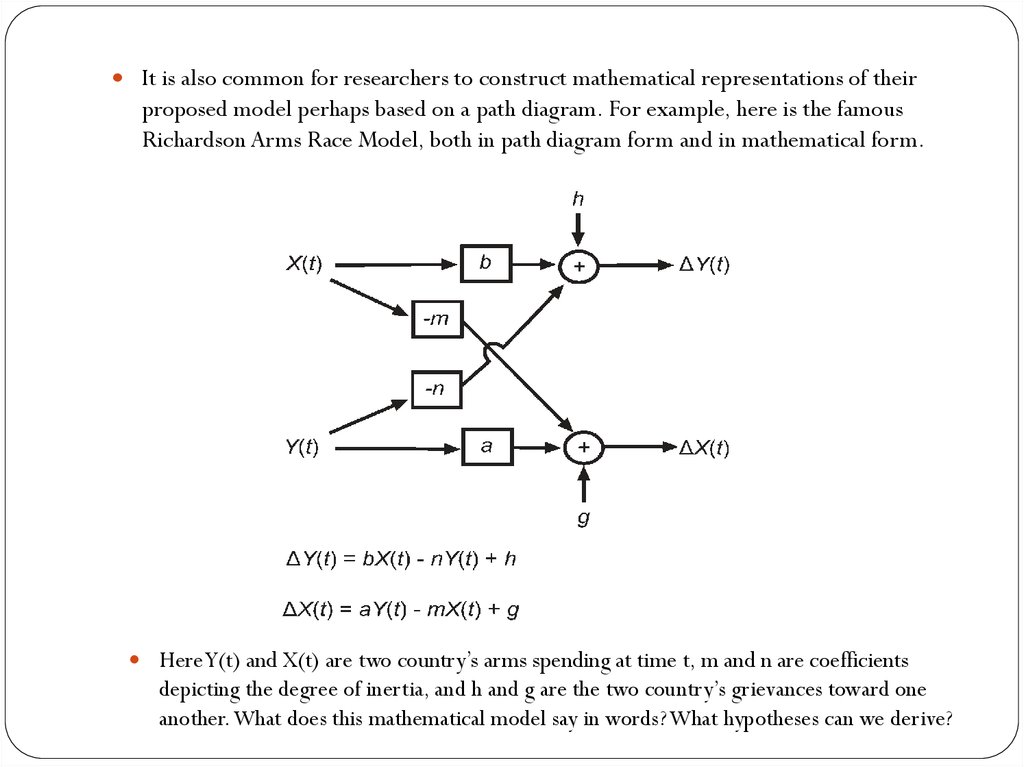
It is also common for researchers to construct mathematical representations of theirproposed model perhaps based on a path diagram. For example, here is the famous
Richardson Arms Race Model, both in path diagram form and in mathematical form.
Here Y(t) and X(t) are two country’s arms spending at time t, m and n are coefficients
depicting the degree of inertia, and h and g are the two country’s grievances toward one
another. What does this mathematical model say in words? What hypotheses can we derive?
24. Deductive versus Inductive Theory Building
Theories can be built either deductively, or inductively.Deductive theory building starts with a mathematical representation, often based on
game theory or mathematical model. Hypotheses are deduced from the theoretical
model. For example, what hypotheses could we deduce from the Richardson Arms Race
model on the preceding slide.
Inductive theory building posits a theory based on our store of relevant information. As
we add to that store of relative information, the theory changes.
25. Formulating Hypotheses
An hypothesis is an explicit statement by the researcher of how phenomena of interestare related to one another.
Characteristics of a good hypothesis
It is an empirical statement.
It is stated as a generality.
It is plausible.
It is specific.
It is testable. Said differently, it must be falsifiable.
An empirical statement. Suppose a researcher posits that “Democracy is the best form of
government.” This is not an empirical statement. Rather, it is a normative statement
which cannot be tested with empirical data.
The hypothesis needs to be a statement about how concepts are related to one another.
For example. “Democracy produces higher economic development.” would be a good
hypothesis.
26.
A good hypothesis should not be too specific.For example, we might hypothesize that economic upheavel in Germany was the
cause of World War II.
However, this would leave us with a limited store of knowledge specific to World War
II. Alternatively, we might posit the general explanation, War is caused by a nation
experiencing economic distress.
Why is the more general hypothesis better?
A good hypothesis should be plausible.
For example, there is a well-known statistical relationship between the frequency of
sunspots and movements in the stock market. Would a statement hypothesizing this
relationship be a good hypothesis? Why/why not?
As another example, Edward Tufte in his book Data Analysis for Politics and Public
Policy showed there was a relationship between the number of radios owned in
Britain and the number of mental defectives. Good hypothesis or not?
27.
We stated above that a good hypothesis should not be too specific. However, a goodhypothesis should have a degree of specificity. For example, it should force the researcher
to posit a direction to relationships.
Examples:
The older a person becomes, the more likely they are to be conservative in their
political views.
The longer a person has identified with a particular political party, the less likely they
are to change their political views.
Crime is higher in poor countries than it is in rich countries.
Specific hypotheses should not be too ambiguous. For example, here are some examples
of hypotheses that are too ambiguous.
How a person votes for president depends on the information she is exposed to.
A country’s geographic location determines the type of political system it develops.
A person’s capabilities determines her political attitudes.
Guns do not cause crime.
28.
A good hypothesis should be testable and falsifiable.Example:
Hypothesis: The more compliant a person was as a child, the more likely they are to
adhere to laws as an adult.
Can this hypothesis be tested?
Example:
Hypothesis: The greater the economic development of a country, the more the people
of that country have access to transportation, the media, and the internet.
Is this hypothesis testable? It seems tautological. A tautology is a statement linking
essentially the same two concepts.
29. Units of Analysis
The unit of analysis of a hypothesis is the basic entity to which the hypothesis is said toapply.
For example, hypotheses can pertain to individuals, groups, states, nations, institutions,
elections, wars, conflicts, etc.
What are the units of analysis for the following hypotheses?
Highly educated voters are more likely to vote for liberal candidates.
Democratic regimes are less likely to go to war against one another.
Southern state legislatures are more likely to pass laws restricting abortion.
Supreme Court justice liberalism determines Supreme Court voting on civil liberties
issues.
Wars are more likely when countries are in close proximity to one another.
During poor economic times, the incumbent political party is more likely to lose a
presidential election.
30. Cross-Level Analysis
Sometimes researchers use data with one unit of analysis to test hypotheses that pertainto another level of analysis.
They may have only aggregated data, but want to study the behavior of individuals. This is
sometimes called “ecological data”.
Hypothesis: African Americans are more likely to support female candidates than other
groups.
The intended unit of analysis is African American voters.
The researcher obtains data on election precincts in which there were female candidates.
The researcher computes the proportion of votes that were cast for female candidates that
were by African Americans and by people generally.
Based on a comparison of these proportions, the researcher concludes that African
Americans voted more often for the female candidate.
There is a fundamental problem with this conclusion, however. Without knowing the total
proportion of African Americans in each precinct, the proportions are not comparable.
The researcher has used the wrong unit of analysis to test the data.
This is the so-called ecological fallacy.
31. Cross-Sections, Time Series, and Pooled Cross-Section Time Series Data
A cross sectional sample is a sample collected across the units of analysis at a single pointin time. Surveys are commonly cross-sectional.
A time series sample is a sample on a process which goes through time. For example, the
presidential approval and policy mood time series graphed earlier are examples of time
series data.
Pooled Cross-Section Time Series data- It is often possible to mix cross-sectional and
time series data. For example, we might have data on expenditures by school districts
from 1980-2008. The unit of analysis in these cases will be the spatial unit at each point
in time. For example, one observation might be BCS1985.
32. Concepts Must Be Precisely Defined
In order for researchers to communicate with one another we must have a commondefinition for our research concepts, or at least know how different researchers have
defined our terms.
What are some of the various ways we might define the following?
Political Development
Political Violence
Political Trust
Political Liberalism