


 industry
Similar presentations:


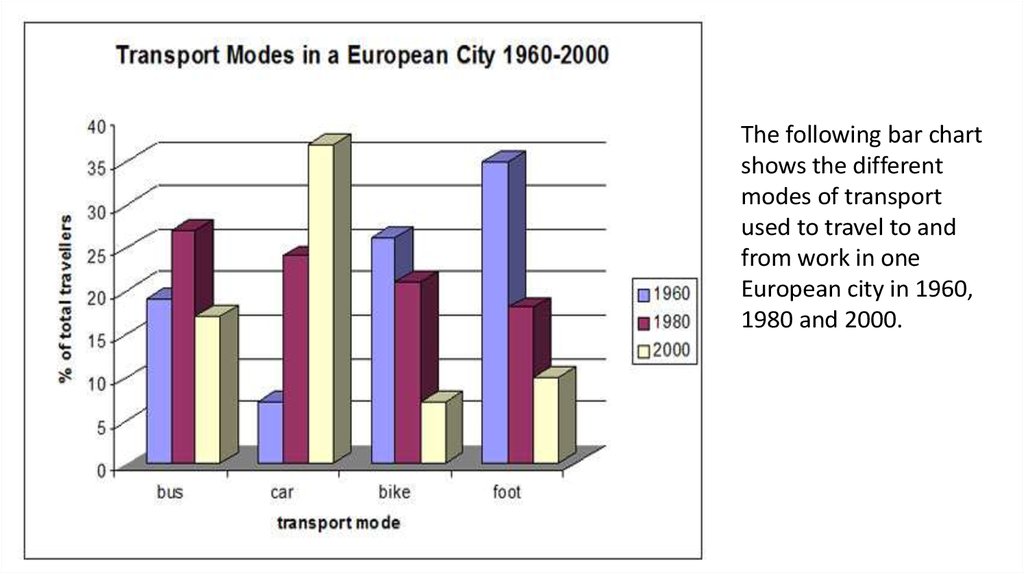
Transport modes in European city in a European city 1960 - 2000
1.
.The following bar chart
shows the different
modes of transport
used to travel to and
from work in one
European city in 1960,
1980 and 2000.
2.
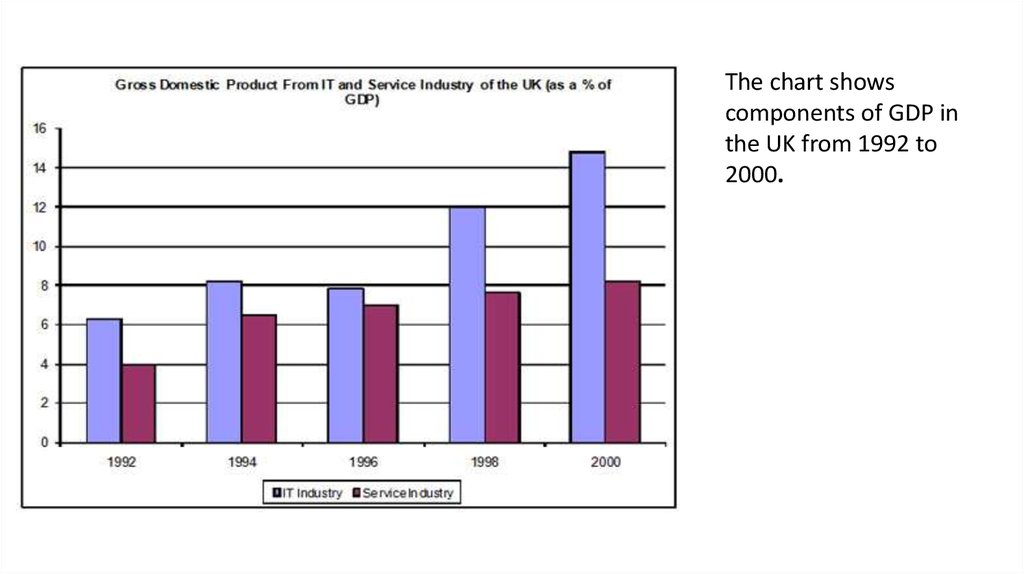
The chart showscomponents of GDP in
the UK from 1992 to
2000.
3.
The pie charts show theelectricity generated in
Germany and France from
all sources and renewables
in the year 2009.
4.
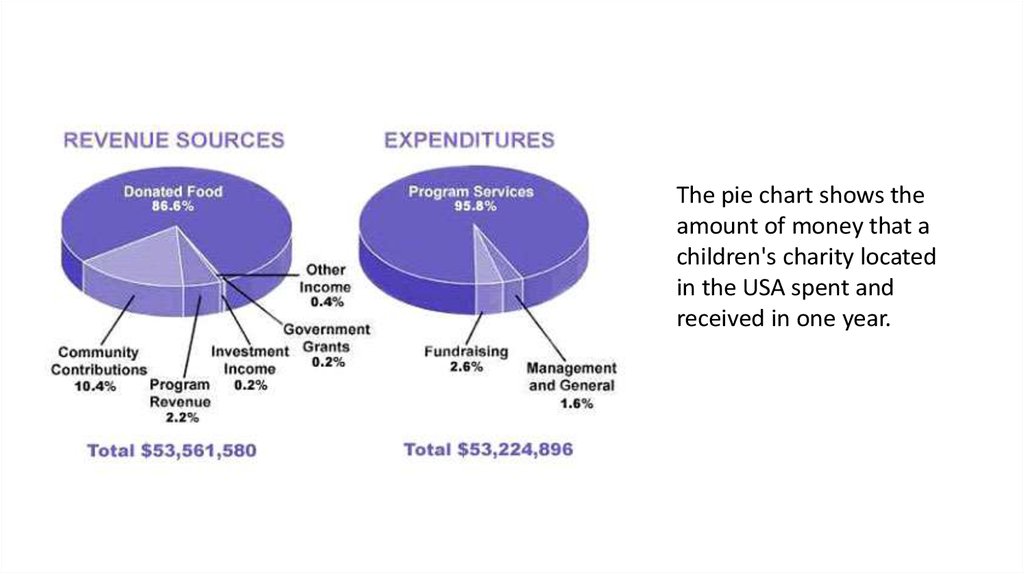
The pie chart shows theamount of money that a
children's charity located
in the USA spent and
received in one year.
5.
The illustrations show howchocolate is produced.
6.
The illustrations show fishcanning process.
7.
The line graph showsthefts per thousand
vehicles in four European
countries between 1990
and 1999.
8.
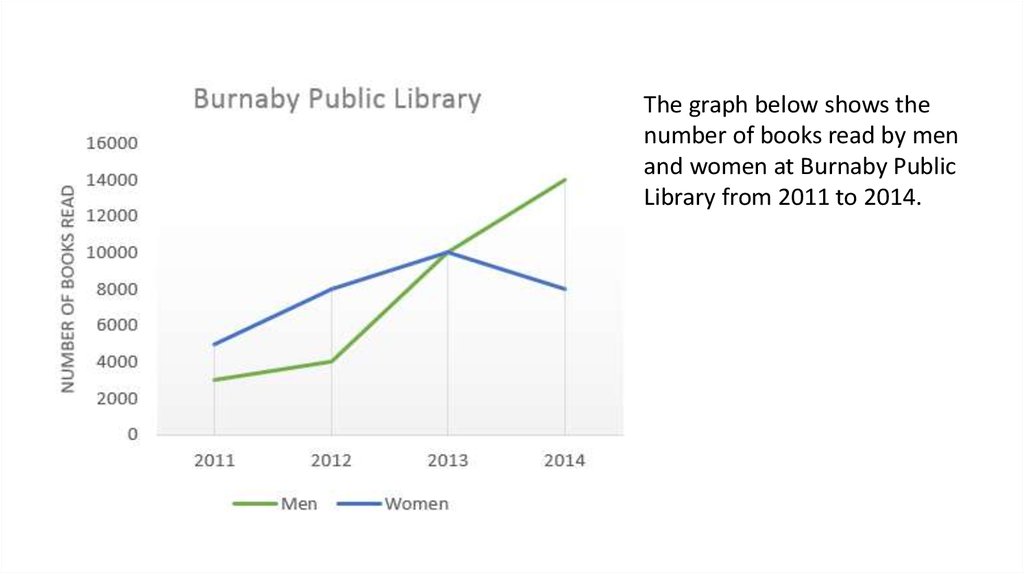
The graph below shows thenumber of books read by men
and women at Burnaby Public
Library from 2011 to 2014.