Similar presentations:
The equity. Implications of taxation. Tax incidence. (Lecture 11-19)
1. The Equity Implications of Taxation: Tax Incidence
b.samojlik 20151
2. The Three Rules of Tax Incidence
I.The Statutory Burden of a Tax Does Not Describe Who Really
Bears the Tax
II. The Side of the Market on Which the Tax Is Imposed Is
Irrelevant to the Distribution of the Tax Burdens
III. Parties with Inelastic Supply or Demand Bear Taxes;
Parties with Elastic Supply or Demand Avoid Them
b.samojlik 2015
2
3. The Statutory Burden of a Tax Does Not Describe Who Really Bears the Tax
• statutory incidence:The burden of a tax borne by the party
that sends tax payment to the tax office.
• economic incidence:
The burden of taxation measured by
the change in the resources available to any economic agent as
a result of taxation.
b.samojlik 2015
3
4. Consumer and producer tax burden
b.samojlik 20154
5. Discription of panels (a) &(b)
Discription of panels (a) &(b)• On the left side (a) there is a pre-tax situation: equilibrium of supply
and demand at the price $1.5 and quantity 100; (the coordinates of
the point A :$1.5;100) .
• On the right side (b) there is tax imposed $0.5per unit (the statutory
burden); supply curve shifts to the left from S1 to S2 and equilibrium
point, intersection of demand curve D and a new supply curve S2 ,
shifts from A to D; the coordinates of the point A changes to
($1.8;90) at the point D.
• The economic tax burden: $0.2 is borne by producers and $0.3 is
borne by consumers.
b.samojlik 2015
5
6. Burden of the Tax on Consumers and Producers
• tax wedge: The difference between what consumers pay andwhat producers receive (net of tax) from a transaction; or
• The difference between what employers are charged and
employees receive (net of tax) from a transaction;
• E.g.: price of gas for producer and consumer due to excise tax,
production tax and VAT ; cost of wages for employers and
employees wage due to social security charges and PIT
b.samojlik 2015
6
7. II.The Side of the Market on Which the Tax Is Imposed Is Irrelevant to the Distribution of the Tax Burdens
• Tax insidence is identical whether the tax is levied on producers orconsumers.
b.samojlik 2015
7
8. Parties with Inelastic Demand Bear Taxes;
b.samojlik 20158
9. Parties with Inelastic Demand Bear Taxes
• Perfectly inelastic demand /demand curve D vertical/ ; increase ofprice due to tax $0,5 per unit; shift of the supply curve to the right;
• Price increases from $1.5 to $2.0;
• Perfectly inelastic demand means that consumers bear the full tax.
• When demand is perfectly inelastic producers bear none of the tax
and consumers bear all of the tax: the full shifting of the tax.
b.samojlik 2015
9
10. Parties with Elastic Demand Avoid Taxes
b.samojlik 201510
11. Parties with Perfectly Elastic Demand Avoid Taxes
•The full burden of tax bears producerbecause of inelastic supply.
•Consumers avoid tax because of elastic
demand.
b.samojlik 2015
11
12. Supply Elasticities
b.samojlik 201512
13. Supply Elasticity
• There is two supply cases. On the left side (a) inelastic supply, curve Salmost vertical.
• On the right side (b) elastic supply, curve S almost horizontal.
• On both services(commodities) the same tax is levied;
• Shift of the supply curve is the greater the higher is elasticity of
supply.
• Reaction of demand due to tax increase /=increase of price/ on panel
(a) is minor on panel (b) very strong.
b.samojlik 2015
13
14. Parties with Inelastic Supply Bear Taxes;
• Inelastic supply/demand/ party of the transaction bears tax increase.• Absorption of the tax increase is inversely proportional to the
elasticity of supply/demand/, the higher elasticity of supply/demand/
the lower absorption of tax increase, and reverse.
b.samojlik 2015
14
15. Recap:
The statutory burden of a tax does not describe who really bears the tax.The side of the market on which the tax is imposed is irrelevant to the
distribution of tax burdens.
Parties with inelastic supply or demand bear taxes; parties with elastic supply or
demand avoid them.
b.samojlik 2015
15
16. Tax Inefficiencies and Optimal Taxation
b.samojlik 201516
17. Optimal income and commodity taxation
• 1 Optimal Income Taxes• 2 Optimal Commodity Taxation
• 3 Conclusions
b.samojlik 2015
17
18. Max-min rule as a standard of rational behavior
Rationale behavior : max and min rules
A.Maximize results out of the given resources: max rule or
B.Minimize the costs of the predetermined goal:min rule
In the case of taxation we should apply „min”rule
We should know how much revenue to collect in order to finance projects/ bridges,
roads, hospitals, schools etc. etc./
Taxation provides revenues for budget expenditure
At the same time we know that :every tax is inefficient: distorts the behavior of
producers and consumers/ creates a deadweight loss/
So, taxation should minimize the loss of consumers and producers surplus achieving
predetermined level of tax revenues
The levels of harmfulness of specific taxes are different; there is a room for optimization
of tax structure
b.samojlik 2015
18
19. Economic function of taxes
• Which factor of the GDP creation a given tax charges? /implicit taxrates=total tax to tax base/
• labor /social security charges and personal income tax /PIT/
• consumption/VAT, sales tax, production tax, exise taxes /
• capital/dividend taxation, interest taxation ( no tax costs)/
• green taxes /GDP demolition due to externalities/
b.samojlik 2015
19
20. Type of taxes
• Direct taxes / on income; PIT, CIT/• Indirect taxes / indirect taxes of income; VAT excise taxes/
• Social security charges /taxes on labor costs/
• Green taxes/diminishing natural resources use/
• Taxes on financial transactions/ The European Commission idea to
have own resources of the EU budget / 3/4 to budget of the UE ¼ to
national budget/
• Tax shifting / forward and backward/ : who finally pay for it/charged
as a result od green taxes and financial transaction taxes?
b.samojlik 2015
20
21. Optimal taxation of income
b.samojlik 201521
22. The importance of the PIT revenues in the EU/% of total tax revenues/
b.samojlik 201522
23. Taxation of income in the UE
• There is no common acceptable rule of taxing income in the UE 28countries
• SK, BG, RO effective tax rate on income 10%; DK effective tax rate on
income 50% /as a pp of the total taxation/
b.samojlik 2015
23
24. Flat tax in the EU
Tab.nr 5 Flat tax ratesBG
10%
LT
15%
CZ
15%
Hu
16%
RO
16%
SK
19%
EE
21%
LV
23%
b.samojlik 2015
24
25. Flat tax rate in the EU
25%23%
23%
FLAT TAX RATES IN THE EU
21%
21%
19%
19%
17%
15%
15%
LT
Y
16%
16%
RO
HU
15%
13%
11%
10%
9%
7%
5%
BG
b.samojlik 2015
SK
EE
LV
25
26. Other countries with a flat tax
• Russia 13%; Serbia-14%; Kirgistan-10%; Georgia-12%; Ukraina-13% ;• according to the IMF:
• “the empirical evidence on flat taxes effects is very limited" ;
• "there is no sign of Laffer-type behavioral responses." / increase of
tax revenues due to decrease of effective tax rate/
b.samojlik 2015
26
27. Laffer curve
b.samojlik 201527
28. The interpretation of Laffer curve
• If the effective tax rate on income is not to high, tax revenuesincreases but pace of increase is diminishing ; (correct side);
• higher effective tax rates on the wrong side decrease the volume of
tax revenues
• Optimal level of the effective tax rate is unknown/ max of revenues is
unknown/
b.samojlik 2015
28
29. "there is no sign of Laffer-type behavioral responses."
"there is no sign of Laffer-type behavioral responses."• Interpretation:
• If a flat tax have a Laffer-type behavior than decrease of effective tax
rate on a wrong side would increase tax revenues; there is no
evidence of such behavior of taxpayers
b.samojlik 2015
29
30. Flat tax rate
• Flat tax rates on income are not in accordance with optimal taxationof income
• Flat tax rates of personal income are not in accordance with fairness
of taxation
b.samojlik 2015
30
31. CZ/ effective flat tax rate/
16%15%
14%
Efective flat tax rate
13%
12%
11%
10%
0
5000
10000
15000
b.samojlik 2015
20000
25000
31
32. effective flat tax rate
• effective flat tax rate with no general allowance means that nominaland effective tax rates are the same for all taxable income brackets;
flat tax is not a fair taxation of income
b.samojlik 2015
32
33. Flat income tax
Loss of utilityLow income
Flat tax 15%
Average income
High income
Effective tax rate
b.samojlik 2015
33
34. Flat income tax
• At the flat tax rate effective taxation rate is the same for all incomebrackets;
• Low income groups have a large loss of utility
• High income groups have a smaller loss of utility
• Flat tax system is unfair
b.samojlik 2015
34
35. Effective tax rate/ETR/
• taxes paid/income• F.e.:
• income= 60 000
• nominal tax rates:
1. 0-5000= 0%=tax=0
2. 5001-10 000= 10%=tax=(10000-5001)*0,1=tax=499,9
3. 10 001-20 000= 20%=(20000-10001)*0,2=tax=1999,8
4. 20 001-40 000= 30%=(40000-20001)*0,3=tax= 5999,7
5. 40 001-70 000= 35%=tax=(60000-40001)*0,35=tax=6999,65
Sum of taxies=0+499,9+1999,8+5999,7+6999,65= 15499,05
Effective tax rate /ETR/=15499,05/60000=0,2583= 25,83%
b.samojlik 2015
35
36. Progressive income tax
Lossof
utility
Low income
average income
The same loss of U for all income
groups
High income
Effective tax rate
25%
15%
b.samojlik 2015
35%
36
37. Progressive income tax
• In the case of progressive income tax marginal tax rates increase withthe increase of taxable income
• Effective increase of taxation depends on the value of the income
brackets and the value of marginal rate
• The more brackets the greater level of taxation fairness ; the loss of
utility the same for all income brackets
b.samojlik 2015
37
38. Efficiency of public sector
Lossof
utility
Low income
average income
High income
Effective tax rate
25%
15%
b.samojlik 2015
35%
38
39. Efficiency of public sector use of tax revenues
•What is an appropriate level of effectivetaxation?
•The higher the efficiency of the use of
tax revenues the higher acceptable
effective taxation in every taxable
income bracket /tax burden/.
b.samojlik 2015
39
40. Structure of PIT in the EU
.1
2
3
4
5
6
7
8
9
10
11
12
13
14
15
16
17
18
19
20
21
22
23
24
25
26
27
countryl
BG
LT
CZ
RO
SK
EE
LV
UK
PL
DK
HU
SI
SE
AT
EL
CY
MT
DE
NL
FI
ES
IR
BE
FR
IT
PT
LU
No of
nominal
rates
1
1
1
1
1
1
1
3
2
2
1
3
3
3
7
4
3
3
4
4
4
2
5
5
5
7
16
min
max
rate
rate
Max rate income
General allowance €
10%
10%
0
15%
15%
0
15%
15%
0
16%
16%
0
19%
19%
1676
21%
21%
1726
23%
23%
1726
20%
50%
£150000
£8100
18%
32%
20800
690
45,26%
16%
16%
31,52%
36,50%
10%
20%
15%
5,50%
33,6%
25,59%
15,66%
20%
25%
5,5%
23%
14,50%
8%
59%
16%
41%
56,52%
50%
50%
35%
35%
50,50%
52%
49,09%
27,13%
41%
50%
45%
43%
48%
38%
b.samojlik 2015
52000
20000
51300
60000
100000
60000
28700
250400
55000
64500
53400
32800
33000
250000
75000
80000
40000
5762
0
5113
1270
11000
10000
19500
8500
7834
6167
13160
5151
1650
6400
5614
8000
0
3750
40
41. PIT in the EU countries
• PIT in the EU28 is extremely diversified:• Different levels of the general allowance
• Different numbers of taxable income brackets
• different marginal tax rates
• Different effective taxation for a given total income
• Different personal allowances/ because of age of the taxpayer ,
number of children in the family , disability etc. etc./
b.samojlik 2015
41
42. Effective tax rate due to general allowance
b.samojlik 201542
43. The importance od sizable general allowance
• General allowance could change an effective tax rate considerably:• Example: general allowance 19500 €/CY/
• First bracket above general allowance level 19500 up to 400000€
,marginal rate 20%
• Effective rate for the yearly taxable income 35000€ / total income
45000€/:
• =(35000-19500)*0,2=3100€
• Effective tax rate =3100/45000=6,9%
b.samojlik 2015
43
44. LU income tax structure
b.samojlik 201544
45. Taxation of income in increasing brackets/1908€/ in LU
800725,04
700
600
500
457,92
400
300
200
190,8
100
0
1
2
3
4
5
6
7
8
b.samojlik 2015
9
10
11
12
13
14
15
45
46. LU taxation of income
• LU taxation of income is a perfect fit to optimal taxation of income• The slower loss of utility of income of the higher income groups/
higher brackets / is matched by increase of marginal nominal rate
2pp for every 1908€ increase of taxable income
• Very similar taxation of the personal income there is in the us, Japan.
China, Germany, France, Great Britain, Italy, Spain, Portugal, Greece.
• Only less developed countries have a taxation schemes flat type.
b.samojlik 2015
46
47. Effective taxation of income in PL and LU /comparison/
20,00%18,00%
17,40%
17,20%
16,70%
15,50%
16,00%
17,30%
17%
16,30%
17,40%
14,00%
13%
12,00%
8,80%
10,00%
7,46%
6,94%
8,00%
7,90%
5,89%
PL
LU
8,02%
6,00%
7,15%
6,59%
4,00%
9,22%
3,77%
2,00%
0,00%
0%
1000
3000
5000
7000
9000
11000
13000
b.samojlik 2015
15000
17000
19000
21000
47
48. Effective taxation of income in PL and LU /comparison/
• As we see nominal marginal rates matters very much;• because of the very low marginal rates in the low income brackets ,
effective taxation of income in the LU is considerable lower than in
Poland at least to taxable income 21000€, more than 95% of
taxpayers in Poland.
b.samojlik 2015
48
49. Effective taxation of income on the level of PPS per capita
1/CY2/MT
3/JP
3/BG
4/FR
5/EL
6/ES
7/DE
8/UK
9/CZ
3,6%
5,7%
8,3%
10,0%
10,5%
12,4%
14,0%
14,3%
14,9%
15,0%
10/LT
11/RO
12/FI
13/PL
14/US
15/SK
16/PT
17/IR
18/EE
19/LV
15,0%
16,0%
16,7%
17,1%
17,1%
19,0%
19,5%
21,0%
21,0%
23,0%
20/IT
21/AT
22/LU
23/SI
24/HU
25/SE
26/BE
27/NL
28/DK
24,6%
24,8%
25,3%
26,1%
28,1%
30,2%
31,3%
31,4%
33,6%
b.samojlik 2015
49
50. Taxation of the PPS per capita income
• There is a deep differentiation of taxation of the per capitaincome/PPS/ from 3,6% in CY to 33,6% in DK.
• Level of PPS per capita for 7 countries : AT, SE, DK, UK, DE, FI i BE is
comparable: bracket 31000-29000 PPS per capita but taxation differs
very much : from 14,5% in DE to 33,6% in DK.
• PPS per capita in the USA =38700PPS in Poland= 14400PPS. Effective
taxation in US and Poland is the same:17,1%.
• In the US there is a strong tax preference for low income groups in
Poland such a preference does not exists.
b.samojlik 2015
50
51. Taxation of the min wages
1/EL2/MT
3/SI
4/FR
5/ES
6/UK
7/USA
8/BG
9/SK
10/EE
0%
0%
4%
6%
6%
8%
8%
10%
10%
10%
11/LV
12/PT
13/PL
14/LT
15/CZ
16/RO
17/HU
18/NL
19/IR
20/BE
11%
11%
14%
15%
15%
16%
16%
21%
21%
24%
b.samojlik 2015
51
52. Effective taxation of average wages
1/MT2/CY
3/IT
4/EL
5/BG
6/FR
7/CZ
8/LT
9/DE
0,9%
2,8%
9,5%
10,0%
10,0%
14,3%
15,0%
15,0%
16,0%
10/RO
11/PL
12/LV
13/UK
14/PT
15/SK
16/FI
17/LU
18/EE
16,0%
16,0%
17,7%
18,1%
18,4%
19,0%
20,8%
20,8%
21,0%
19/ES
20/HU
21/IR
22/SI
23/AT
24/SE
25/NL
26/BE
27/DK
21,5%
22,4%
23,5%
26,2%
28,3%
30,4%
33,2%
36,8%
37,0%
b.samojlik 2015
52
53. Effective income tax rates in CH, JP and USA
40,0%35,0%
30,0%
25,0%
20,0%
CH
JP
USA
15,0%
10,0%
5,0%
0,0%
0
20000
40000
60000
80000
100000
120000
140000
160000
-5,0%
b.samojlik 2015
53
54. Structure of nominal rates in the USA/income in€/
b.samojlik 201554
55. Structure of nominal rates in JP/income in €/
b.samojlik 201555
56. Structure of nominal rates in CH /income in€/
b.samojlik 201556
57. Optimal taxation of goods and services
b.samojlik 201557
58. Ramsey Taxation: The Theory of Optimal Commodity Taxation
• Ramsey Rule: To minimize the deadweight loss of a taxsystem while raising a fixed amount of revenue, taxes should be
set across commodities so that the ratio of the marginal
deadweight loss to marginal revenue raised is equal across
commodities.
b.samojlik 2015
58
59. The marginal deadweight loss to marginal revenue raised not equal across commodities.
• MDWL1/MR1> MDWL2/MR2> MDWL3/MR3>MDWL4/MR4>…… MDWLn/MRn
When relation of the deadweight loss due to taxation would be
different than decreasing taxation of n-th good or service , decreasing
of taxation of n-1 good or service and increase of the tax rate on good
number 1 , good number two and so forth would reduce the
deadweight loss, reduction of the deadweight loss / due to reduced
tax rates /would be grater than increase of deadweight loss due to
increased tax rates./
b.samojlik 2015
59
60. Inverse Elasticity Rule
• If we assume that the supply side of commodity markets is perfectlycompetitive (elasticity of supply is infinite), then the Ramsey rule
implies that:
• That means: tax rate on good or service should be set inversely to its
elasticity of demand ηi;
• The higher ηi the lower tax; the lower ηi the higher tax.
b.samojlik 2015
60
61. Optimal commodity taxes
• The elasticity rule: When elasticity of demand for a good is high, it should betaxed at a low rate;
• when elasticity is low, the tax rate should be high.
• The broad base rule: It is better to tax a wide variety of goods at a moderate rate
than to tax very few goods at a high rate.
• Because the marginal deadweight loss from a tax rises with the tax rate, the
government should spread taxes across a large number of commodities and not
tax any one commodity at a very high rate.
b.samojlik 2015
61
62. Equity Implications of the Ramsey Rule
• The elasticity of demand for luxury goods is much higher than that for basicconsumption goods, so the inverse elasticity rule would suggest that the
government tax basic consumption goods much more highly than luxury goods.
• This would mean imposing a tax on a good consumed exclusively by higherincome groups that was much lower than the tax imposed on a good consumed
by all.
This outcome, while efficient, might violate a government’s sense of tax fairness
across income groups (vertical equity) and requires a trade off beetwen fairness
and efficiency of commodity and service taxation .
b.samojlik 2015
62
63. The loss of utility due to taxation of commodity
b.samojlik 201563
64. The loss of utility due to taxation
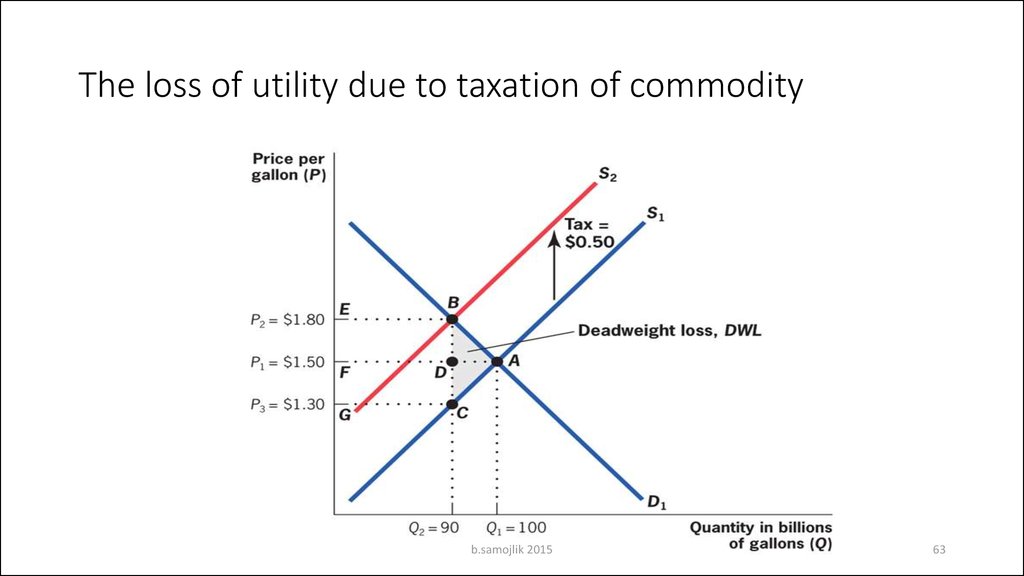
• When a tax $0,5 is imposed the supply curve shifts from S1 to S2 anda deadweight loss ABC occurs / for Q1-Q2 social marginal benefits are
lower than social marginal costs /
b.samojlik 2015
64
65. Deadweight loss due to taxation is a function of the elasticity of demand
b.samojlik 201565
66. Deadweight loss due to taxation is a function of the elasticity of demand
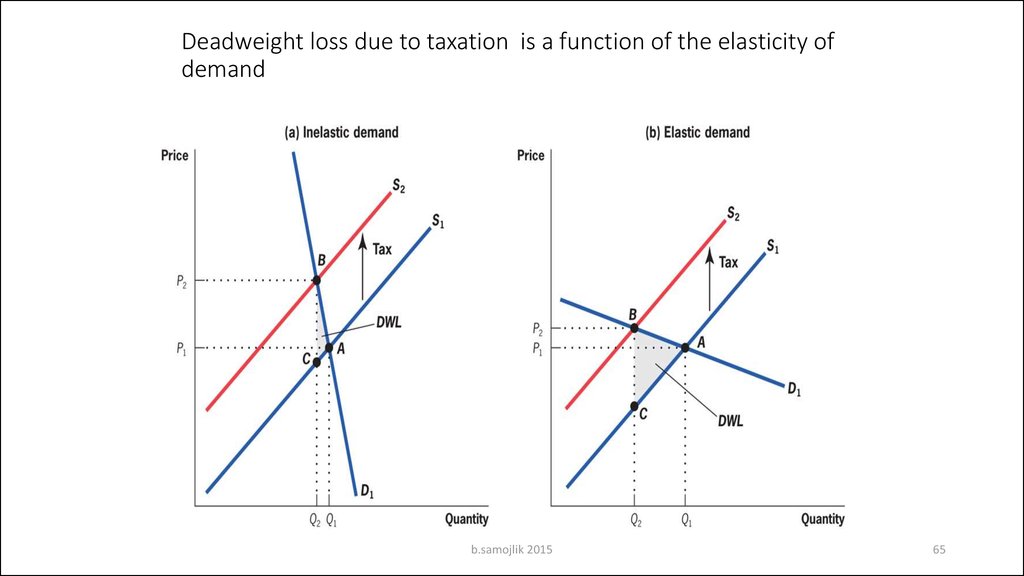
• The same tax is imposed on a commodity with elastic and inelasticdemand; the shift od supply curve is the same ;
• The deadweight loss increases with the increase of the elasticity of
demand
b.samojlik 2015
66
67. The nature of the deadweight loss
• The inefficiency of any tax is determined by the extent to whichconsumers and producers change their behavior to avoid the tax;
deadweight loss is caused by individuals and firms making inefficient
consumption and production choices in order to avoid taxation.
b.samojlik 2015
67
68. The level of tax and the deadweight loss
b.samojlik 201568
69. The level of tax and the deadweight loss
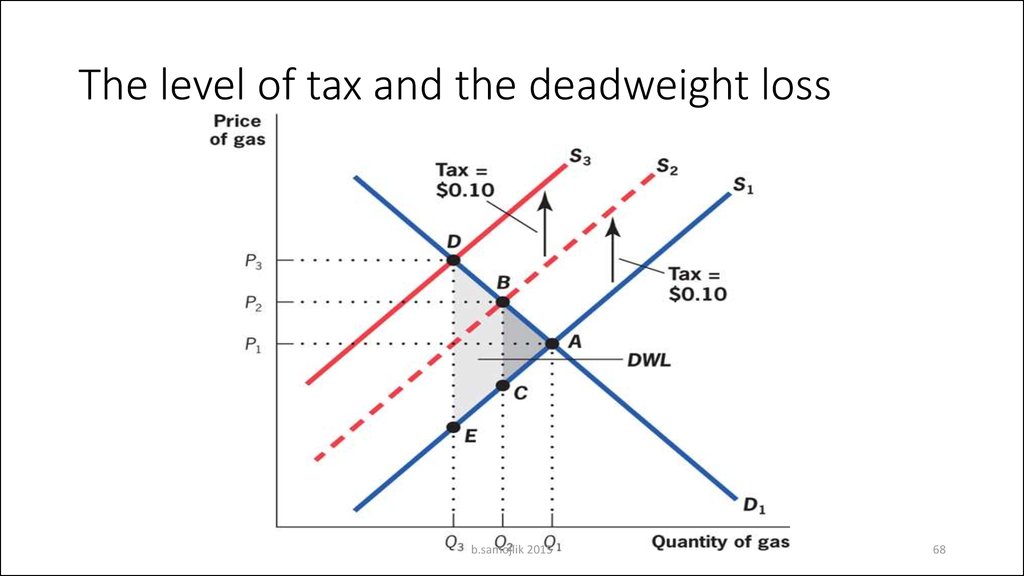
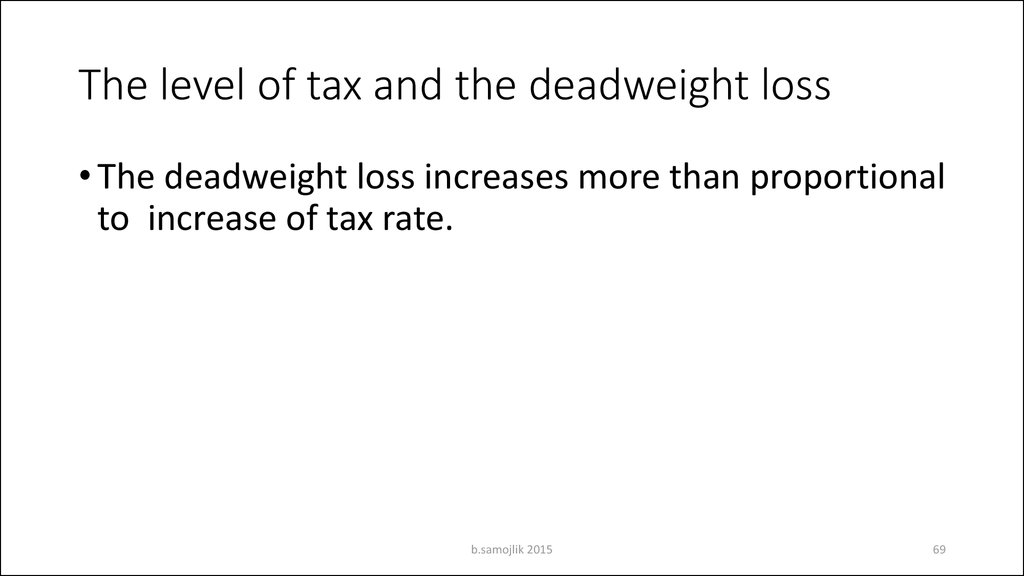
• The deadweight loss increases more than proportionalto increase of tax rate.
b.samojlik 2015
69
70. Conclusion
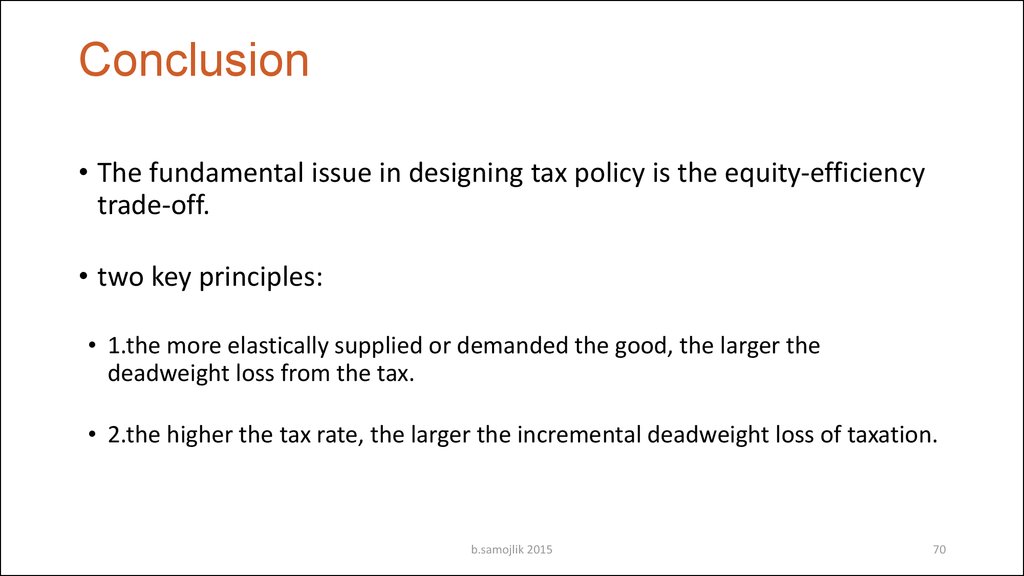
• The fundamental issue in designing tax policy is the equity-efficiencytrade-off.
• two key principles:
• 1.the more elastically supplied or demanded the good, the larger the
deadweight loss from the tax.
• 2.the higher the tax rate, the larger the incremental deadweight loss of taxation.
b.samojlik 2015
70
71. The EU VAT concept and the Ramsey rule
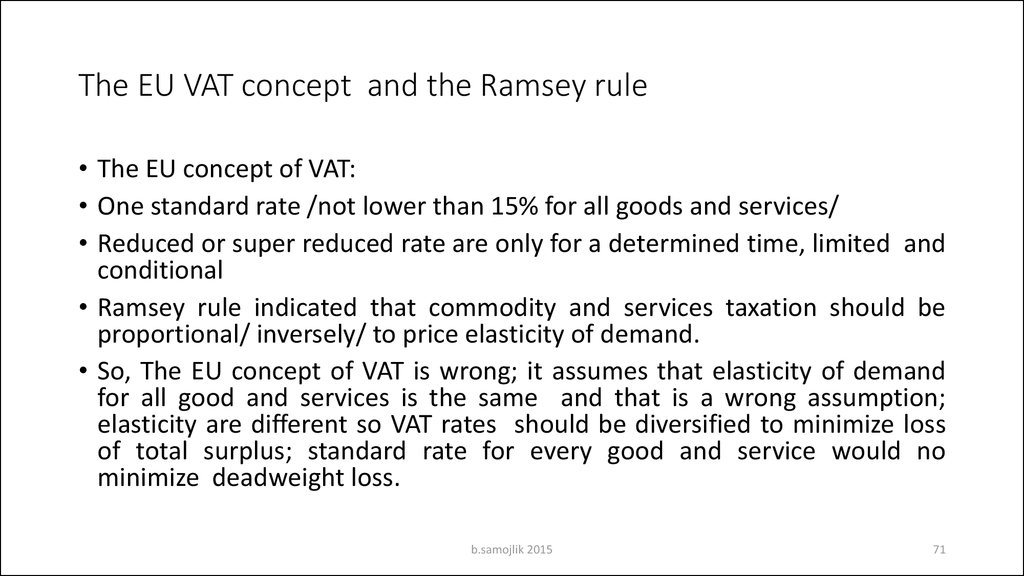
• The EU concept of VAT:• One standard rate /not lower than 15% for all goods and services/
• Reduced or super reduced rate are only for a determined time, limited and
conditional
• Ramsey rule indicated that commodity and services taxation should be
proportional/ inversely/ to price elasticity of demand.
• So, The EU concept of VAT is wrong; it assumes that elasticity of demand
for all good and services is the same and that is a wrong assumption;
elasticity are different so VAT rates should be diversified to minimize loss
of total surplus; standard rate for every good and service would no
minimize deadweight loss.
b.samojlik 2015
71
72. Quality of taxation
• Taxation structure from growth perspective• Decrease taxation of labor, increase taxation of consumption and
green taxes and decrease taxation of labor
b.samojlik 2015
72





 finance
 english


