


 biology
Similar presentations:


Formation of the two-layered blastoderm of the chick embryo
1.
Формирование гипобласта2.
Stage XIIIStage XIV
Stage 2 (HH)
3.
Формирование двухслойной бластодермы у куриных зародышейFigure 11.9. Formation of the two-layered
blastoderm of the chick embryo.
(A, B) Primary hypoblast cells delaminate
individually to form islands of cells
beneath the epiblast.
(C) Secondary hypoblast cells from the
posterior margin (Koller's sickle and the
posterior marginal cells behind it) migrate
beneath the epiblast and incorporate the
polyinvagination islands. As the hypoblast
moves anteriorly, epiblast cells collect at
the region anterior to Koller's sickle to
form the primitive streak.
(D) This sagittal section of an embryo
near the posterior margin shows an upper
layer consisting of a central epiblast that
trails into the cells of Koller's sickle (ks)
and the posterior marginal zone (mz).
Certain cells have delaminated from the
epiblast (ep) to form polyinvagination
islands (pi) of 5 to 20 cells each. These
cells will be joined by those hypoblast
cells (hyp) migrating anteriorly from
Koller's sickle to form the lower
(secondary hypoblastic) layer. (sc,
subgerminal cavity; gwm, germ wall
margin.) (From Eyal-Giladi et al. 1992,
photograph courtesy of H. Eyal-Giladi.)
4.
Fig. 1. a: SEM of the ventral surface of a stage XI/XII chick embryo. Area opaca (AO); area pellucida(AP).Scale bar 5 400 mm.
b: enlargement of the central part of a showing a non-epithelialized hypoblast layer (H)
consisting of numerous rounded cells. Arrows point to gaps in the epiblast layer (E), through which
the hypoblast cells (H) are polyingressing. Scale bar 5 40 mm.
5.
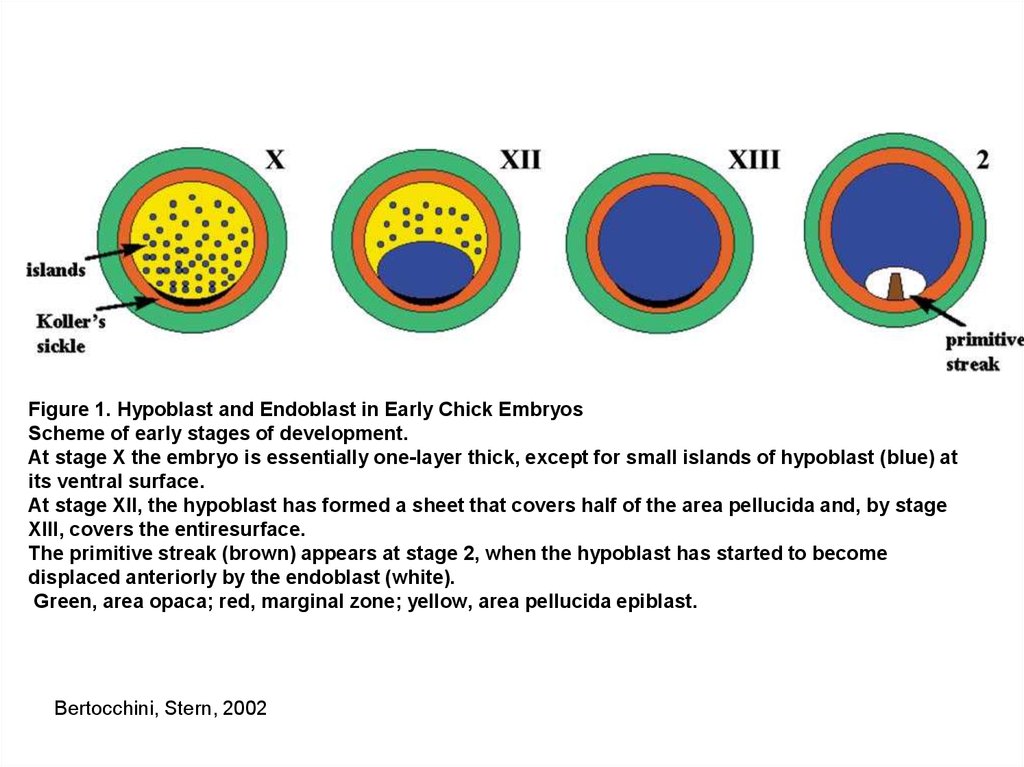
Figure 1. Hypoblast and Endoblast in Early Chick EmbryosScheme of early stages of development.
At stage X the embryo is essentially one-layer thick, except for small islands of hypoblast (blue) at
its ventral surface.
At stage XII, the hypoblast has formed a sheet that covers half of the area pellucida and, by stage
XIII, covers the entiresurface.
The primitive streak (brown) appears at stage 2, when the hypoblast has started to become
displaced anteriorly by the endoblast (white).
Green, area opaca; red, marginal zone; yellow, area pellucida epiblast.
Bertocchini, Stern, 2002
6.
7.
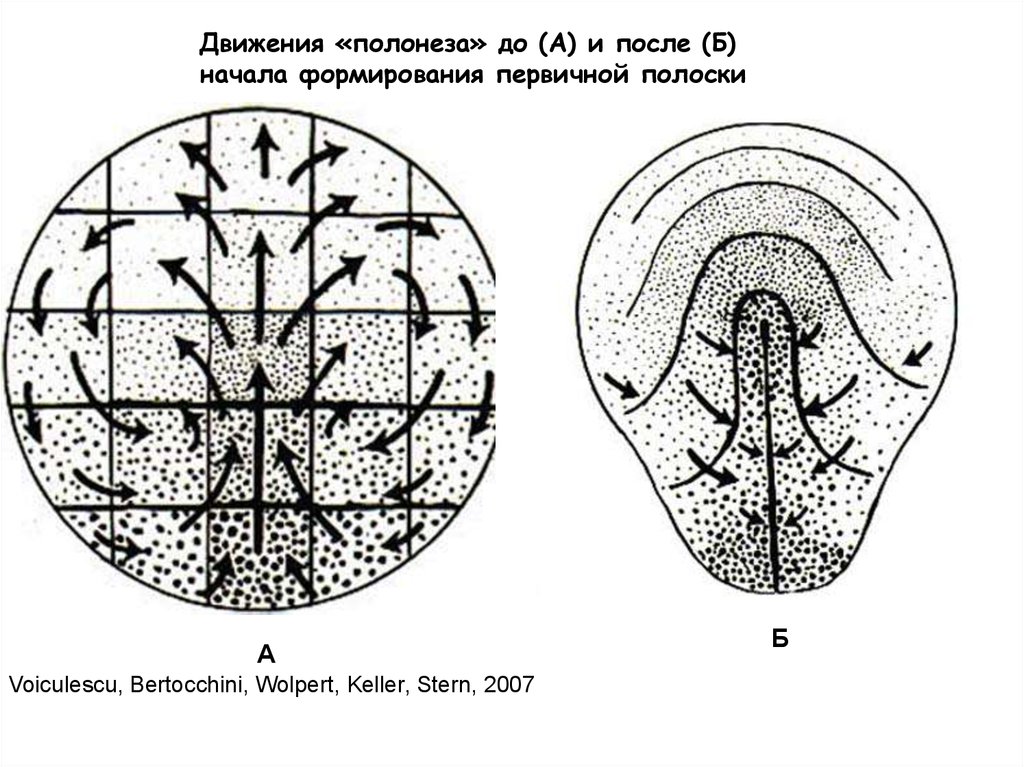
Движения «полонеза» до (А) и после (Б)начала формирования первичной полоски
А
Voiculescu, Bertocchini, Wolpert, Keller, Stern, 2007
Б
8.
9.
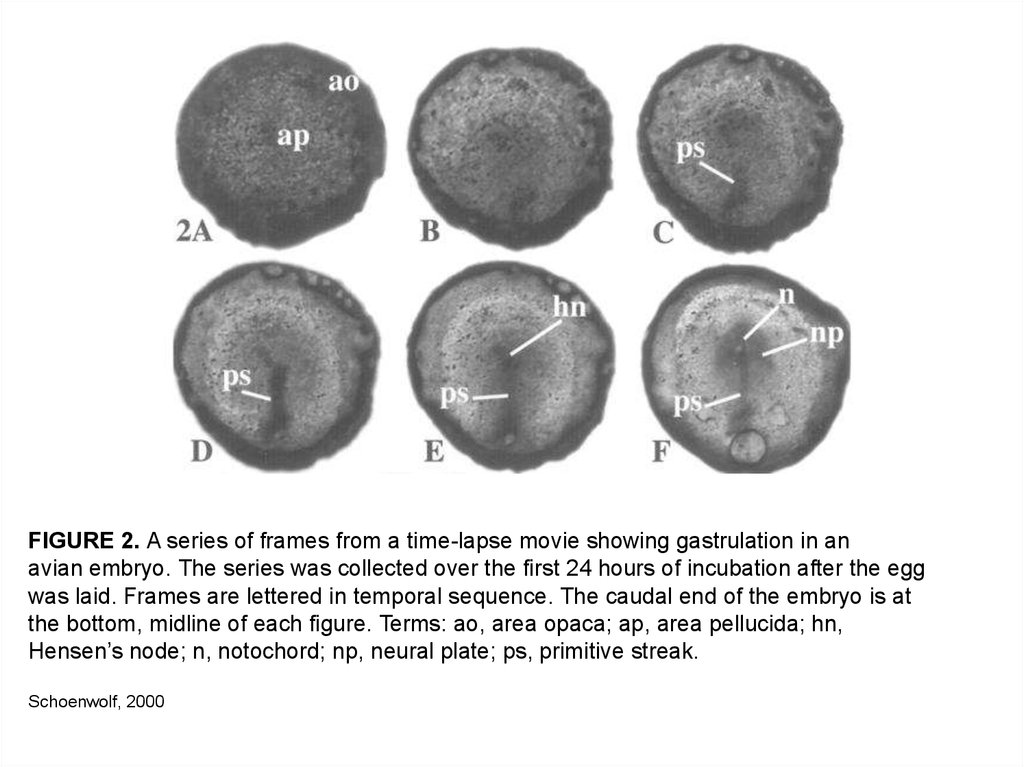
FIGURE 2. A series of frames from a time-lapse movie showing gastrulation in anavian embryo. The series was collected over the first 24 hours of incubation after the egg
was laid. Frames are lettered in temporal sequence. The caudal end of the embryo is at
the bottom, midline of each figure. Terms: ao, area opaca; ap, area pellucida; hn,
Hensen’s node; n, notochord; np, neural plate; ps, primitive streak.
Schoenwolf, 2000
10.
12-13 ч18-19 ч
Prof. Judy CebraThomas, Swarthmore College
19-22 ч
23-24 ч
11.
ПП появляется на ст. 2 в задней трети area pellucida в виде образованиятреугольной формы.
Изменение ПП состоит из трех главных компонентов:
- прогрессия или быстрое удлинение ПП вдоль переднезадней оси (макс длина
1,8 мм на ст. 4);
-параллельно с удлинением начинается и происходит ингрессия
презумптивных клеток энтодермы и мезодермы через ПП;
- регрессия или постепенное укорочение и окончательное преобразование
остатков ПП в почку хвоста.
12.
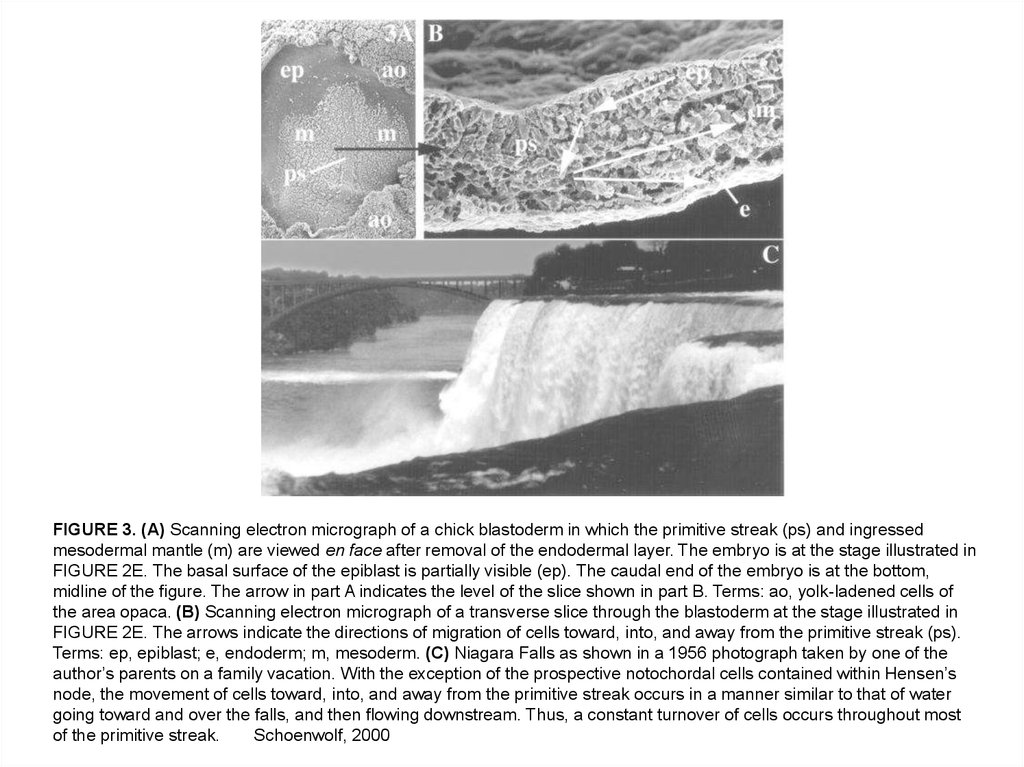
FIGURE 3. (A) Scanning electron micrograph of a chick blastoderm in which the primitive streak (ps) and ingressedmesodermal mantle (m) are viewed en face after removal of the endodermal layer. The embryo is at the stage illustrated in
FIGURE 2E. The basal surface of the epiblast is partially visible (ep). The caudal end of the embryo is at the bottom,
midline of the figure. The arrow in part A indicates the level of the slice shown in part B. Terms: ao, yolk-ladened cells of
the area opaca. (B) Scanning electron micrograph of a transverse slice through the blastoderm at the stage illustrated in
FIGURE 2E. The arrows indicate the directions of migration of cells toward, into, and away from the primitive streak (ps).
Terms: ep, epiblast; e, endoderm; m, mesoderm. (C) Niagara Falls as shown in a 1956 photograph taken by one of the
author’s parents on a family vacation. With the exception of the prospective notochordal cells contained within Hensen’s
node, the movement of cells toward, into, and away from the primitive streak occurs in a manner similar to that of water
going toward and over the falls, and then flowing downstream. Thus, a constant turnover of cells occurs throughout most
of the primitive streak.
Schoenwolf, 2000
13.
14.
Figure 1.(A) General structures of pre-gastrulation stage chick
embryo.
(B) Brachyury gene expression in and surround the
primitive streak at HH4.
(C) General organization of three germ layers (cartoon
drawn after Bellairs3) and morphogenetic movement
of gastrulation EMT at stage HH3–4.
(D) Cellular events leading to EMT.
Nakaya, Sheng, 2009
15.
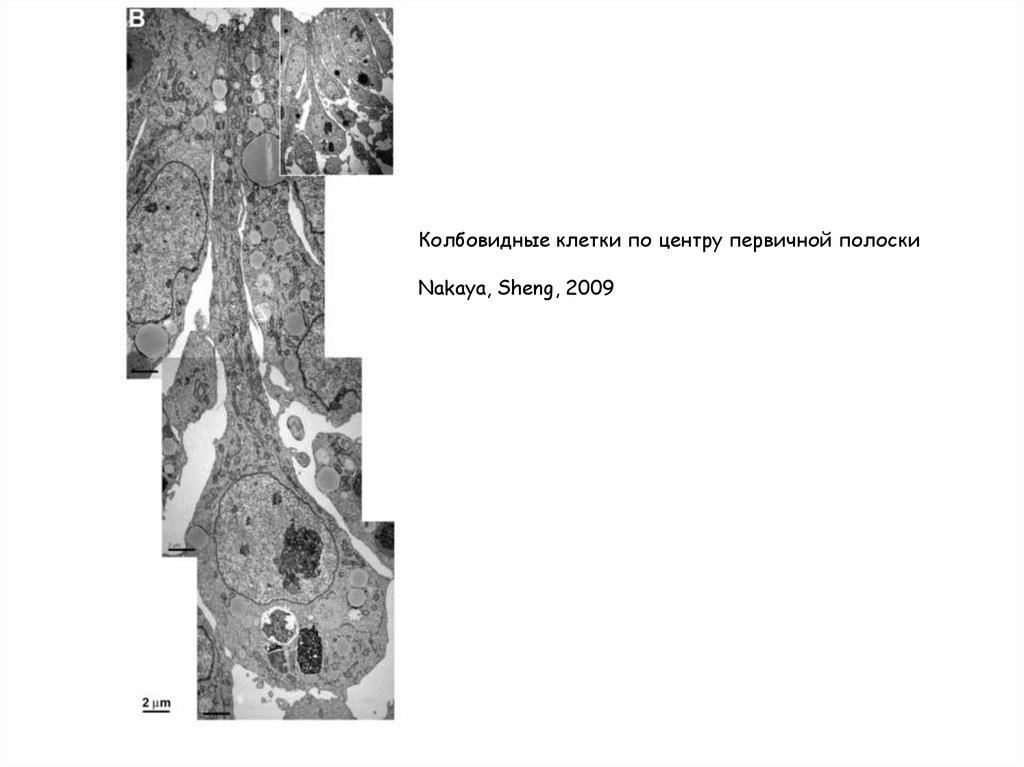
Колбовидные клетки по центру первичной полоскиNakaya, Sheng, 2009
16.
Figure 1Cellular aspects of EMT. (i) Normal epithelial cells contain adherens junctions composed of E-cadherin together with catenins and
actin rings. Tight junctions are associated with apical polarity complexes, while integrins interact with components of the basal
membrane. (ii) Loss of cell-cell adhesion. EMT inducers repress the transcription of the genes encoding the components of both
adherens and tight junctions, inducing the loss of cell polarity. E-cadherin is internalized and targeted for degradation. (iii)
Breakdown of the basal membrane and apical constriction. Profound cytoskeletal remodeling will favor cell delamination by
inducing apical constriction and disorganization of the basal membrane. (iv) Cell delamination and invasion. Expression of integrin
receptors and continued activation of metalloproteases favors migration through the extracellular matrix and invasion of adjacent
tissues.
Acloque et al., 2009
17.
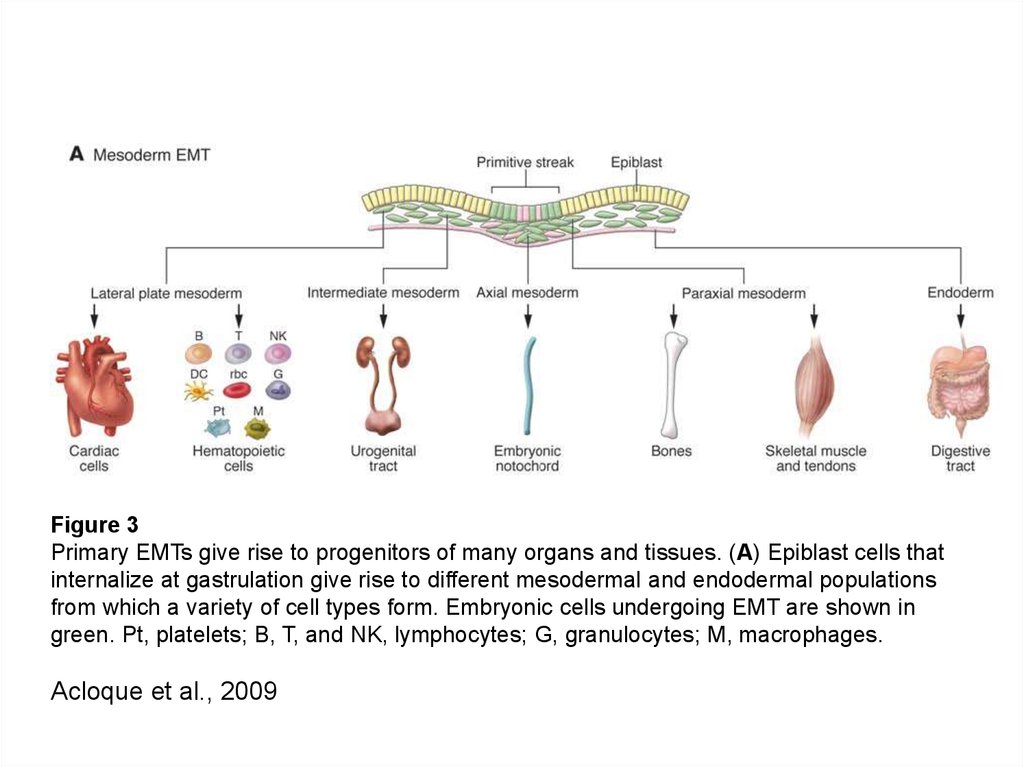
Figure 3Primary EMTs give rise to progenitors of many organs and tissues. (A) Epiblast cells that
internalize at gastrulation give rise to different mesodermal and endodermal populations
from which a variety of cell types form. Embryonic cells undergoing EMT are shown in
green. Pt, platelets; B, T, and NK, lymphocytes; G, granulocytes; M, macrophages.
Acloque et al., 2009
18.
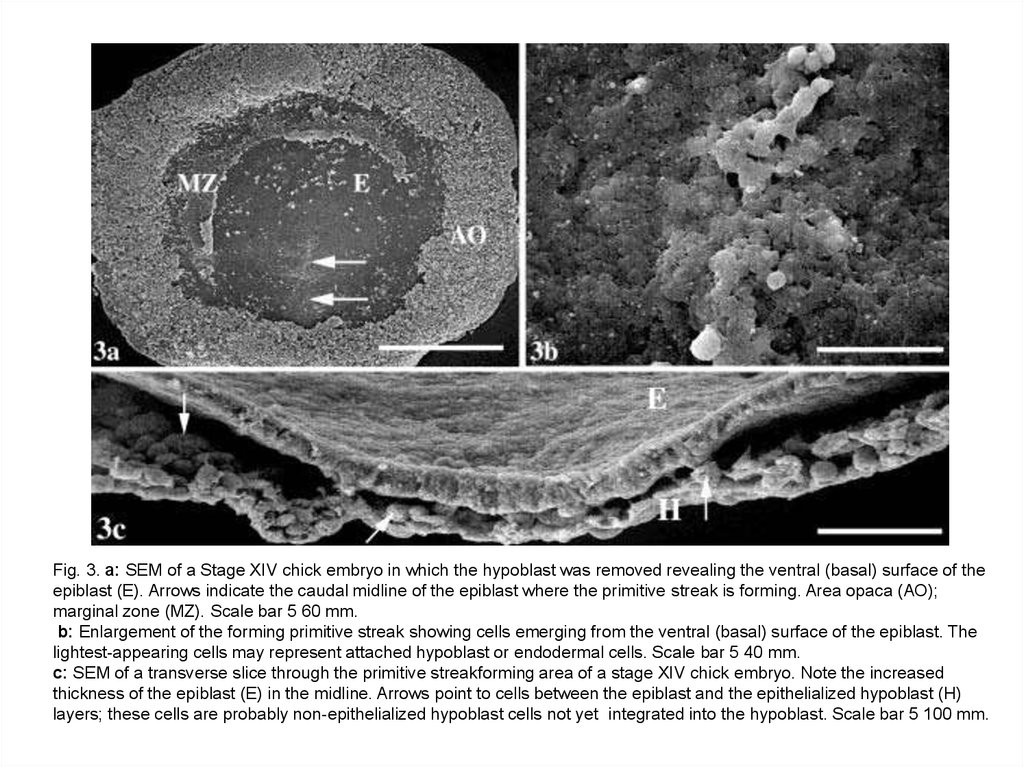
Fig. 3. a: SEM of a Stage XIV chick embryo in which the hypoblast was removed revealing the ventral (basal) surface of theepiblast (E). Arrows indicate the caudal midline of the epiblast where the primitive streak is forming. Area opaca (AO);
marginal zone (MZ). Scale bar 5 60 mm.
b: Enlargement of the forming primitive streak showing cells emerging from the ventral (basal) surface of the epiblast. The
lightest-appearing cells may represent attached hypoblast or endodermal cells. Scale bar 5 40 mm.
c: SEM of a transverse slice through the primitive streakforming area of a stage XIV chick embryo. Note the increased
thickness of the epiblast (E) in the midline. Arrows point to cells between the epiblast and the epithelialized hypoblast (H)
layers; these cells are probably non-epithelialized hypoblast cells not yet integrated into the hypoblast. Scale bar 5 100 mm.
19.
Fig. 4. a: SEM of a stage 2 chick embryo in which the hypoblast was removed revealingthe ventral (basal) surface of the epiblast (E) and the initial primitive streak (PS), which
has a triangular shape. Scale bar 5 60 mm.
b: Enlargement of the primitive streak (PS). A basal lamina is absent ventral to the
primitive streak cells, allowing the identification of individual cells. Scale bar 5 100 mm.
c: Enlargement of the more lateral epiblast (E). A basal lamina is present ventral to the
more lateral epiblast, obscuring cell borders. Arrow points to the area opaca.
Scale bar 5 100 mm.
20.
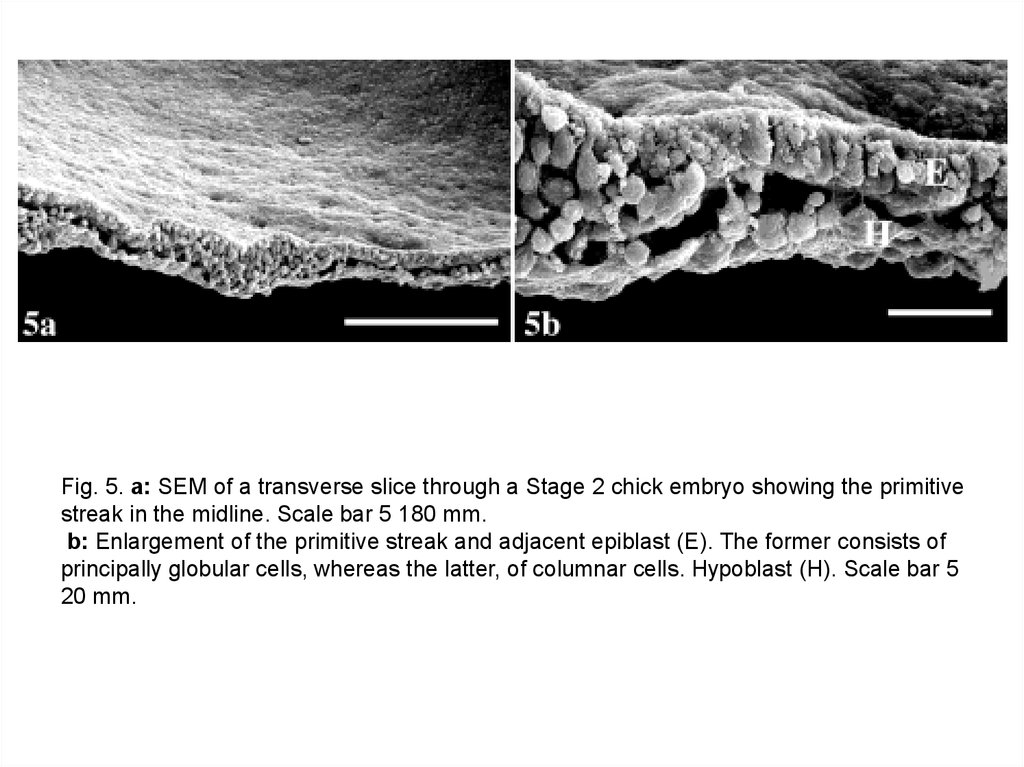
Fig. 5. a: SEM of a transverse slice through a Stage 2 chick embryo showing the primitivestreak in the midline. Scale bar 5 180 mm.
b: Enlargement of the primitive streak and adjacent epiblast (E). The former consists of
principally globular cells, whereas the latter, of columnar cells. Hypoblast (H). Scale bar 5
20 mm.
21.
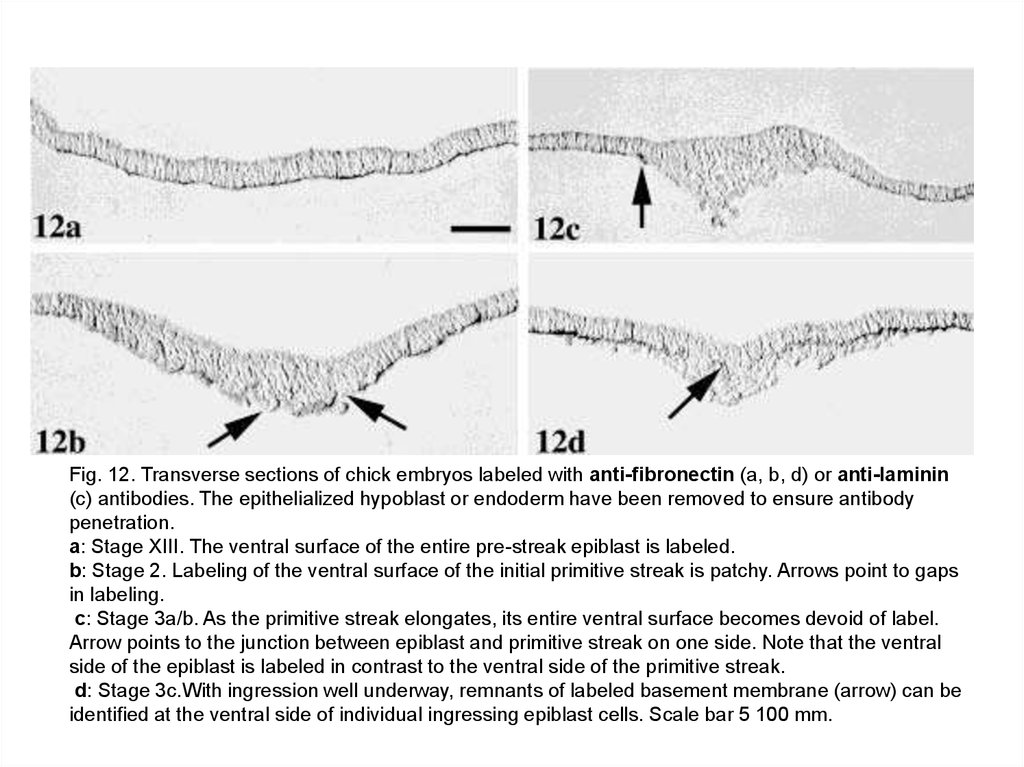
Fig. 12. Transverse sections of chick embryos labeled with anti-fibronectin (a, b, d) or anti-laminin(c) antibodies. The epithelialized hypoblast or endoderm have been removed to ensure antibody
penetration.
a: Stage XIII. The ventral surface of the entire pre-streak epiblast is labeled.
b: Stage 2. Labeling of the ventral surface of the initial primitive streak is patchy. Arrows point to gaps
in labeling.
c: Stage 3a/b. As the primitive streak elongates, its entire ventral surface becomes devoid of label.
Arrow points to the junction between epiblast and primitive streak on one side. Note that the ventral
side of the epiblast is labeled in contrast to the ventral side of the primitive streak.
d: Stage 3c.With ingression well underway, remnants of labeled basement membrane (arrow) can be
identified at the ventral side of individual ingressing epiblast cells. Scale bar 5 100 mm.
22.
Механизмы удлинения ПП :-
конвергенция-растяжение материала ПП, увеличение
длины коррелирует с уменьшением ширины ПП
(дл 770-1475 мкм, шир 325-145 мкм);
- ингрессия клеток из Э на ростральном конце ПП;
-
ориентированные клеточные деления, когда большая
часть веретен делений ориентирована вдоль переднезадней оси.
23.
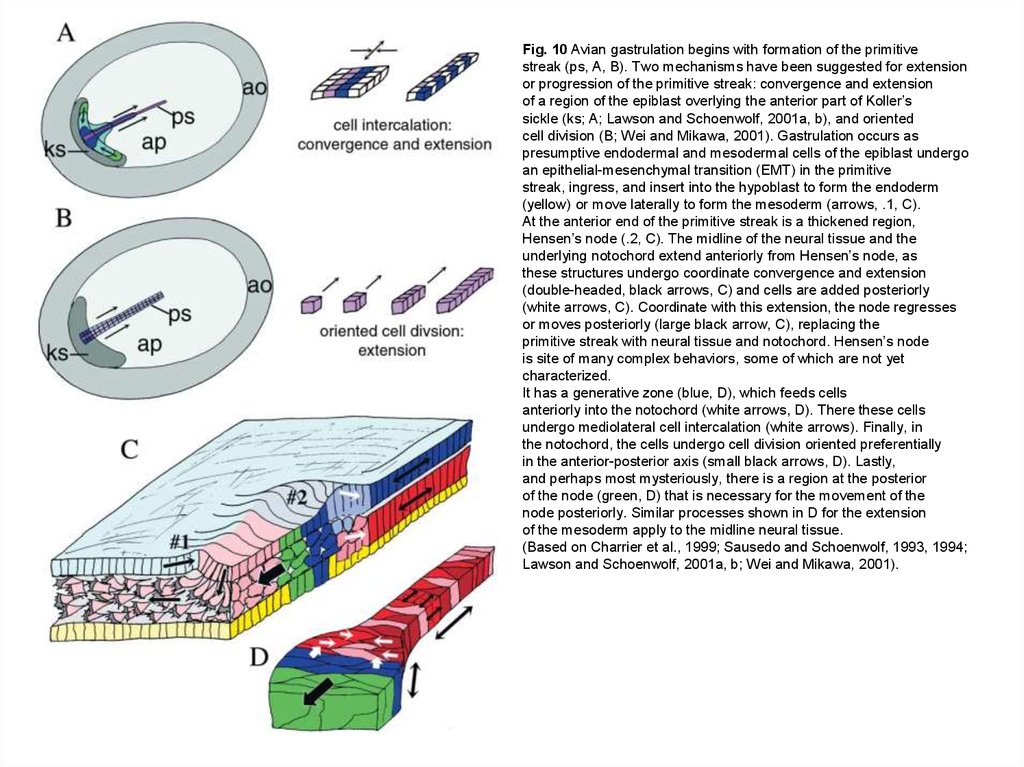
Fig. 10 Avian gastrulation begins with formation of the primitivestreak (ps, A, B). Two mechanisms have been suggested for extension
or progression of the primitive streak: convergence and extension
of a region of the epiblast overlying the anterior part of Koller’s
sickle (ks; A; Lawson and Schoenwolf, 2001a, b), and oriented
cell division (B; Wei and Mikawa, 2001). Gastrulation occurs as
presumptive endodermal and mesodermal cells of the epiblast undergo
an epithelial-mesenchymal transition (EMT) in the primitive
streak, ingress, and insert into the hypoblast to form the endoderm
(yellow) or move laterally to form the mesoderm (arrows, .1, C).
At the anterior end of the primitive streak is a thickened region,
Hensen’s node (.2, C). The midline of the neural tissue and the
underlying notochord extend anteriorly from Hensen’s node, as
these structures undergo coordinate convergence and extension
(double-headed, black arrows, C) and cells are added posteriorly
(white arrows, C). Coordinate with this extension, the node regresses
or moves posteriorly (large black arrow, C), replacing the
primitive streak with neural tissue and notochord. Hensen’s node
is site of many complex behaviors, some of which are not yet
characterized.
It has a generative zone (blue, D), which feeds cells
anteriorly into the notochord (white arrows, D). There these cells
undergo mediolateral cell intercalation (white arrows). Finally, in
the notochord, the cells undergo cell division oriented preferentially
in the anterior-posterior axis (small black arrows, D). Lastly,
and perhaps most mysteriously, there is a region at the posterior
of the node (green, D) that is necessary for the movement of the
node posteriorly. Similar processes shown in D for the extension
of the mesoderm apply to the midline neural tissue.
(Based on Charrier et al., 1999; Sausedo and Schoenwolf, 1993, 1994;
Lawson and Schoenwolf, 2001a, b; Wei and Mikawa, 2001).
24.
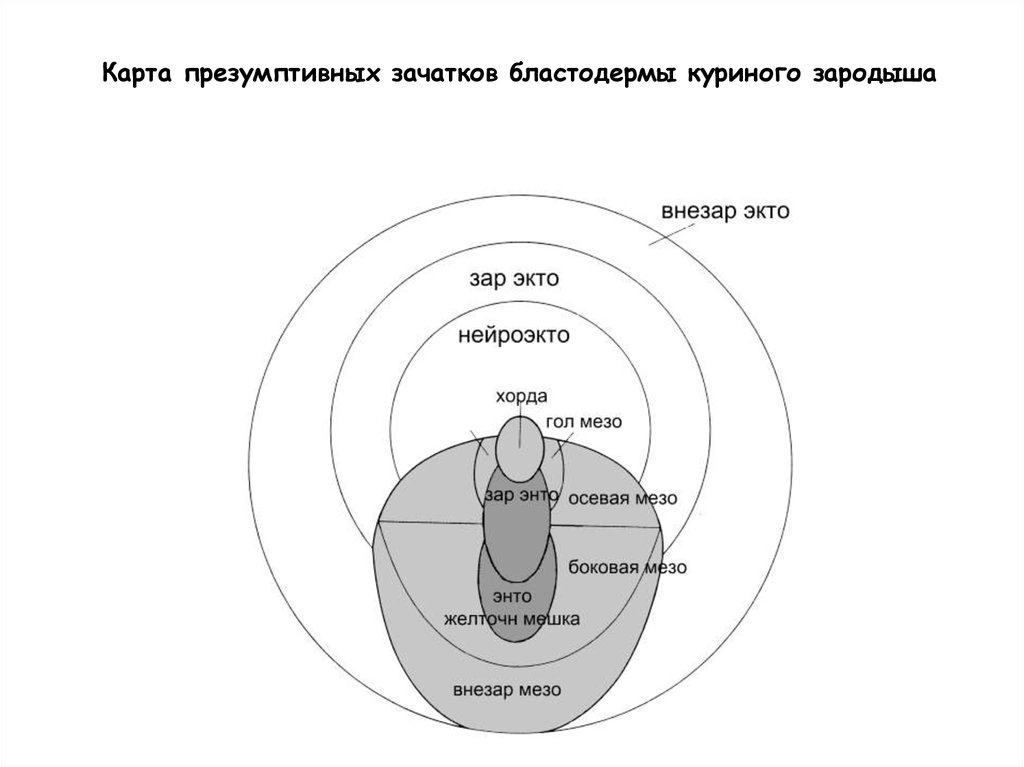
Карта презумптивных зачатков бластодермы куриного зародыша25.
Клетки проспективной мезодермыпретерпевают ингрессию через ПП в таком
рострокаудальном порядке, который отражает
их медиолатеральное положение в
мезодермальной мантии после ингрессии:
- передняя часть хорды (от уровня среднего
мозга до 17 сомита) образуется за счет
ингрессии через ГУ (до 17 сомита), задняя часть
хорды формируется за счет ингрессии клеток
через боковые стороны ПП;
- материал параксиальной мезодермы
ингрессирует через более заднюю часть ПП, т.е.
125-750 мкм от ГУ;
- промежуточная мезодерма через еще более
заднюю часть ПП, т.е между параксиальной и
боковой пластинкой М;
- боковая мезодерма еще более каудально, т.е.
750-1000 мкм от ГУ;
- внезародышевая М на расстоянии 1000 мкм от
ГУ и до заднего конца ПП.
26.
Fig. 9. SEM of the ventral surface of a Stage 5 chick embryo in which the endoderm was removed. Thefront of the ingressing mesoderm (arrows) has advanced rostrally as compared with earlier stages.
Primitive streak (PS). Scale bar 5 250 mm.
27.
Fig. 10. SEM of the ventral surface of a Stage 6 chick embryo in which the endoderm was removed.Asterisk marks the head fold of the body and the incipient cranial intestinal portal; primitive streak (PS);
notochord (N). Scale bar 5 300 mm.
28.
Конвергенция-растяжениеFIGURE 5. A series of frames from a
time-lapse movie showing the
сonvergentextension movements
characteristic of midline cells derived
from Hensen’s node (i.e., the floor plate
of the neural tube, the notochord, and
mid-dorsal endoderm of the gut).
Hensen’s node, from a fluorescently
labeled donor embryo, was transplanted
homotopically and isochronically in place
of the unlabeled Hensen’s node of the
host.
Frames are lettered in temporal
sequence. The caudal end of the embryo
is at the bottom, midline of each figure.
Terms: ps, primitive streak.
29.
FIGURE 4. Fate mapping by following fluorescent dyes microinjected into the primitive streak (ps). (A) Two hours after injection ofdye into the cranial one-third of the primitive streak (caudal to Hensen’s node; hn), cells are beginning to migrate bilaterally. The
caudal end of the embryo is at the bottom, midline of the figure. (B) At sacrifice 24 hours after injection, labeled cells have
migrated bilaterally, populating the paraxial mesoderm of the trunk and subsequently forming the somites (s) flanking the neural
tube (nt). (C) Whole mount at a stage similar to that shown in part B to demonstrate better the anatomy of the embryo at the time
of sacrifice.
30.
31.
Регрессия первичной полоски32.
Figure 11.15. Formation of Hensen's node from Koller's sickle.(A) Diagram of the posterior end of an early (pre-streak) embryo, showing the cells labeled with fluorescent dyes
in the photographs. (B) Just before gastrulation, cells in the anterior end of Koller's sickle (the epiblast and middle
layer) were labeled with green dye. Cells of the posterior portion of Koller's sickle were labeled with red dye. As
the cells migrate, the anterior cells formed Hensen's node and its notochord derivatives. The posterior cells
formed the posterior region of the primitive streak. The time after dye injection is labeled on each photograph.
(After Bachvarova et al. 1998; photographs courtesy of R. F. Bachvarova.)
33.
FIGURE 8. Whole-mount in situ hybridization of the chick blastoderm at the fully elongated primitive-streak stage.(A) The transcription factor Brachyury (T) labels the entire primitive streak (ps), including Hensen’s node (hn).
(B) The secreted factor Sonic hedgehog (Shh) labels Hensen’s node (hn), but not the remainder of the primitive streak (ps).
(C) The fork-head-related transcription factor, HNF3β, labels Hensen’s node (hn), but not the remainder of the primitive streak
(ps).
(D) The transcription factor Goosecoid (Gsc) labels Hensen’s node (hn) and also the rostral one-third of the primitive streak
(ps).
34.
Figure 11.14. Regulationof the chick blastoderm.
When the blastoderm is
divided into four parts,
each part can initiate
gastrulation and give rise
to an embryo. Usually, only
the cells of the posterior
marginal zone are able to
form a primitive streak,
and they inhibit other
areas of the marginal zone
from doing so. (After Spratt
and Haas 1960).
35.
Возможный механизм формирования первичной полоски у куриных зародышейcт. XII
ст. 2
Вид с вентральной стороны. a.o. – зеленый, краевая зона – красный, эпибласт –
желтый, гипобласт – голубой, энтобласт – белый.
(А) Взаимодействие Vg1 в ЗКЗ и Wnt8c по всей КЗ приводит к экспрессии Nodal в
эпибласте a.p.
Nodal сигнал блокируется Cerberus, который экспрессируется в гипобласте.
(В) Гипобласт смещается вперед энтобластом, в котором нет экспрессии
Cerberus. Под действием Nodal формируется ПП и экпрессируется Lefty1. Lefty1
действует как ингибитор Nodal, предотвращая образование дополнительных
первичных полосок.
Bertocchini, Stern, 2002.
36.
37.
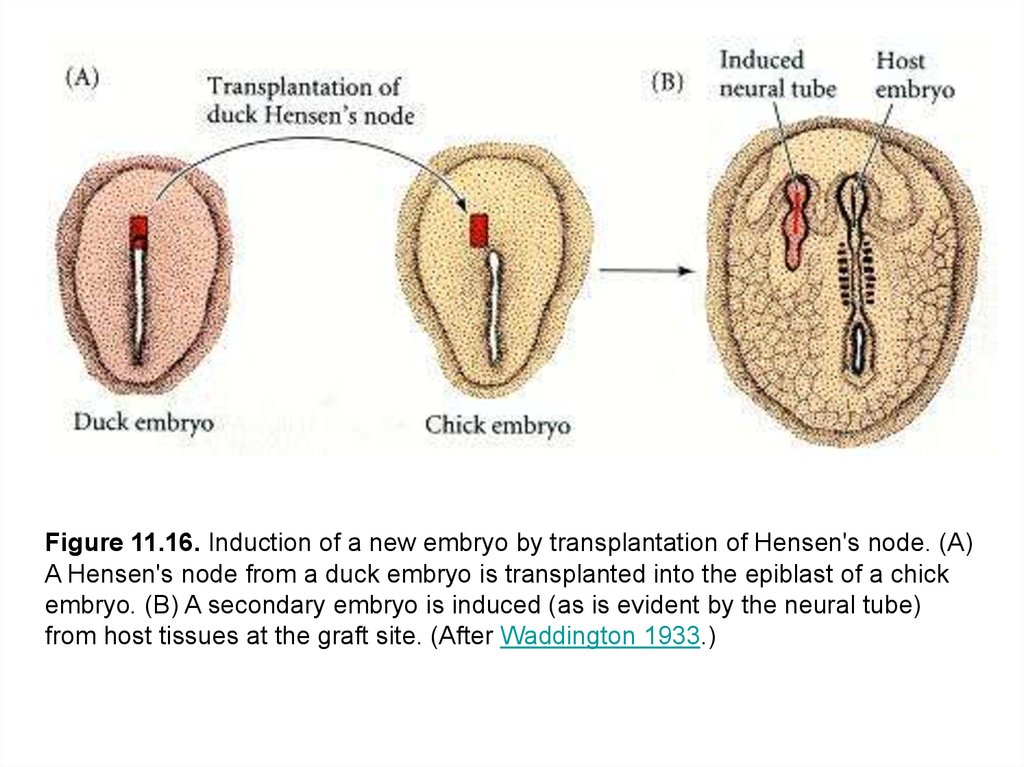
Figure 11.16. Induction of a new embryo by transplantation of Hensen's node. (A)A Hensen's node from a duck embryo is transplanted into the epiblast of a chick
embryo. (B) A secondary embryo is induced (as is evident by the neural tube)
from host tissues at the graft site. (After Waddington 1933.)
38.
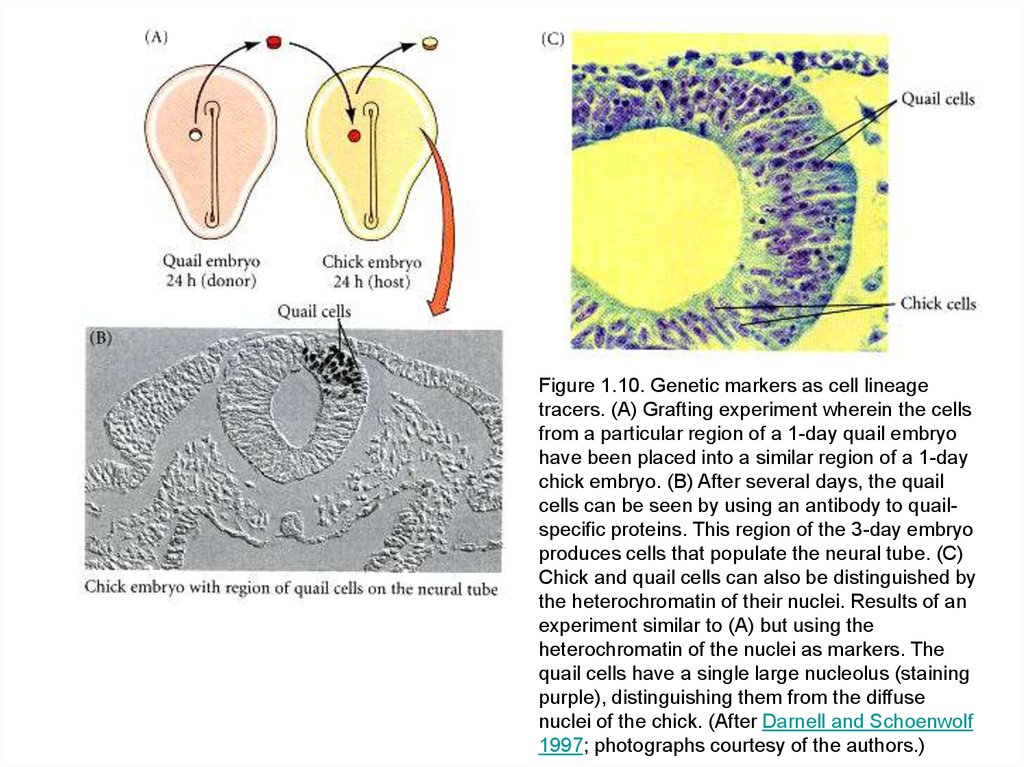
Figure 1.10. Genetic markers as cell lineagetracers. (A) Grafting experiment wherein the cells
from a particular region of a 1-day quail embryo
have been placed into a similar region of a 1-day
chick embryo. (B) After several days, the quail
cells can be seen by using an antibody to quailspecific proteins. This region of the 3-day embryo
produces cells that populate the neural tube. (C)
Chick and quail cells can also be distinguished by
the heterochromatin of their nuclei. Results of an
experiment similar to (A) but using the
heterochromatin of the nuclei as markers. The
quail cells have a single large nucleolus (staining
purple), distinguishing them from the diffuse
nuclei of the chick. (After Darnell and Schoenwolf
1997; photographs courtesy of the authors.)
39.
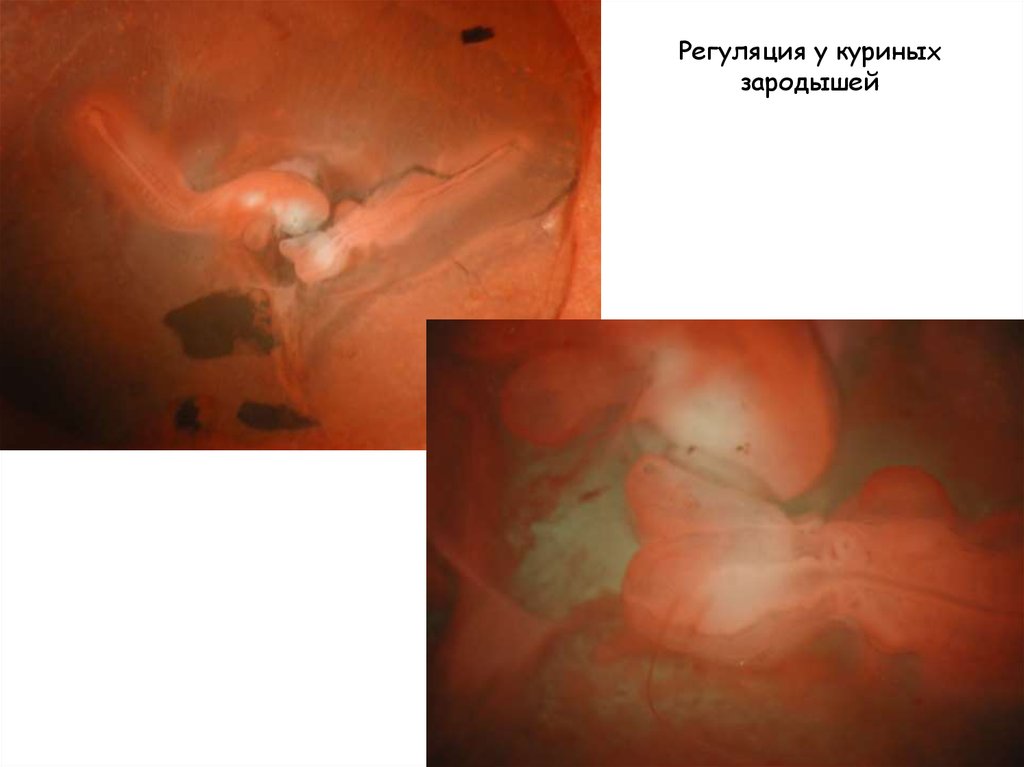
Регуляция у куриныхзародышей