Similar presentations:


High-Frequency Mini Ultrasound Probe for Aesthetic Medicine (2)
1.
MEDICAL DEVICE • NWFDRUSSIA
High-F requency Mini Ultras ound
P robe for Aes thetic Medicine
CMAS visualization • filler guidance • complication risk reduction
1
2
3
Real-time visualization of superficial anatomical
layers
Vessel mapping for safer injection
procedures
Complication management with ultrasound-guided
interventions
DAWEI Medical | Distribution in NWFD | Registration (RU) in progress | 2025
2.
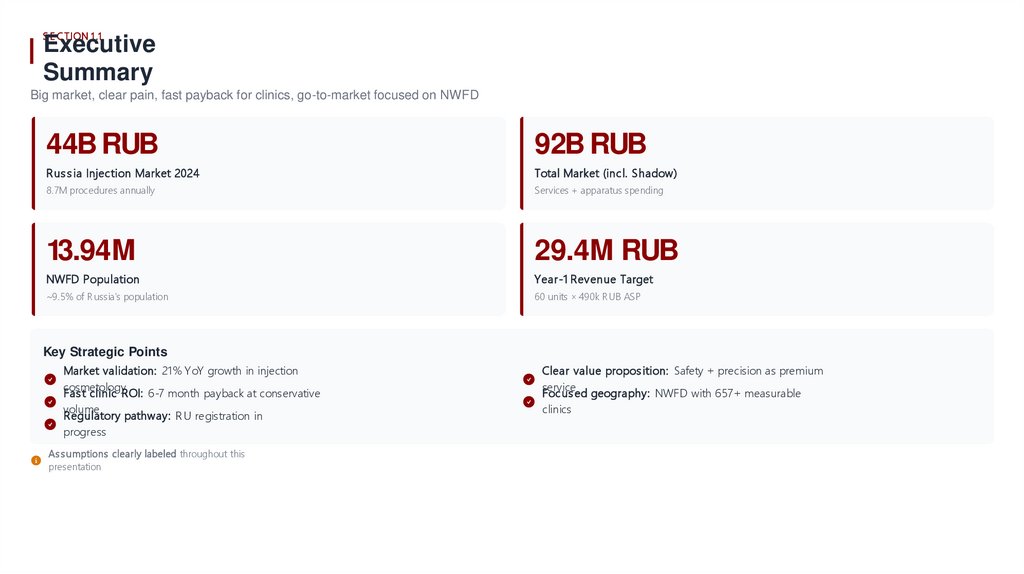
S E C T ION 1 .1Executive
Summary
Big market, clear pain, fast payback for clinics, go-to-market focused on NWFD
44B RUB
92B RUB
Rus s ia Injection Market 2024
Total Market (incl. Shadow)
8.7M procedures annually
Services + apparatus spending
13.94M
29.4M RUB
NWFD Population
Year-1 Revenue Target
~9.5% of R ussia's population
60 units × 490k R UB ASP
Key Strategic Points
Market validation: 21% YoY growth in injection
cosmetology
Fas t clinic ROI: 6-7 month payback at conservative
volume
Regulatory pathway: R U registration in
progress
As s umptions clearly labeled throughout this
presentation
Clear value propos ition: Safety + precision as premium
service
Focus ed geography: NWFD with 657+ measurable
clinics
3.
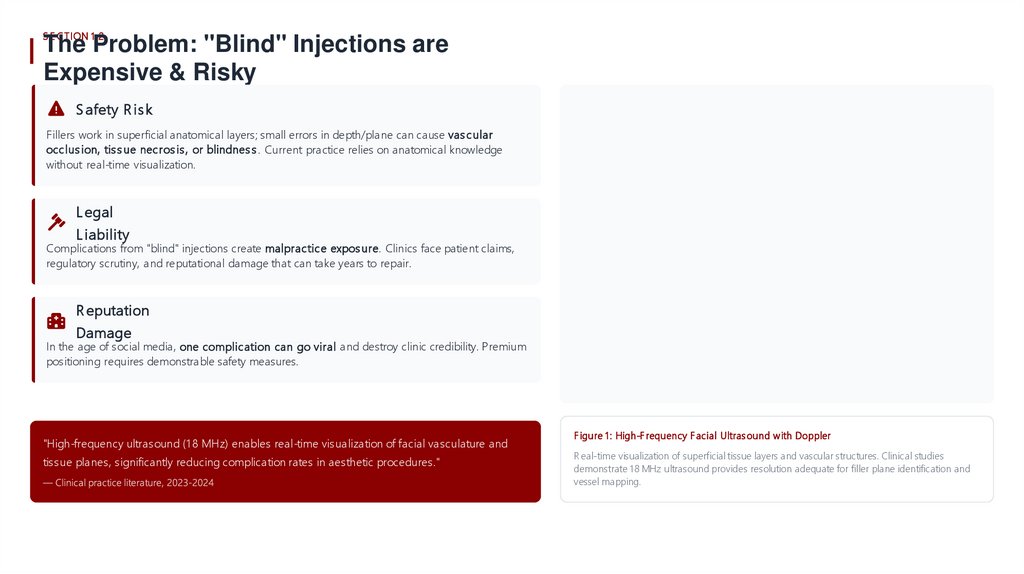
S E C T ION 1 .2The Problem: "Blind" Injections are
Expensive & Risky
S afety R is k
Fillers work in superficial anatomical layers; small errors in depth/plane can cause vas cular
occlus ion, tis s ue necros is , or blindnes s . Current practice relies on anatomical knowledge
without real-time visualization.
L egal
L iability
Complications from "blind" injections create malpractice expos ure. Clinics face patient claims,
regulatory scrutiny, and reputational damage that can take years to repair.
R eputation
Damage
In the age of social media, one complication can go viral and destroy clinic credibility. Premium
positioning requires demonstrable safety measures.
"High-frequency ultrasound (1 8 MHz) enables real-time visualization of facial vasculature and
tissue planes, significantly reducing complication rates in aesthetic procedures."
F igure 1 : High-F requency F acial Ultras ound with Doppler
R eal-time visualization of superficial tissue layers and vascular structures. Clinical studies
demonstrate 18 MHz ultrasound provides resolution adequate for filler plane identification and
vessel mapping.
4.
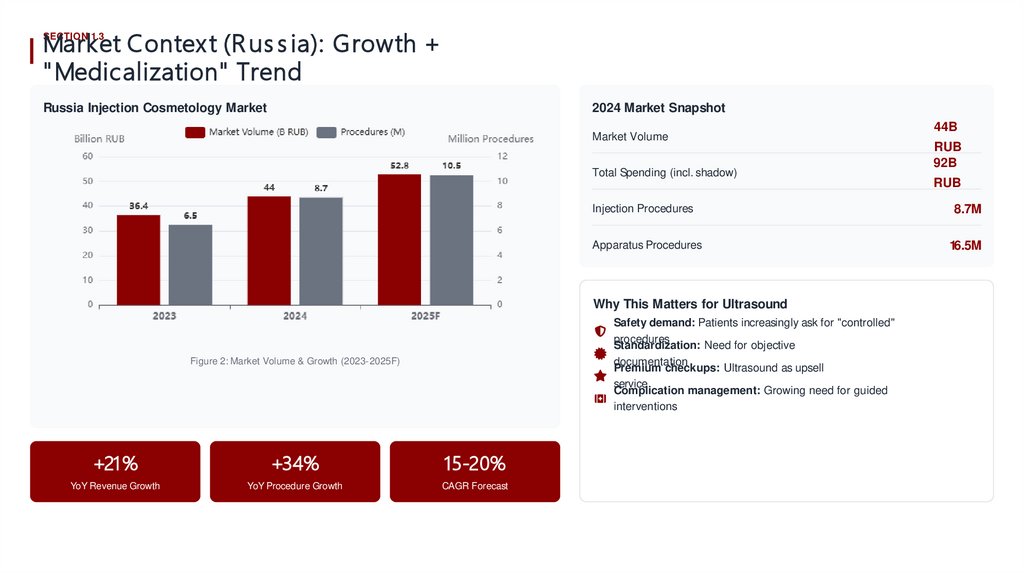
Market Contex t (R us s ia): Growth +" Medicalization" Trend
SECTION 1.3
Russia Injection Cosmetology Market
2024 Market Snapshot
Market Volume
Total Spending (incl. shadow)
+34%
15-20%
YoY Revenue Growth
YoY Procedure Growth
CAGR Forecast
RUB
8.7M
Apparatus Procedures
16.5M
Safety demand: Patients increasingly ask for "controlled"
procedures
Standardization: Need for objective
documentation
Premium checkups: Ultrasound as upsell
service
Complication management: Growing need for guided
interventions
+21%
RUB
92B
Injection Procedures
Why This Matters for Ultrasound
Figure 2: Market Volume & Growth (2023-2025F)
44B
5.
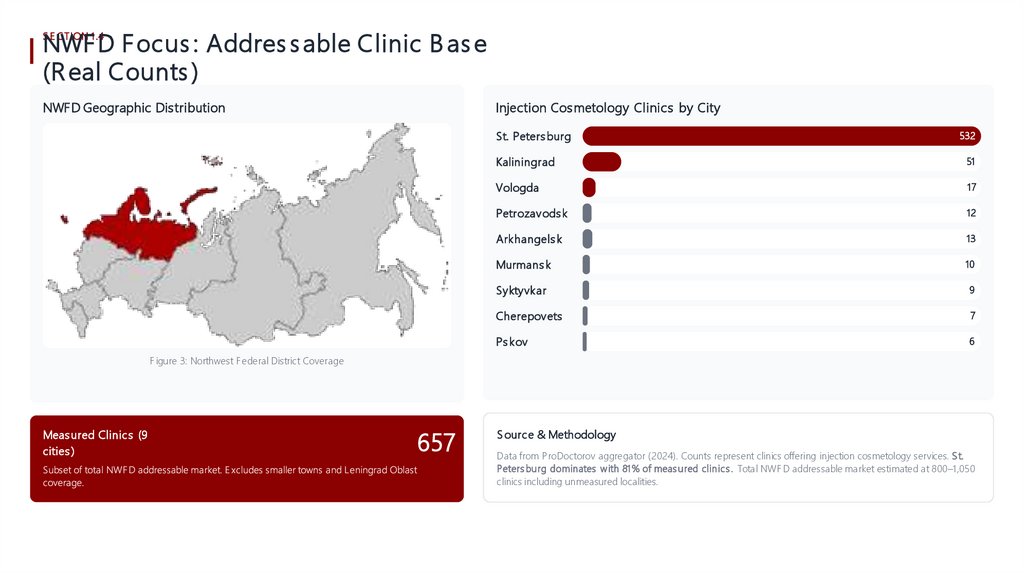
NWF D F ocus : Addres s able Clinic B as e(R eal Counts )
S E C T ION 1 .4
NWFD Geographic Dis tribution
Injection Cos metology Clinics by City
St. Peters burg
532
Kaliningrad
51
Vologda
17
Petrozavods k
12
Arkhangels k
13
Murmans k
10
Syktyvkar
9
Cherepovets
7
Ps kov
6
F igure 3: Northwest F ederal District Coverage
Meas ured Clinics (9
cities )
657
S ource & Methodology
Data from P roDoctorov aggregator (2024). Counts represent clinics offering injection cosmetology services. S t.
Peters burg dominates with 81% of meas ured clinics . Total NWF D addressable market estimated at 800–1 ,050
clinics including unmeasured localities.
6.
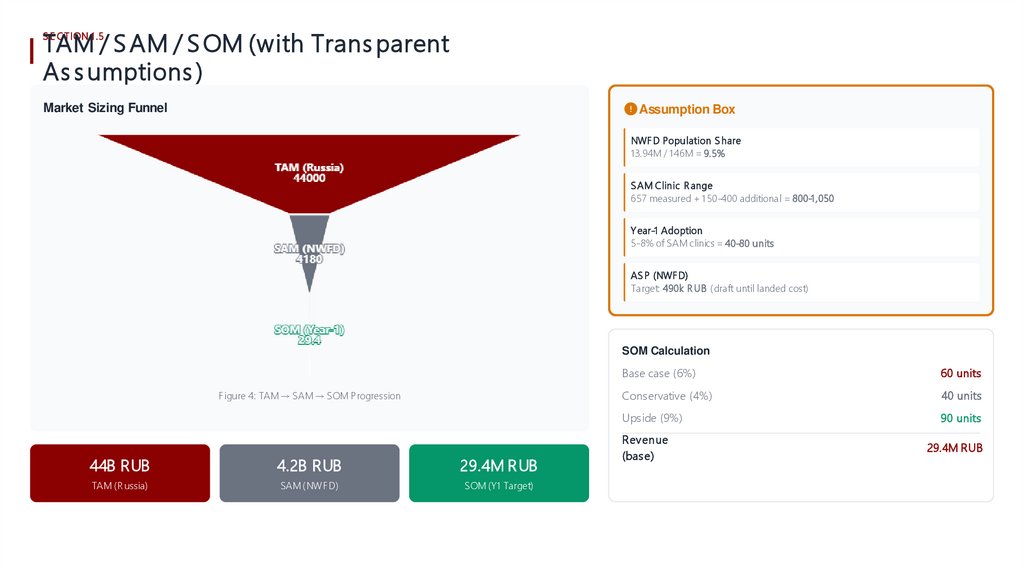
TAM / S AM / S OM (with Trans parentAs s umptions )
S E C T ION 1 .5
Market Sizing Funnel
Assumption Box
NWF D Population S hare
13.94M / 1 46M = 9.5%
S AM Clinic R ange
657 measured + 1 50-400 additional = 800-1 ,050
Y ear-1 Adoption
5-8% of S AM clinics = 40-80 units
AS P (NWF D)
Target: 490k R UB (draft until landed cost)
SOM Calculation
F igure 4: TAM → SAM → SOM Progression
44B RUB
4.2B RUB
29.4M RUB
TAM (R ussia)
SAM (NWF D)
SOM (Y1 Target)
Base case (6%)
60 units
Conservative (4%)
40 units
Upside (9%)
90 units
Revenue
(bas e)
29.4M RUB
7.
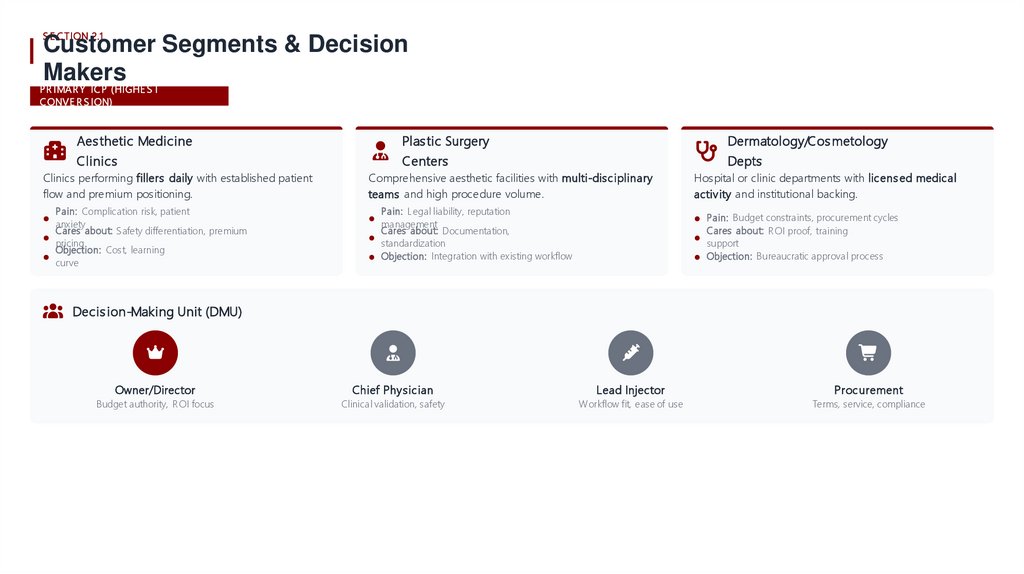
S E C T ION 2.1Customer Segments & Decision
Makers
PR IMA R Y IC P (HIGHE S T
C ONVE R S ION)
Aes thetic Medicine
Clinics
Clinics performing fillers daily with established patient
flow and premium positioning.
Pain: Complication risk, patient
anxiety
Cares about: S afety differentiation, premium
pricing
Objection: Cost, learning
curve
Plas tic Surgery
Dermatology/Cos metology
Centers
Depts
Comprehensive aesthetic facilities with multi-disciplinary
teams and high procedure volume.
Pain: Legal liability, reputation
management
Cares about: Documentation,
standardization
Objection: Integration with existing workflow
Hospital or clinic departments with licens ed medical
activity and institutional backing.
Pain: Budget constraints, procurement cycles
Cares about: R OI proof, training
support
Objection: Bureaucratic approval process
Decis ion-Making Unit (DMU)
Owner/Director
Chief Physician
Lead Injector
Procurement
Budget authority, R OI focus
Clinical validation, safety
Workflow fit, ease of use
Terms, service, compliance
8.
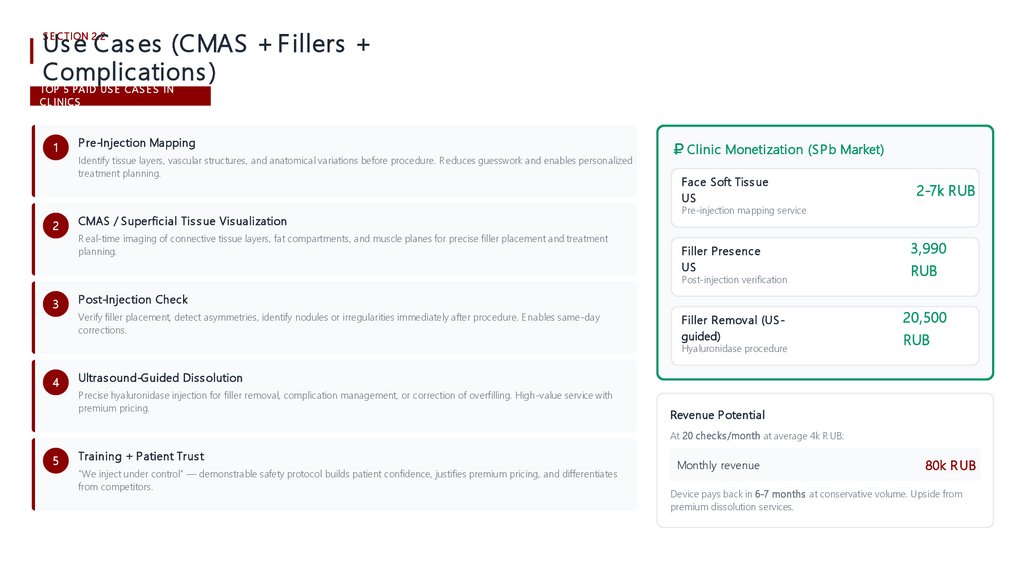
Us e Cas es (CMAS + F illers +Complications )
S E C T ION 2.2
TOP 5 PA ID US E C A S E S IN
C L INIC S
1
2
P re-Injection Mapping
Identify tissue layers, vascular structures, and anatomical variations before procedure. R educes guesswork and enables personalized
treatment planning.
CMAS / Superficial Tis s ue Vis ualization
R eal-time imaging of connective tissue layers, fat compartments, and muscle planes for precise filler placement and treatment
planning.
Clinic Monetization (S Pb Market)
Face Soft Tiss ue
US
Pre-injection mapping service
Filler Pres ence
US
3,990
Filler Removal (US guided)
20,500
Post-injection verification
3
RUB
P ost-Injection Check
Verify filler placement, detect asymmetries, identify nodules or irregularities immediately after procedure. E nables same-day
corrections.
Hyaluronidase procedure
4
2-7k RUB
RUB
Ultras ound-Guided Diss olution
Precise hyaluronidase injection for filler removal, complication management, or correction of overfilling. High-value service with
premium pricing.
Revenue P otential
At 20 checks /month at average 4k R UB:
5
Training + P atient Trus t
"We inject under control" — demonstrable safety protocol builds patient confidence, justifies premium pricing, and differentiates
from competitors.
Monthly revenue
80k R UB
Device pays back in 6-7 months at conservative volume. Upside from
premium dissolution services.
9.
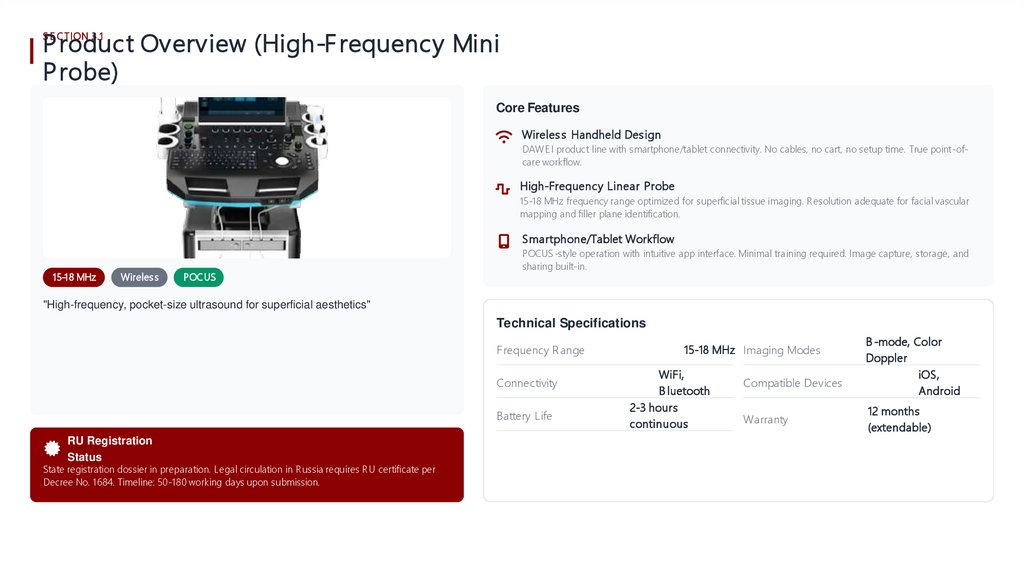
P roduct Overview (High-F requency MiniP robe)
S E C T ION 3.1
Core Features
Wireles s Handheld Des ign
DAWE I product line with smartphone/tablet connectivity. No cables, no cart, no setup time. True point-ofcare workflow.
High-Frequency Linear Probe
15-18 MHz frequency range optimized for superficial tissue imaging. R esolution adequate for facial vascular
mapping and filler plane identification.
Smartphone/Tablet Workflow
15-18 MHz
Wireles s
POCUS
POCUS -style operation with intuitive app interface. Minimal training required. Image capture, storage, and
sharing built-in.
"High-frequency, pocket-size ultrasound for superficial aesthetics"
Technical Specifications
Frequency R ange
Connectivity
Battery Life
RU Registration
Status
State registration dossier in preparation. Legal circulation in R ussia requires R U certificate per
Decree No. 1684. Timeline: 50-180 working days upon submission.
15-18 MHz Imaging Modes
WiFi,
B luetooth
2-3 hours
continuous
Compatible Devices
Warranty
B -mode, Color
Doppler
iOS,
Android
12 months
(extendable)
10.
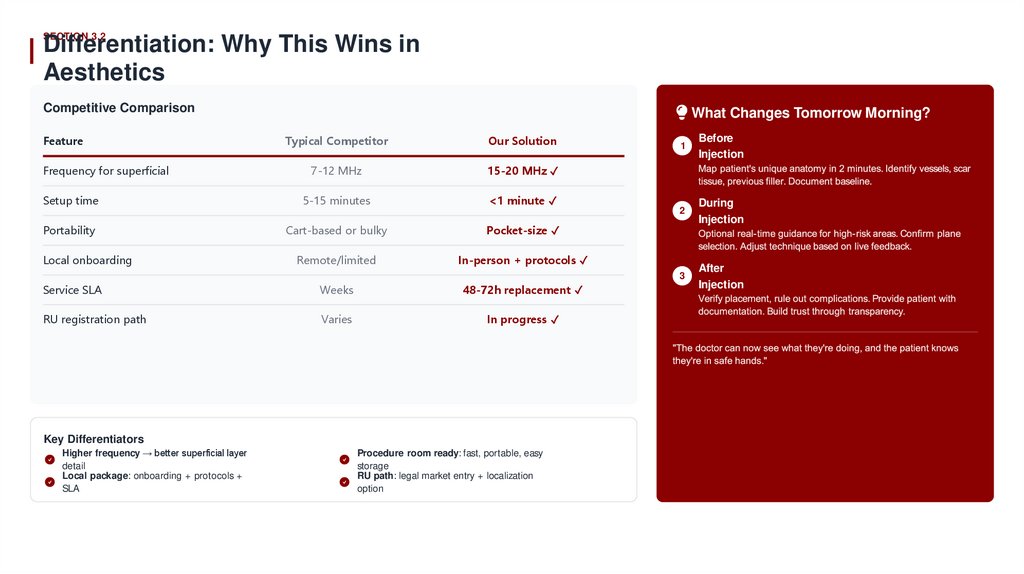
SECTION 3.2Differentiation: Why This Wins in
Aesthetics
Competitive Comparison
Feature
What Changes Tomorrow Morning?
Typical Competitor
Our Solution
7-12 MHz
15-20 MHz ✓
Setup time
5-15 minutes
<1 minute ✓
Portability
Cart-based or bulky
Pocket-size ✓
Remote/limited
In-person + protocols ✓
Frequency for superficial
Local onboarding
Service SLA
Weeks
48-72h replacement ✓
RU registration path
Varies
In progress ✓
Key Differentiators
Higher frequency → better superficial layer
detail
Local package: onboarding + protocols +
SLA
Procedure room ready: fast, portable, easy
storage
RU path: legal market entry + localization
option
1
Before
Injection
2
During
Injection
3
After
Injection
11.
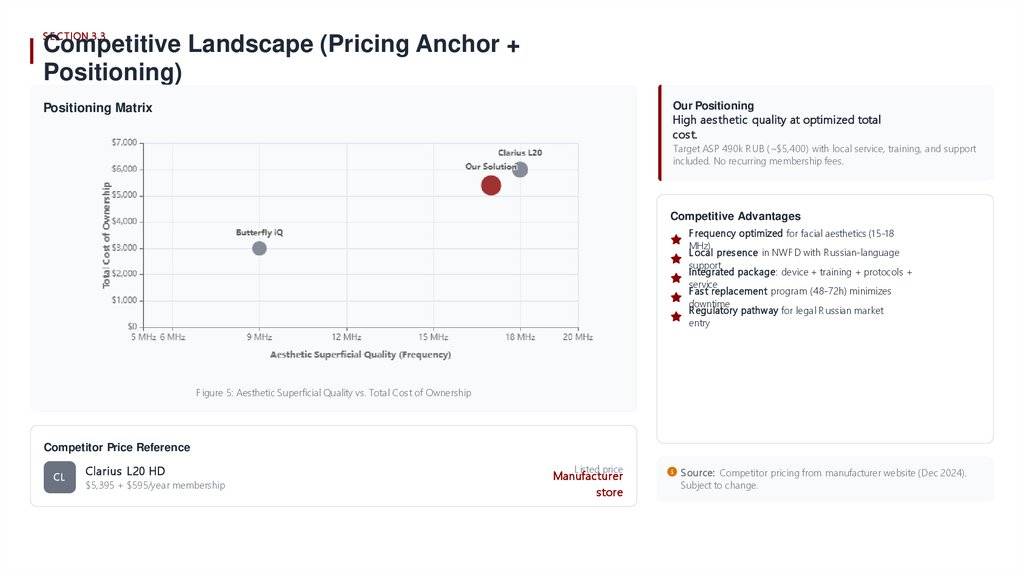
S E C T ION 3.3Competitive Landscape (Pricing Anchor +
Positioning)
Our Positioning
High aes thetic quality at optimized total
cos t.
Positioning Matrix
Target ASP 490k R UB (~$5,400) with local service, training, and support
included. No recurring membership fees.
Competitive Advantages
F requency optimized for facial aesthetics (15-18
MHz)
L ocal pres ence in NWF D with R ussian-language
support
Integrated package: device + training + protocols +
service
F as t replacement program (48-72h) minimizes
downtime
R egulatory pathway for legal R ussian market
entry
F igure 5: Aesthetic Superficial Quality vs. Total Cost of Ownership
Competitor Price Reference
CL
Clarius L20 HD
$5,395 + $595/year membership
Listed price
Manufacturer
store
S ource: Competitor pricing from manufacturer website (Dec 2024).
Subject to change.
12.
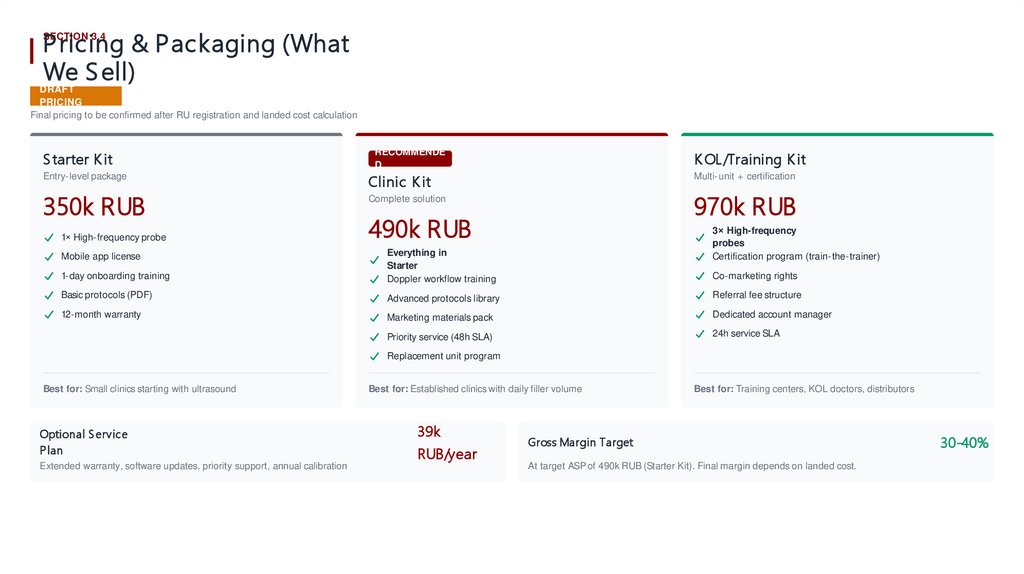
P ricing & P ackaging (WhatWe S ell)
SECTION 3.4
DRAFT
PRICING
Final pricing to be confirmed after RU registration and landed cost calculation
S tarter K it
RECOMMENDE
D
K OL/Training K it
Entry-level package
Clinic K it
Multi-unit + certification
350k RUB
1× High-frequency probe
970k RUB
Complete solution
490k RUB
3× High-frequency
probes
Certification program (train-the-trainer)
1-day onboarding training
Everything in
Starter
Doppler workflow training
Basic protocols (PDF)
Advanced protocols library
Referral fee structure
12-month warranty
Marketing materials pack
Dedicated account manager
Priority service (48h SLA)
24h service SLA
Mobile app license
Co-marketing rights
Replacement unit program
Best for: Small clinics starting with ultrasound
Optional S ervice
P lan
Extended warranty, software updates, priority support, annual calibration
Best for: Established clinics with daily filler volume
39k
RUB/year
Best for: Training centers, KOL doctors, distributors
Gross Margin Target
At target ASP of 490k RUB (Starter Kit). Final margin depends on landed cost.
30-40%
13.
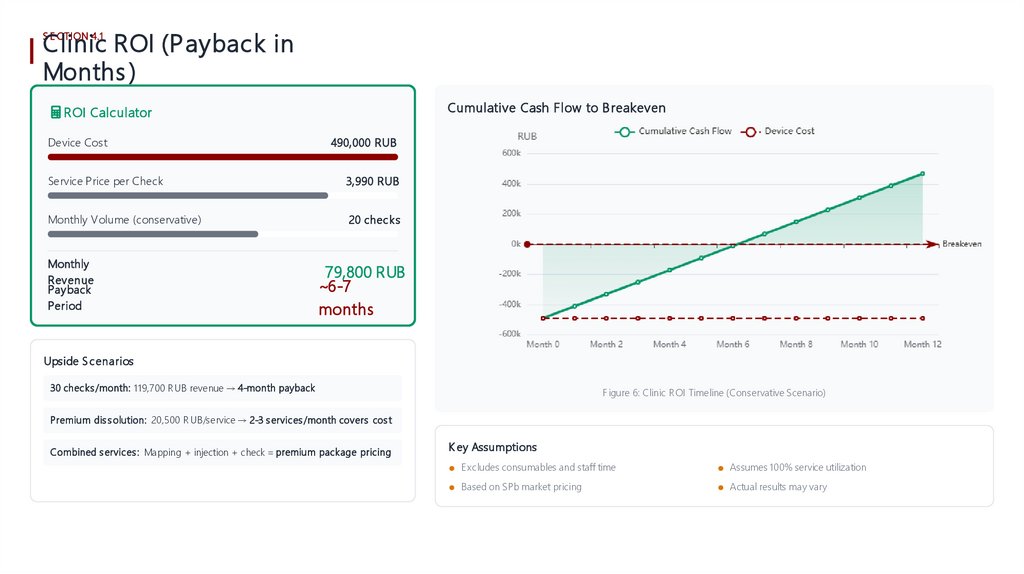
Clinic ROI (P ayback inMonths )
S E C T ION 4.1
Cumulative Cash Flow to B reakeven
ROI Calculator
Device Cost
490,000 RUB
Service Price per Check
3,990 RUB
Monthly Volume (conservative)
20 checks
Monthly
Revenue
Payback
Period
79,800 RUB
~6-7
months
Upside S cenarios
30 checks /month: 119,700 R UB revenue → 4-month payback
F igure 6: Clinic R OI Timeline (Conservative Scenario)
Premium dis s olution: 20,500 R UB/service → 2-3 s ervices /month covers cos t
Combined s ervices : Mapping + injection + check = premium package pricing
K ey Assumptions
E xcludes consumables and staff time
Assumes 100% service utilization
Based on SPb market pricing
Actual results may vary
14.
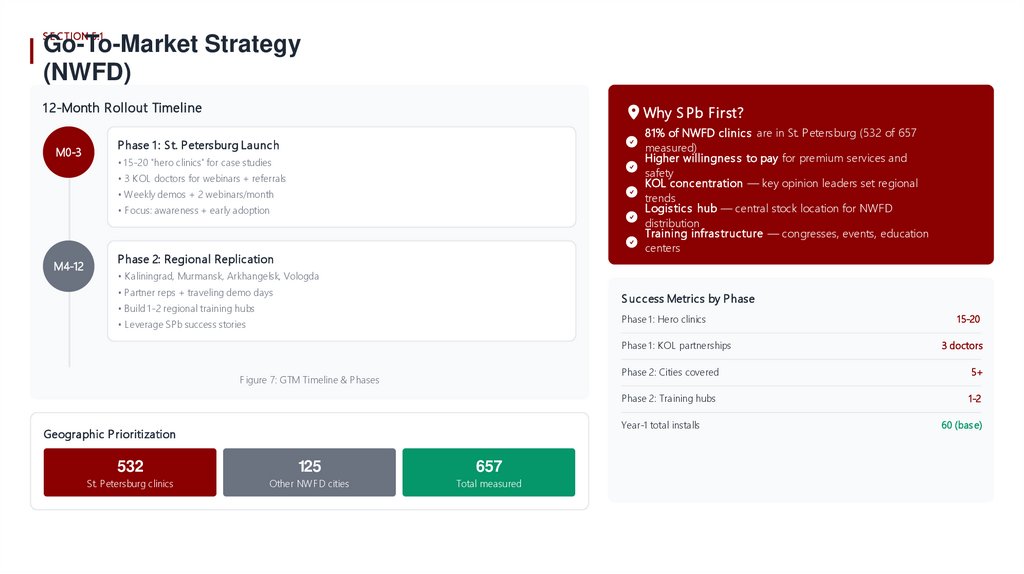
S E C T ION 5.1Go-To-Market Strategy
(NWFD)
1 2-Month Rollout Timeline
M0-3
Why S Pb First?
81% of NWFD clinics are in St. Petersburg (532 of 657
measured)
Higher willingnes s to pay for premium services and
safety
KOL concentration — key opinion leaders set regional
trends
Logis tics hub — central stock location for NWFD
distribution
Training infras tructure — congresses, events, education
centers
P hase 1 : S t. P etersburg Launch
• 1 5-20 "hero clinics" for case studies
• 3 K OL doctors for webinars + referrals
• Weekly demos + 2 webinars/month
• F ocus: awareness + early adoption
M4-12
P hase 2: Regional Replication
• K aliningrad, Murmansk, Arkhangelsk, Vologda
• Partner reps + traveling demo days
S uccess Metrics by P hase
• Build 1-2 regional training hubs
Phase 1: Hero clinics
• Leverage SPb success stories
Phase 1: K OL partnerships
F igure 7: GTM Timeline & P hases
532
125
657
St. Petersburg clinics
Other NWF D cities
Total measured
3 doctors
Phase 2: Cities covered
5+
Phase 2: Training hubs
1-2
Year-1 total installs
Geographic P rioritization
15-20
60 (bas e)
15.
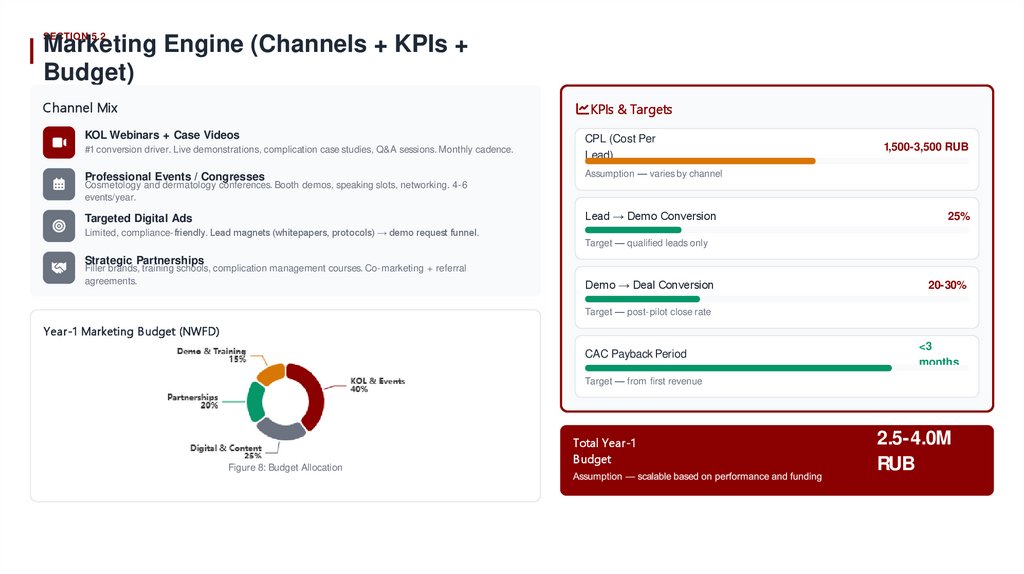
SECTION 5.2Marketing Engine (Channels + KPIs +
Budget)
Channel Mix
KPIs & Targets
KOL Webinars + Case Videos
#1 conversion driver. Live demonstrations, complication case studies, Q&A sessions. Monthly cadence.
CPL (Cost Per
Lead)
Professional Events / Congresses
Assumption — varies by channel
Targeted Digital Ads
Lead → Demo Conversion
1,500-3,500 RUB
Cosmetology and dermatology conferences. Booth demos, speaking slots, networking. 4-6
events/year.
Limited, compliance-friendly. Lead magnets (whitepapers, protocols) → demo request funnel.
25%
Target — qualified leads only
Strategic Partnerships
Filler brands, training schools, complication management courses. Co-marketing + referral
agreements.
Demo → Deal Conversion
20-30%
Target — post-pilot close rate
Year-1 Marketing B udget (NWFD)
CAC Payback Period
<3
months
Target — from first revenue
Figure 8: Budget Allocation
Total Year-1
B udget
2.5-4.0M
RUB
16.
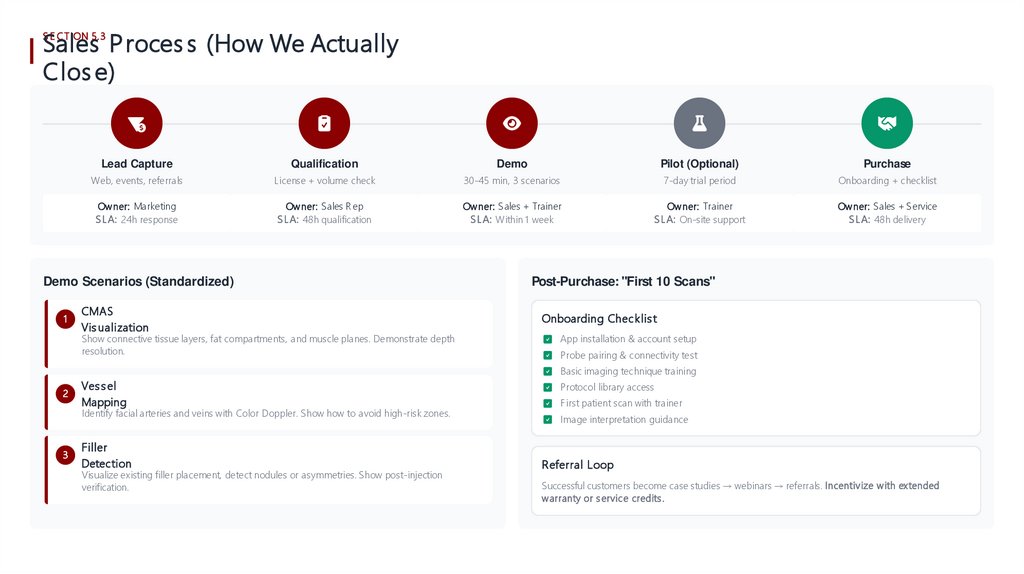
Sales P roces s (How We ActuallyClos e)
S E C T ION 5.3
Lead Capture
Qualification
Demo
Pilot (Optional)
Purchase
Web, events, referrals
License + volume check
30-45 min, 3 scenarios
7-day trial period
Onboarding + checklist
Owner: Marketing
S L A: 24h response
Owner: S ales R ep
S L A: 48h qualification
Owner: S ales + Trainer
S L A: Within 1 week
Owner: Trainer
S L A: On-site support
Owner: S ales + S ervice
S L A: 48h delivery
Demo Scenarios (Standardized)
1
CMAS
Vis ualization
Show connective tissue layers, fat compartments, and muscle planes. Demonstrate depth
resolution.
Post-Purchase: "First 10 Scans"
Onboarding Checklis t
App installation & account setup
Probe pairing & connectivity test
Basic imaging technique training
2
Ves s el
Mapping
Identify facial arteries and veins with Color Doppler. Show how to avoid high-risk zones.
3
Filler
Detection
Visualize existing filler placement, detect nodules or asymmetries. Show post-injection
verification.
Protocol library access
F irst patient scan with trainer
Image interpretation guidance
Referral Loop
Successful customers become case studies → webinars → referrals. Incentivize with extended
warranty or s ervice credits .
17.
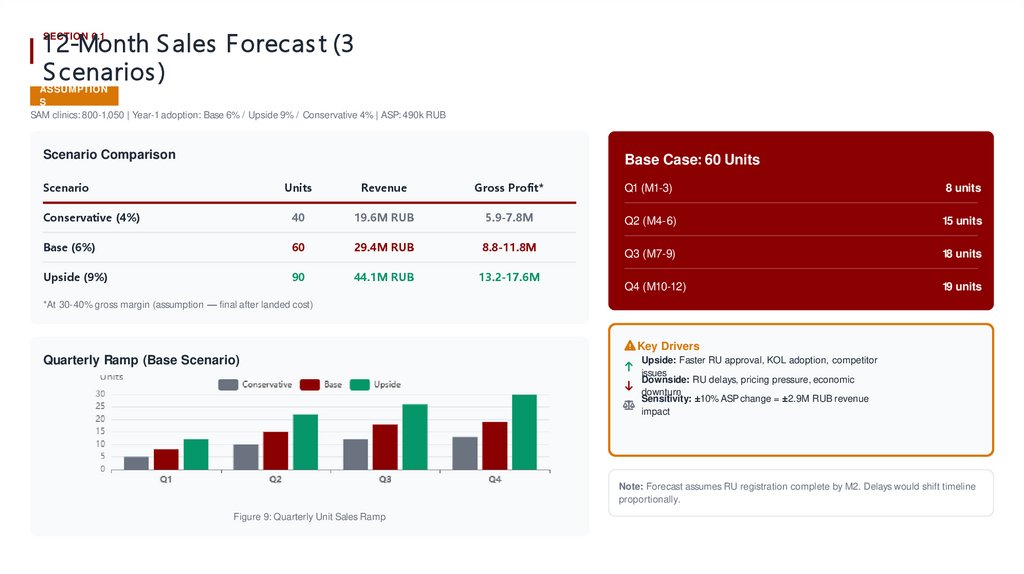
1 2-Month S ales F orecas t (3S cenarios )
SECTION 6.1
ASSUMPTION
S
SAM clinics: 800-1,050 | Year-1 adoption: Base 6% / Upside 9% / Conservative 4% | ASP: 490k RUB
Scenario Comparison
Base Case: 60 Units
Scenario
Units
Revenue
Gross Profit*
Q1 (M1-3)
8 units
Conservative (4%)
40
19.6M RUB
5.9-7.8M
Q2 (M4-6)
15 units
Base (6%)
60
29.4M RUB
8.8-11.8M
Q3 (M7-9)
18 units
Upside (9%)
90
44.1M RUB
13.2-17.6M
Q4 (M10-12)
19 units
*At 30-40% gross margin (assumption — final after landed cost)
Key Drivers
Quarterly Ramp (Base Scenario)
Upside: Faster RU approval, KOL adoption, competitor
issues
Downside: RU delays, pricing pressure, economic
downturn
Sensitivity: ±10% ASP change = ±2.9M RUB revenue
impact
Note: Forecast assumes RU registration complete by M2. Delays would shift timeline
proportionally.
Figure 9: Quarterly Unit Sales Ramp
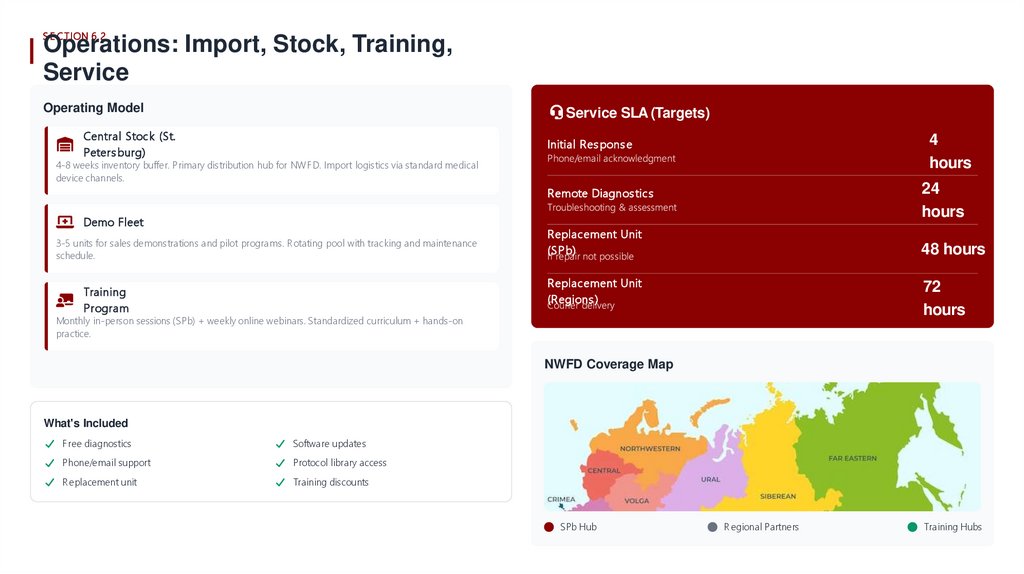
18.
S E C T ION 6.2Operations: Import, Stock, Training,
Service
Operating Model
Service SLA (Targets)
Central Stock (St.
Peters burg)
Initial Res pons e
4
hours
Remote Diagnos tics
24
hours
4-8 weeks inventory buffer. Primary distribution hub for NWF D. Import logistics via standard medical
device channels.
Demo Fleet
3-5 units for sales demonstrations and pilot programs. R otating pool with tracking and maintenance
schedule.
Replacement Unit
(S Pb)
48 hours
Replacement Unit
(R egions )
Training
Program
72
hours
Monthly in-person sessions (SPb) + weekly online webinars. Standardized curriculum + hands-on
practice.
NWFD Coverage Map
What's Included
F ree diagnostics
Software updates
Phone/email support
Protocol library access
R eplacement unit
Training discounts
SPb Hub
R egional Partners
Training Hubs
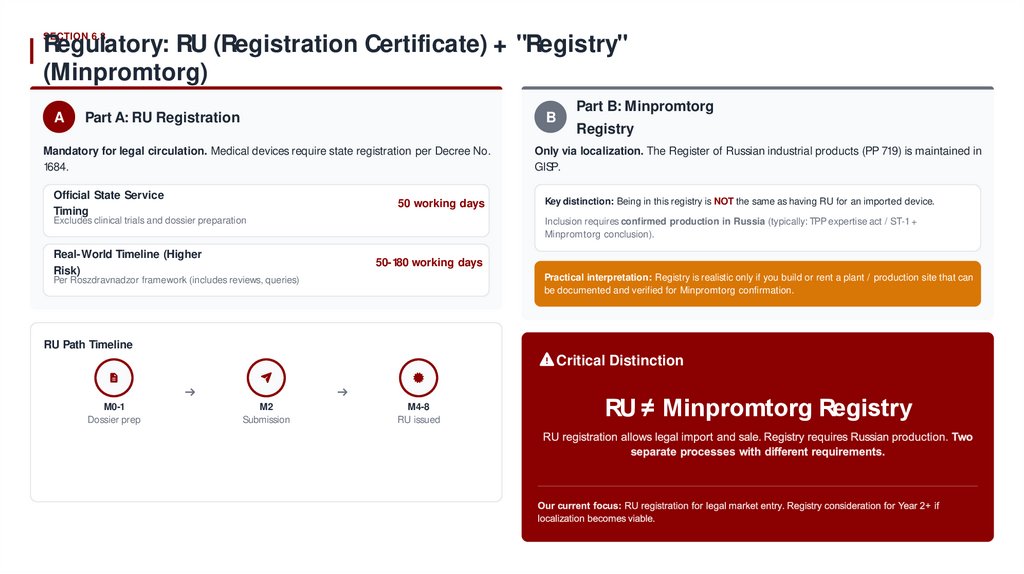
19.
SECTION 6.3Regulatory: RU (Registration Certificate) + "Registry"
(Minpromtorg)
A
Part A: RU Registration
B
Mandatory for legal circulation. Medical devices require state registration per Decree No.
1684.
Official State Service
Timing
50 working days
Excludes clinical trials and dossier preparation
Real-World Timeline (Higher
Risk)
Part B: Minpromtorg
Registry
Only via localization. The Register of Russian industrial products (PP 719) is maintained in
GISP.
Key distinction: Being in this registry is NOT the same as having RU for an imported device.
Inclusion requires confirmed production in Russia (typically: TPP expertise act / ST-1 +
Minpromtorg conclusion).
50-180 working days
Practical interpretation: Registry is realistic only if you build or rent a plant / production site that can
be documented and verified for Minpromtorg confirmation.
Per Roszdravnadzor framework (includes reviews, queries)
RU Path Timeline
Critical Distinction
M0-1
Dossier prep
M2
Submission
M4-8
RU issued
RU ≠ Minpromtorg Registry
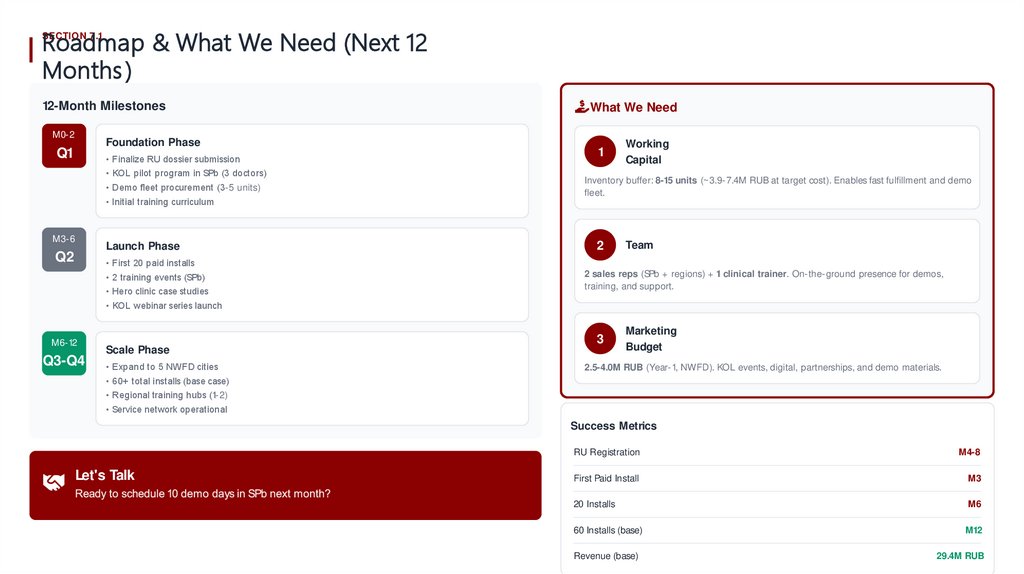
20.
Roadmap & What We Need (Next 12Months )
SECTION 7.1
12-Month Milestones
M0-2
Foundation Phase
Q1
• Finalize RU dossier submission
• KOL pilot program in SPb (3 doctors)
• Demo fleet procurement (3-5 units)
• Initial training curriculum
M3-6
Launch Phase
Q2
What We Need
1
Working
Capital
Inventory buffer: 8-15 units (~3.9-7.4M RUB at target cost). Enables fast fulfillment and demo
fleet.
2
Team
• First 20 paid installs
• 2 training events (SPb)
• Hero clinic case studies
2 sales reps (SPb + regions) + 1 clinical trainer. On-the-ground presence for demos,
training, and support.
• KOL webinar series launch
M6-12
Q3-Q4
Scale Phase
• Expand to 5 NWFD cities
3
Marketing
Budget
2.5-4.0M RUB (Year-1, NWFD). KOL events, digital, partnerships, and demo materials.
• 60+ total installs (base case)
• Regional training hubs (1-2)
• Service network operational
Success Metrics
Let's Talk
RU Registration
M4-8
First Paid Install
M3
20 Installs
M6
60 Installs (base)
M12
Revenue (base)
29.4M RUB