


 pedagogy
Similar presentations:


")
")


Quantitative data analysis and tools: Global Englishes and accents in international communication
1.
Warm-Up: Agree/Disagree corners“It is better to sound like a
native English speaker than to
be clearly understood in
international communication.”
2.
Quantitative data analysisand tools. Global Englishes
and accents in international
communication
G11, T3, W3, LP 3-4
3.
Lesson ObjectivesBy the end of the lesson, you will be able to:
- Identify quantitative data related to accents and Global
Englishes.
- Organise quantitative data using tables and basic
frequency counts.
4.
Assessment CriteriaYou have achieved:
- 11CT3.1, if you distinguish between quantitative and
qualitative statements, select appropriate survey
questions, and justify choices.
- 11RES3.2, if you accurately record, tally, and
calculate frequencies or percentages in a table.
5.
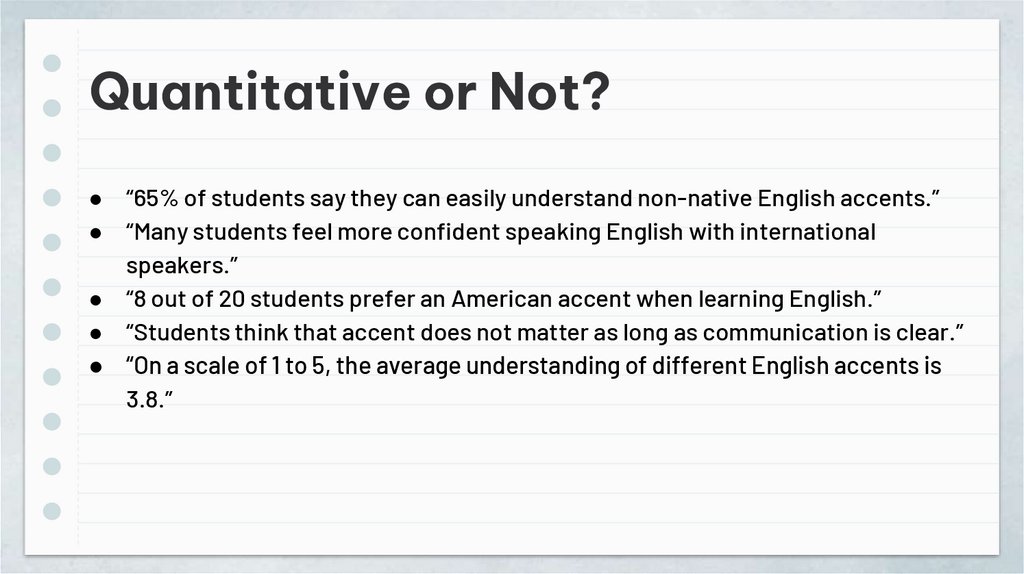
Quantitative or Not?● “65% of students say they can easily understand non-native English accents.”
● “Many students feel more confident speaking English with international
speakers.”
● “8 out of 20 students prefer an American accent when learning English.”
● “Students think that accent does not matter as long as communication is clear.”
● “On a scale of 1 to 5, the average understanding of different English accents is
3.8.”
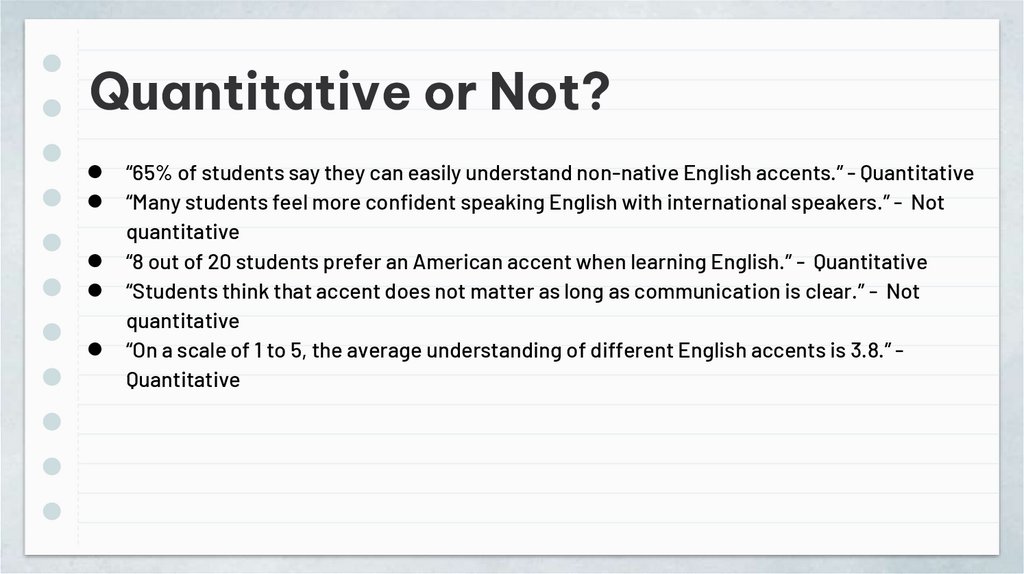
6.
Quantitative or Not?“65% of students say they can easily understand non-native English accents.” - Quantitative
“Many students feel more confident speaking English with international speakers.” - Not
quantitative
“8 out of 20 students prefer an American accent when learning English.” - Quantitative
“Students think that accent does not matter as long as communication is clear.” - Not
quantitative
“On a scale of 1 to 5, the average understanding of different English accents is 3.8.” Quantitative
7.
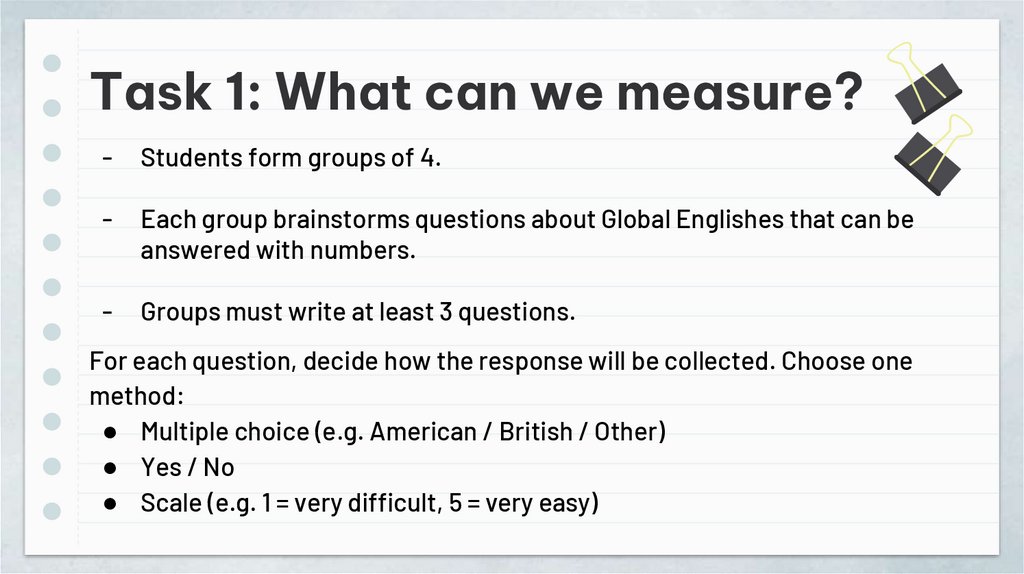
Task 1: What can we measure?-
Students form groups of 4.
-
Each group brainstorms questions about Global Englishes that can be
answered with numbers.
-
Groups must write at least 3 questions.
For each question, decide how the response will be collected. Choose one
method:
● Multiple choice (e.g. American / British / Other)
● Yes / No
● Scale (e.g. 1 = very difficult, 5 = very easy)
8.
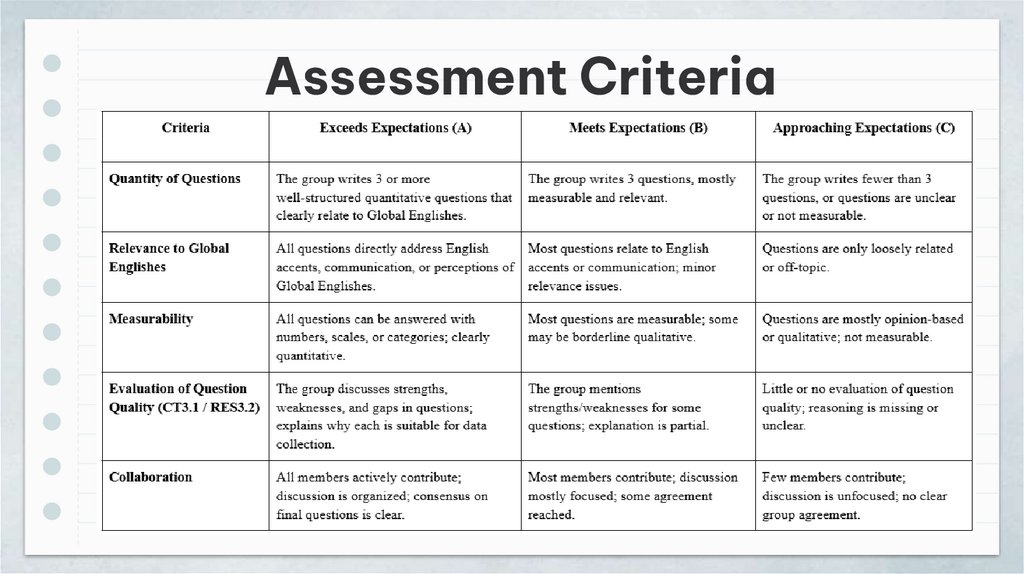
Assessment Criteria9.
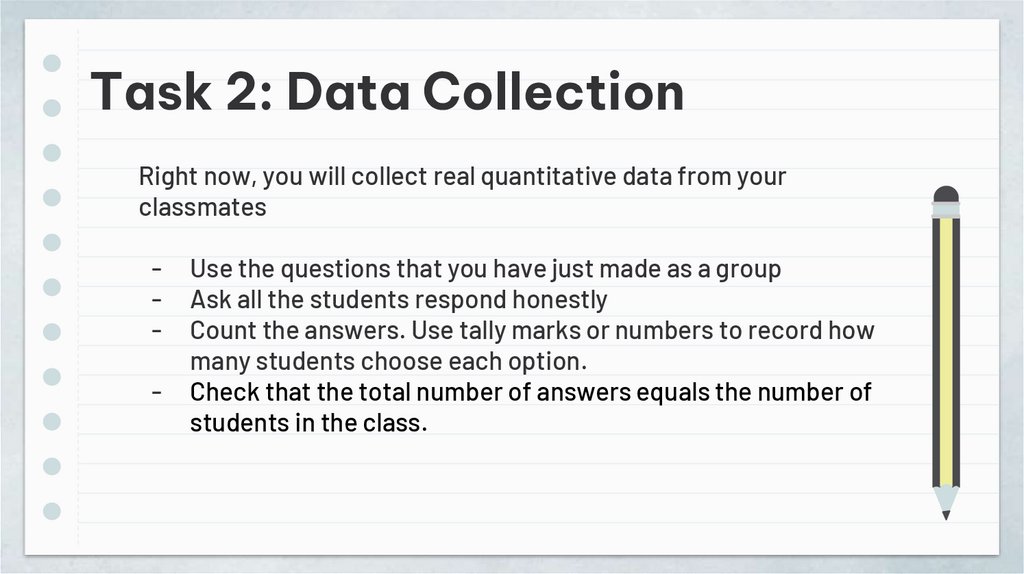
Task 2: Data CollectionRight now, you will collect real quantitative data from your
classmates
-
Use the questions that you have just made as a group
Ask all the students respond honestly
Count the answers. Use tally marks or numbers to record how
many students choose each option.
Check that the total number of answers equals the number of
students in the class.
10.
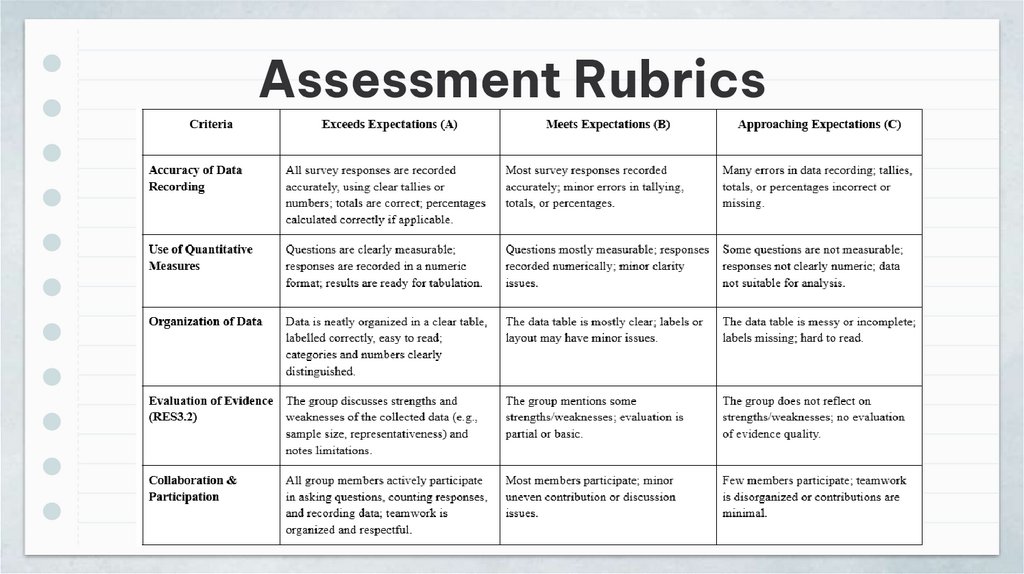
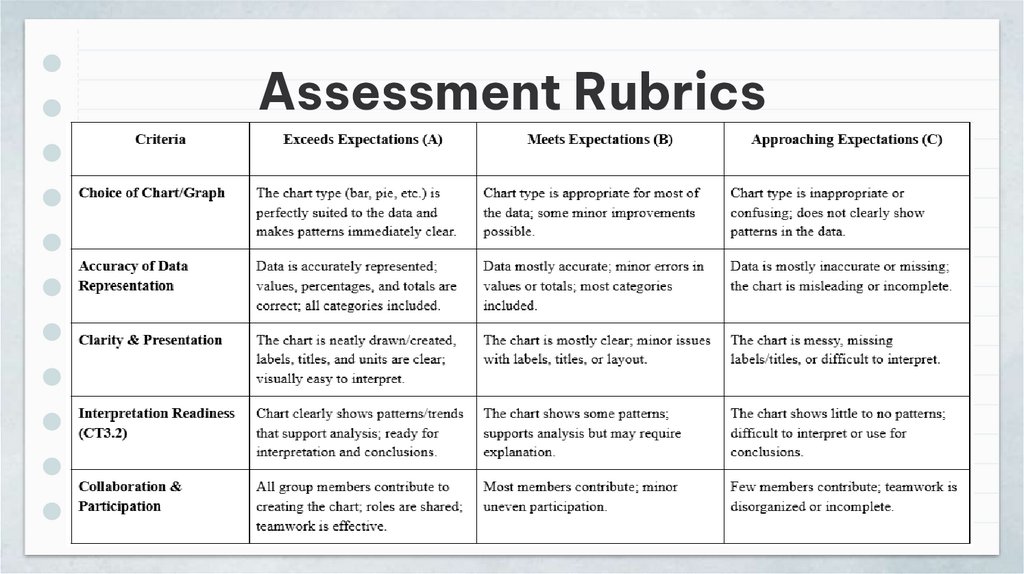
Assessment Rubrics11.
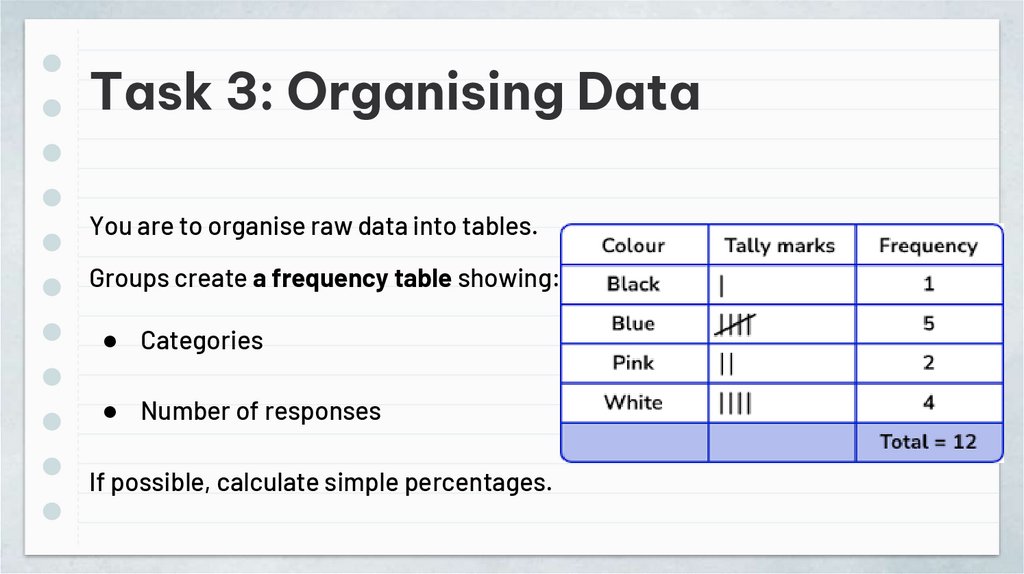
Task 3: Organising DataYou are to organise raw data into tables.
Groups create a frequency table showing:
● Categories
● Number of responses
If possible, calculate simple percentages.
12.
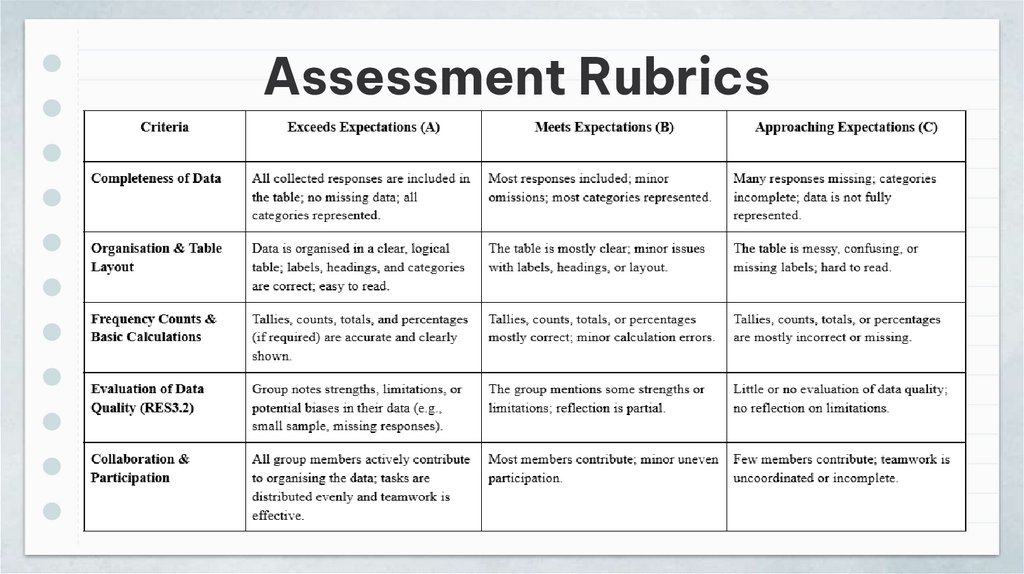
Assessment Rubrics13.
Reflection● “One thing this data shows about accents is…”
14.
Lesson ObjectivesBy the end of the lesson, you will be able to:
● Analyse quantitative data using charts and basic
statistics.
● Interpret findings about Global Englishes in international
communication.
15.
Assessment CriteriaYou have achieved:
● 11CT3.2, if you select the right chart type, create a
clear chart, and calculate basic statistics.
● 11CO3.1, if you describe patterns, draw
conclusions, and relate them to Global Englishes
and communication.
16.
Lead-In: Data Gallery WalkGroup tables are displayed around the room.
Walk in pairs and write:
● One interesting number
● One question you have
17.
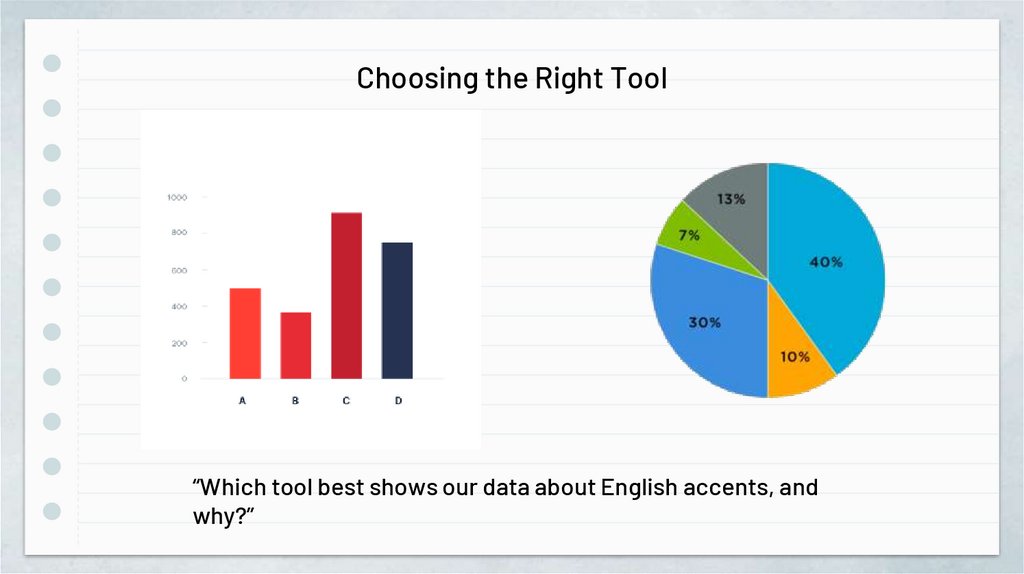
Choosing the Right Tool“Which tool best shows our data about English accents, and
why?”
18.
Task 1.Create charts from their data.
1. Groups draw charts on paper or use digital tools.
2. Charts must include:
○ Title
○ Labels
○ Clear data values
19.
Assessment Rubrics20.
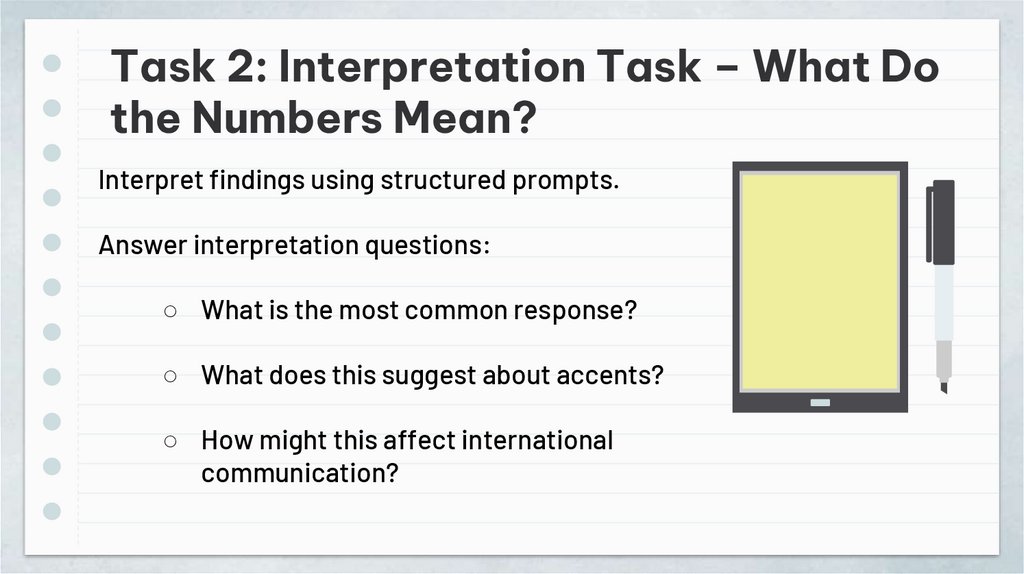
Task 2: Interpretation Task – What Dothe Numbers Mean?
Interpret findings using structured prompts.
Answer interpretation questions:
○ What is the most common response?
○ What does this suggest about accents?
○ How might this affect international
communication?
21.
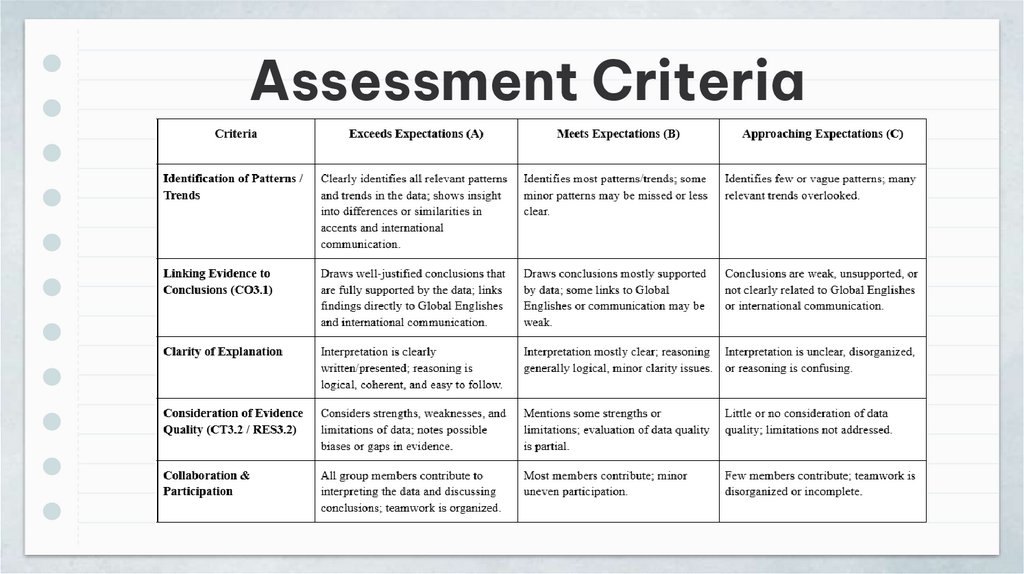
Assessment Criteria22.
Mini-presentationEach group presents:
● Their chart
● One key conclusion
23.
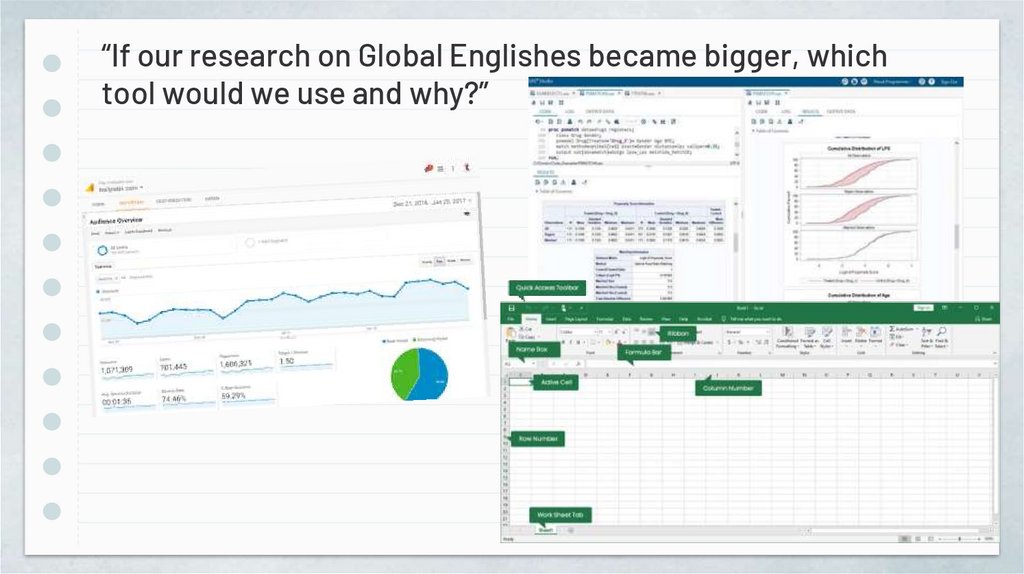
“If our research on Global Englishes became bigger, whichtool would we use and why?”
24.
Quantitative DataAnalysis Tools
You are researchers studying Global Englishes and accents in
international communication.
You will:
1. Read the description of data analysis tools.
2. Read a research scenario.
3. Decide:
○ Which tool fits the scenario best
○ Why the tool is suitable
25.
Reflection- One thing the data taught me about
Global Englishes
- One question I still have about accents
and communication