


 economics
Similar presentations:


")
Analysis of success on Grant projects in Russia
1. Analysis of success on Grant projects in Russia
Higher School of EconomicsIBBE’29
Economic statistic project
Analysis of success on Grant projects
in Russia
Golushchenko Zakhar, Kirill Makarchuk, Mark Marutyants, Kirill Nikitchenko, Orekhova Aisiya,
Egor Perov, Alexander Poshnevsky, Strekalina Taisiya
Saint-Petersburg
2025
2. Introduction
Higher School of EconomicsIBBE’29
Economic statistic project
Analysis of success on Grant projects in
Russia
2
Introduction
The allocation of federal funding for regional development projects remains one of
the most critical challenges in public policy and economic development. Each year,
thousands of projects compete for limited federal resources, requiring systematic
evaluation mechanisms to identify the highest-value initiatives. The Russian Federal
Grant Competition represents a large-scale governmental initiative designed to
identify, evaluate, and fund promising regional development proposals across
multiple development directions and geographic regions.
This project examines a comprehensive dataset of 20,296 federal grant
applications submitted during the 2025 competition cycle, analyzing the factors that
influence project success, funding allocation patterns, and expert evaluation
systems. Understanding these patterns is essential for policymakers, project
developers, and funding administrators seeking to optimize resource allocation and
improve the competitive evaluation process.
3. Dataset
Higher School of EconomicsIBBE’29
Economic statistic project
Analysis of success on Grant projects in
Russia
3
Dataset
Dataset Name:
«Проекты конкурса Фонда президентских грантов c 2017 года» (2017-2025)
Source URL: https://tochno.st/pres_grants
We analyzed Data only from 2025 year
The dataset was assembled to provide open, machine-readable information about all projects of
Russian non-profit organizations that applied to the Presidential Grants Foundation
competitions from 2017–2025, including their characteristics, financial indicators, and
competition results.
The unit of observation is a single project application submitted by a non-profit organization to
the Presidential Grants Foundation competition
The data were extracted from the public website of the Presidential Grants Foundation,
which publishes information on all projects submitted to its grant competitions. The dataTotal Applications: 20,296 projects
processing organization «Если быть точным» (“To Be Precise”) downloaded and
consolidated these records into a single structured dataset in CSV/XLSX/PARQUET
Successful Projects (Winners): 3,080 (15.7%)
formats.
Unsuccessful Projects (Non-Winners): 16,149 (78.6%)
The dataset was assembled to provide open, machine-readable information about all
projects of Russian non-profit organizations that applied to the Presidential Grants
Foundation competitions from 2017–2025, including their characteristics, financial
indicators, and competition results.
Missing/Incomplete Data: 1,067 projects (5.2%)
Average Expert Rating: 70.02 (range: 63.00-89.75)
Average Requested Funding: ₽10,998,702
Average Total Allocation: ₽3,023,251
Mean Funding Ratio: 43%
4.
Variables descriptionEconomic statistic project
Analysis of success on Grant projects in
Russia
4
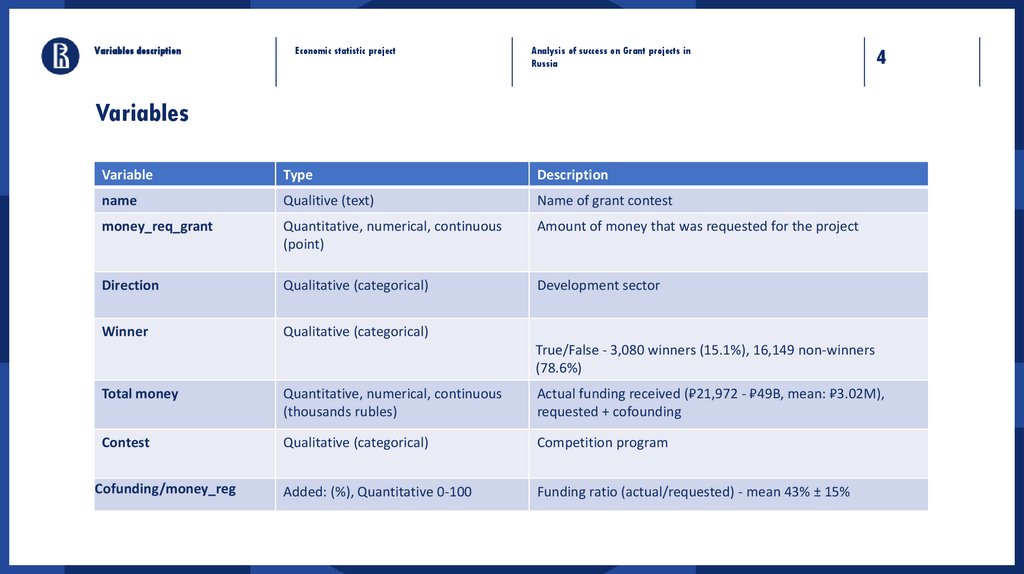
Variables
Variable
Type
Description
name
Qualitive (text)
Name of grant contest
money_req_grant
Quantitative, numerical, continuous
(point)
Amount of money that was requested for the project
Direction
Qualitative (categorical)
Development sector
Winner
Qualitative (categorical)
True/False - 3,080 winners (15.1%), 16,149 non-winners
(78.6%)
Total money
Quantitative, numerical, continuous
(thousands rubles)
Actual funding received (₽21,972 - ₽49B, mean: ₽3.02M),
requested + cofounding
Contest
Qualitative (categorical)
Competition program
Cofunding/money_reg
Added: (%), Quantitative 0-100
Funding ratio (actual/requested) - mean 43% ± 15%
5.
Higher School of EconomicsIBBE’29
Economic statistic project
5
Analysis of success on Grant projects in
Russia
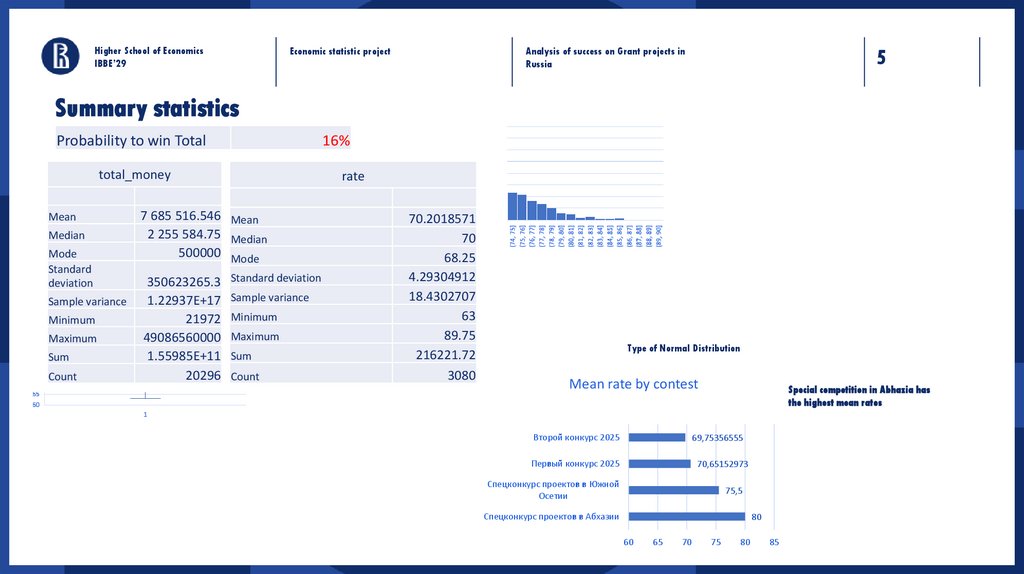
Summary statistics
Probability to win Total
total_money
Mean
Median
Mode
Standard
deviation
Sample variance
Minimum
Maximum
Sum
Count
7 685 516.546 Mean
2 255 584.75 Median
500000 Mode
350623265.3 Standard deviation
1.22937E+17 Sample variance
21972 Minimum
49086560000 Maximum
1.55985E+11 Sum
20296 Count
16%
rate
70.2018571
70
68.25
4.29304912
18.4302707
63
89.75
216221.72
3080
Type of Normal Distribution
Mean rate by contest
Special competition in Abhazia has
the highest mean rates
Второй конкурс 2025
69,75356555
Первый конкурс 2025
70,65152973
Спецконкурс проектов в Южной
Осетии
75,5
Спецконкурс проектов в Абхазии
80
60
65
70
75
80
85
6. 1 Research question Does the average requested funding differ significantly between winning and non-winning projects?
Higher School of EconomicsIBBE’29
Economic statistic project
6
Analysis of success on Grant projects in
Russia
1 Research question
Does the average requested funding differ significantly between winning and non-winning
projects?
Requested money
H₀ (Null): μ(Winners) = μ(Non-Winners)
The mean requested funding amount is equal between winning and
non-winning projects.
7 000 000,00 ₽
6 000 000,00 ₽
5 000 000,00 ₽
H₁ (Alternative): μ(Winners) ≠ μ(Non-Winners)
Winning and non-winning projects request significantly different
mean funding amounts.
Groups
Not Winner
Wiiner
Count
Sum
16149 96334998206
3080 9065300188
Mean
5965384.742
2943279.282
5 965 384,74 ₽
4 000 000,00 ₽
2 943 279,28 ₽
3 000 000,00 ₽
2 000 000,00 ₽
Variation
1.50907E+17
2.367E+13
1 000 000,00 ₽
- ₽
Variation analysis
source
SS
between
2.36243E+16
within
2.43692E+21
total
2.43695E+21
Not Winner
df
1
19227
19228
MS
2.36243E+16
1.26745E+17
F
0.186392506
P-value
F significant
0.66594106 3.84194252
H1 has been
refuted
Wiiner
7. Regression and correlation Analysis - Predicting Winning Status from specs
Higher School of EconomicsIBBE’29
Economic statistic project
7
Analysis of success on Grant projects in
Russia
Regression and correlation Analysis - Predicting Winning Status from specs
Correlation between cofunding and rate
Correlation between money_req and rate
0.31527541 Regression Regression
0.21692385
Correlation between total_money and rate
0.28964039
Probability to win (%)
30%
25%
20%
Y-intercept
Money
Requested
15%
10%
5%
multiplicators
68.5820083
7.0223E-07
Statistics
Multiple R
R-square
Adjusted R
Square
Standard
Error
Observations
standard
error
t-stat
0.11929506 574.893945
4.0162E-08
17.4849211
0.31527541
0.09939859
0.09907346
4.0493824
2772
P-value
0
5.10796E-65
0%
rate=68.582+7.0223×10^(−7)*money_req
Probability to win (%)
8. Conclusion
Higher School of EconomicsIBBE’29
Economic statistic project
Analysis of success on Grant projects in
Russia
Conclusion
The overall probability of winning is low (about 15-16%), and ANOVA shows that winners do not request systematically more or
less money than non-winners, so requested amount alone does not determine success.
Expert ratings are positively but weakly correlated with requested and total funding (correlations around 0.29–0.32), and the
regression