 medicine
Similar presentations:


Gyn model summary. Risk Stratification Model for Operative Incisional Hernia in Ob-Gyn Cohort
1.
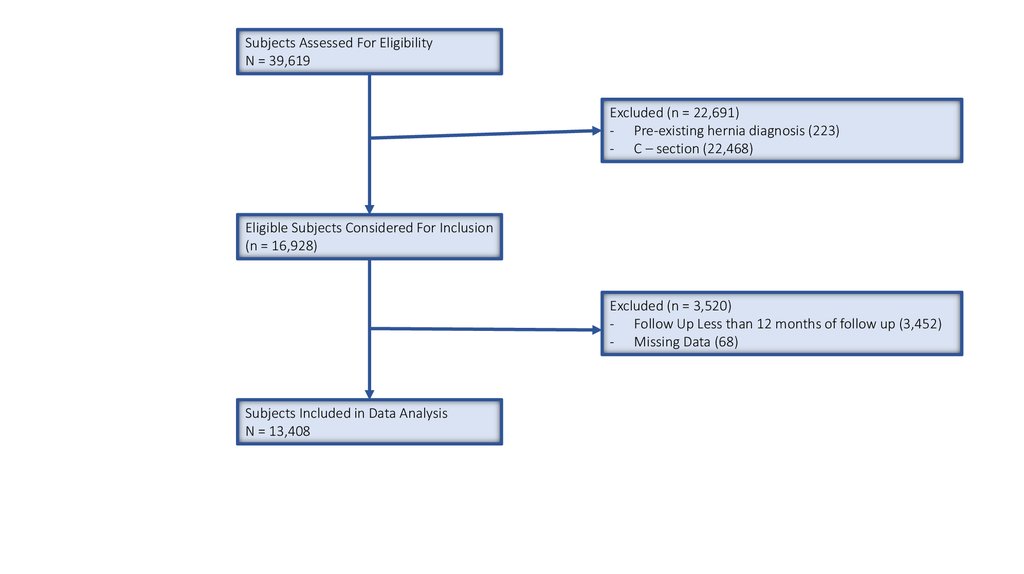
Subjects Assessed For EligibilityN = 39,619
Excluded (n = 22,691)
- Pre-existing hernia diagnosis (223)
- C – section (22,468)
Eligible Subjects Considered For Inclusion
(n = 16,928)
Excluded (n = 3,520)
- Follow Up Less than 12 months of follow up (3,452)
- Missing Data (68)
Subjects Included in Data Analysis
N = 13,408
2.
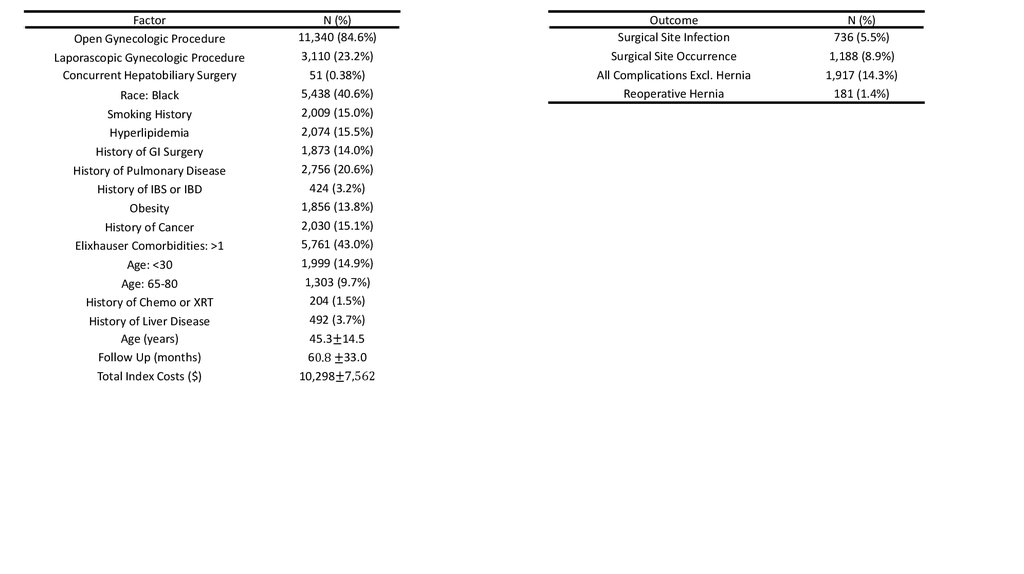
FactorOpen Gynecologic Procedure
Laporascopic Gynecologic Procedure
Concurrent Hepatobiliary Surgery
Race: Black
Smoking History
Hyperlipidemia
History of GI Surgery
History of Pulmonary Disease
History of IBS or IBD
Obesity
History of Cancer
Elixhauser Comorbidities: >1
Age: <30
Age: 65-80
History of Chemo or XRT
History of Liver Disease
Age (years)
Follow Up (months)
Total Index Costs ($)
N (%)
11,340 (84.6%)
3,110 (23.2%)
51 (0.38%)
5,438 (40.6%)
2,009 (15.0%)
2,074 (15.5%)
1,873 (14.0%)
2,756 (20.6%)
424 (3.2%)
1,856 (13.8%)
2,030 (15.1%)
5,761 (43.0%)
1,999 (14.9%)
1,303 (9.7%)
204 (1.5%)
492 (3.7%)
45.3±14.5
60.8 ±33.0
10,298±7,562
Outcome
Surgical Site Infection
Surgical Site Occurrence
All Complications Excl. Hernia
Reoperative Hernia
N (%)
736 (5.5%)
1,188 (8.9%)
1,917 (14.3%)
181 (1.4%)
3.
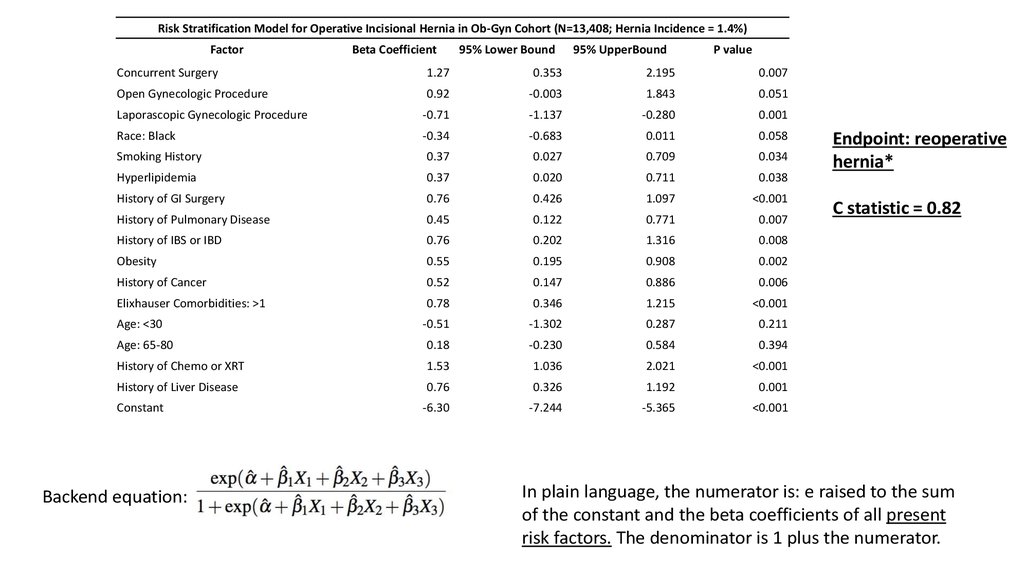
Risk Stratification Model for Operative Incisional Hernia in Ob-Gyn Cohort (N=13,408; Hernia Incidence = 1.4%)Factor
Beta Coefficient
95% Lower Bound
95% UpperBound
P value
Concurrent Surgery
1.27
0.353
2.195
0.007
Open Gynecologic Procedure
0.92
-0.003
1.843
0.051
Laporascopic Gynecologic Procedure
-0.71
-1.137
-0.280
0.001
Race: Black
-0.34
-0.683
0.011
0.058
Smoking History
0.37
0.027
0.709
0.034
Hyperlipidemia
0.37
0.020
0.711
0.038
History of GI Surgery
0.76
0.426
1.097
<0.001
History of Pulmonary Disease
0.45
0.122
0.771
0.007
History of IBS or IBD
0.76
0.202
1.316
0.008
Obesity
0.55
0.195
0.908
0.002
History of Cancer
0.52
0.147
0.886
0.006
Elixhauser Comorbidities: >1
0.78
0.346
1.215
<0.001
-0.51
-1.302
0.287
0.211
Age: 65-80
0.18
-0.230
0.584
0.394
History of Chemo or XRT
1.53
1.036
2.021
<0.001
History of Liver Disease
0.76
0.326
1.192
0.001
-6.30
-7.244
-5.365
<0.001
Age: <30
Constant
Backend equation:
Endpoint: reoperative
hernia*
C statistic = 0.82
In plain language, the numerator is: e raised to the sum
of the constant and the beta coefficients of all present
risk factors. The denominator is 1 plus the numerator.
4.
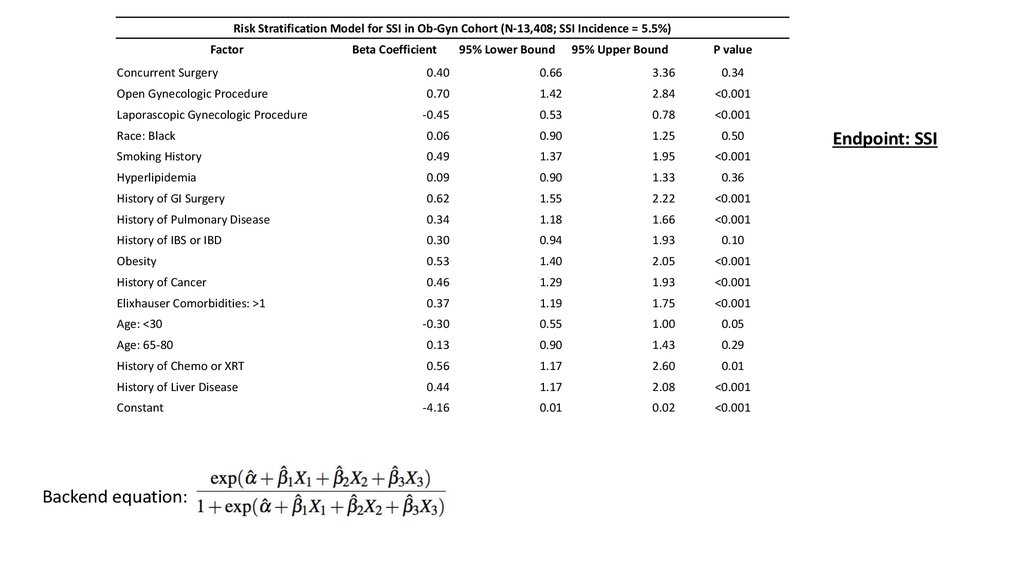
Risk Stratification Model for SSI in Ob-Gyn Cohort (N-13,408; SSI Incidence = 5.5%)Factor
Beta Coefficient
95% Lower Bound
95% Upper Bound
P value
Concurrent Surgery
0.40
0.66
3.36
0.34
Open Gynecologic Procedure
0.70
1.42
2.84
<0.001
-0.45
0.53
0.78
<0.001
Race: Black
0.06
0.90
1.25
0.50
Smoking History
0.49
1.37
1.95
<0.001
Hyperlipidemia
0.09
0.90
1.33
0.36
History of GI Surgery
0.62
1.55
2.22
<0.001
History of Pulmonary Disease
0.34
1.18
1.66
<0.001
History of IBS or IBD
0.30
0.94
1.93
0.10
Obesity
0.53
1.40
2.05
<0.001
History of Cancer
0.46
1.29
1.93
<0.001
Elixhauser Comorbidities: >1
0.37
1.19
1.75
<0.001
-0.30
0.55
1.00
0.05
Age: 65-80
0.13
0.90
1.43
0.29
History of Chemo or XRT
0.56
1.17
2.60
0.01
History of Liver Disease
0.44
1.17
2.08
<0.001
-4.16
0.01
0.02
<0.001
Laporascopic Gynecologic Procedure
Age: <30
Constant
Backend equation:
Endpoint: SSI
5.
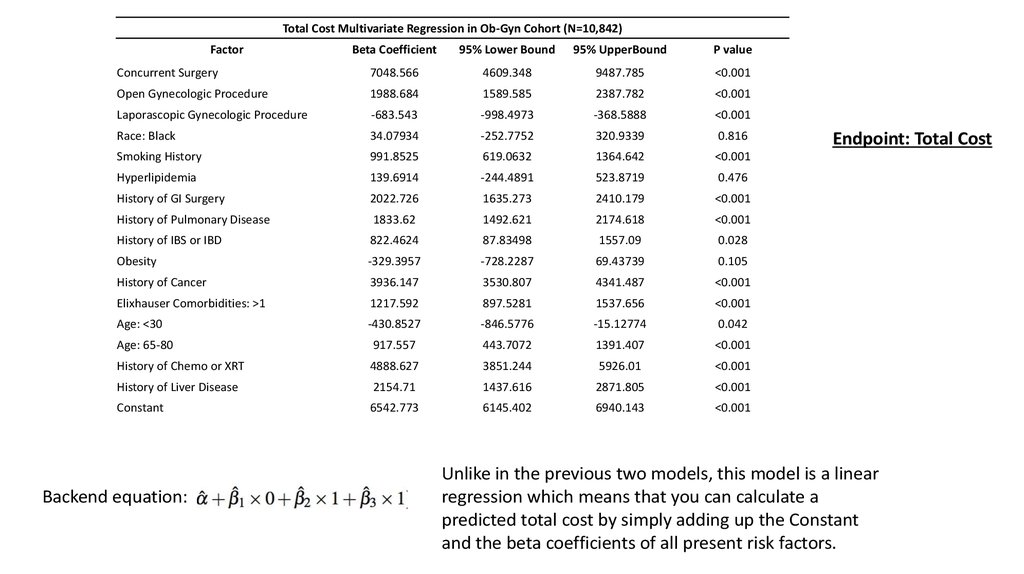
Total Cost Multivariate Regression in Ob-Gyn Cohort (N=10,842)Factor
Beta Coefficient
95% Lower Bound
95% UpperBound
P value
Concurrent Surgery
7048.566
4609.348
9487.785
<0.001
Open Gynecologic Procedure
1988.684
1589.585
2387.782
<0.001
Laporascopic Gynecologic Procedure
-683.543
-998.4973
-368.5888
<0.001
Race: Black
34.07934
-252.7752
320.9339
0.816
Smoking History
991.8525
619.0632
1364.642
<0.001
Hyperlipidemia
139.6914
-244.4891
523.8719
0.476
History of GI Surgery
2022.726
1635.273
2410.179
<0.001
History of Pulmonary Disease
1833.62
1492.621
2174.618
<0.001
History of IBS or IBD
822.4624
87.83498
1557.09
0.028
Obesity
-329.3957
-728.2287
69.43739
0.105
History of Cancer
3936.147
3530.807
4341.487
<0.001
Elixhauser Comorbidities: >1
1217.592
897.5281
1537.656
<0.001
Age: <30
-430.8527
-846.5776
-15.12774
0.042
Age: 65-80
917.557
443.7072
1391.407
<0.001
History of Chemo or XRT
4888.627
3851.244
5926.01
<0.001
History of Liver Disease
2154.71
1437.616
2871.805
<0.001
Constant
6542.773
6145.402
6940.143
<0.001
Backend equation:
Endpoint: Total Cost
Unlike in the previous two models, this model is a linear
regression which means that you can calculate a
predicted total cost by simply adding up the Constant
and the beta coefficients of all present risk factors.
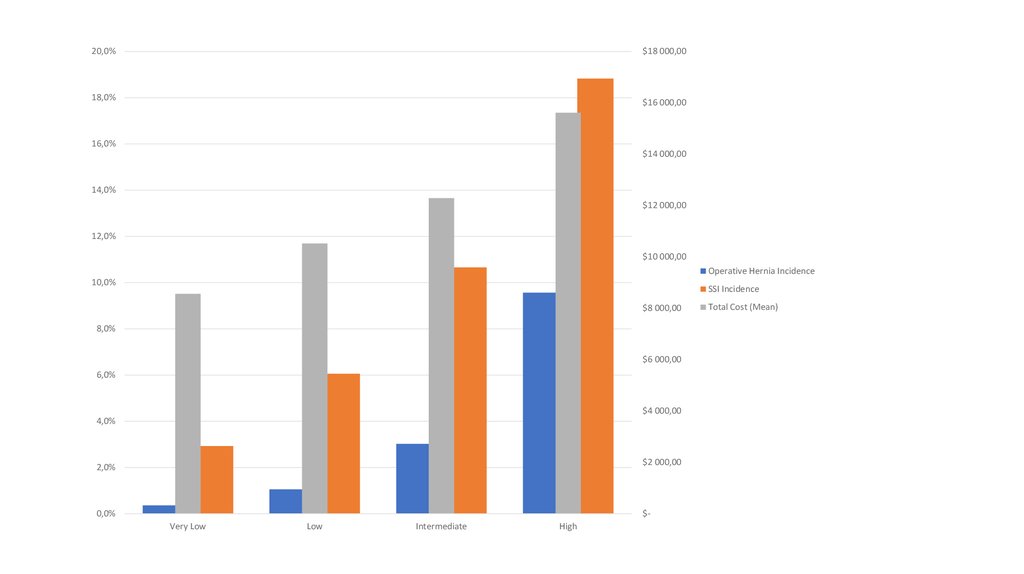
6.
20,0%$18 000,00
18,0%
$16 000,00
16,0%
$14 000,00
14,0%
$12 000,00
12,0%
$10 000,00
Operative Hernia Incidence
10,0%
SSI Incidence
$8 000,00
8,0%
$6 000,00
6,0%
$4 000,00
4,0%
$2 000,00
2,0%
0,0%
$Very Low
Low
Intermediate
High
Total Cost (Mean)