


 Study")


 Studies")


 1. Mantel Haenszel Method 2.")


 medicine
Similar presentations:


Observational Studies: Cohort and Cross-sectional Designs Byron crape
1. Observational Studies: Cohort and Cross-sectional Designs Byron crape
Biostatistics and Critical AssessementNUSOM 2023
OBSERVATIONAL STUDIES:
COHORT AND CROSSSECTIONAL DESIGNS
BYRON CRAPE
2. Learning Outcomes
LEARNING OUTCOMESBy the end of this session you will be able to
1. Design epidemiological drug cohort and crosssectional studies to answer research questions.
2. Conduct critiques of cohort and cross-sectional
study designs in peer-reviewed epidemiological
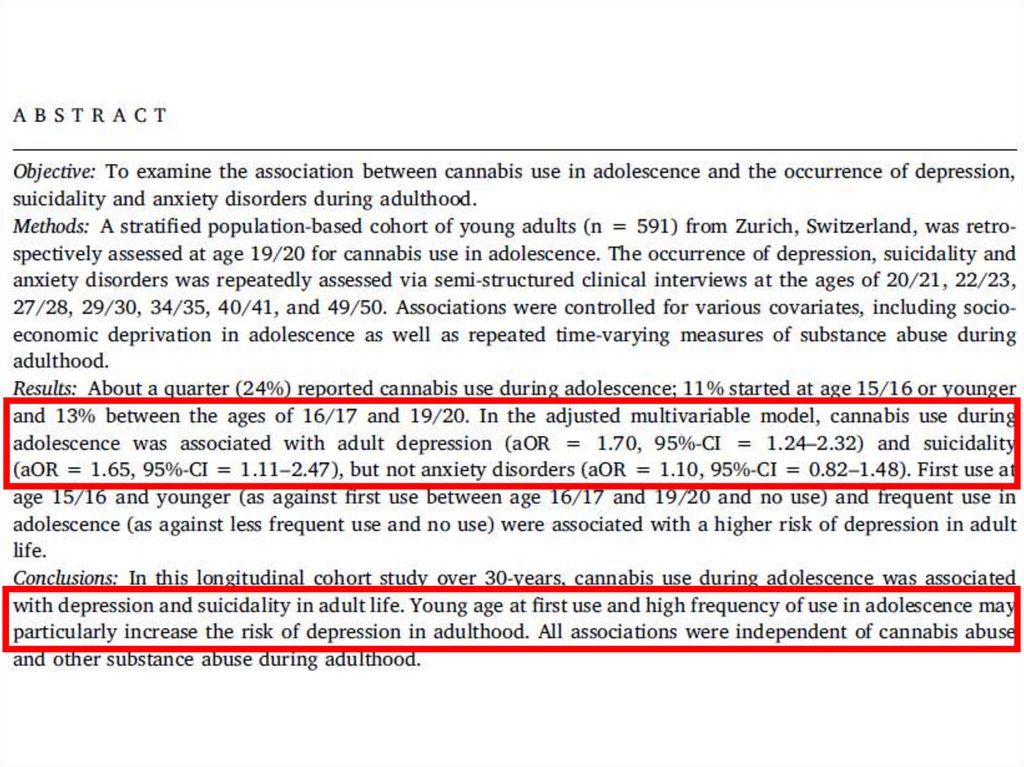
journal drug study articles.
3. Interpret and describe cohort and cross-
sectional studies to various audiences.
3.
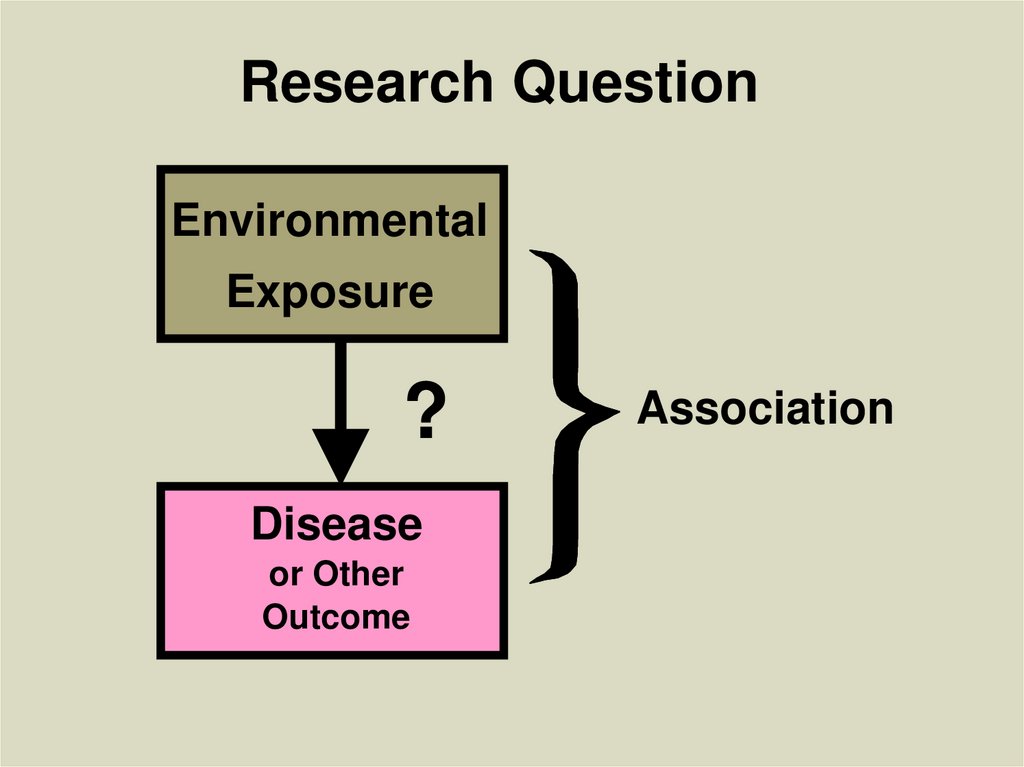
Research QuestionEnvironmental
Exposure
?
Disease
or Other
Outcome
Association
4.
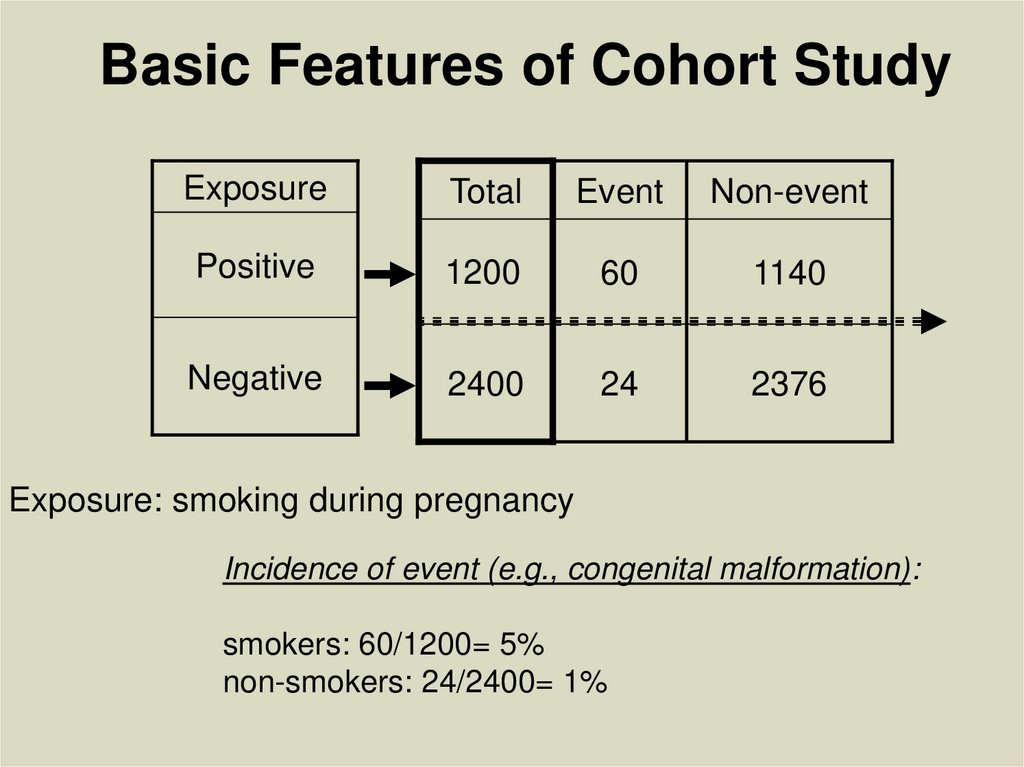
Basic Features of Cohort StudyExposure
Total
Event
Non-event
Positive
1200
60
1140
Negative
2400
24
2376
Exposure: smoking during pregnancy
Incidence of event (e.g., congenital malformation):
smokers: 60/1200= 5%
non-smokers: 24/2400= 1%
5. Some Potential Hypotheses Addressed with a Cohort Design
• Does a diet high in fat increase breastcancer risk?
• Does passive smoking cause lung
cancer?
• Do breast implants cause connective
tissue disease?
• Do cell phones cause brain cancer?
6. Atherosclerosis Risk in Communities (ARIC) Study
• Cohort (prospective) concurrent study to examine riskfactors for subclinical and clinical atherosclerotic diseases
• Approximately 16,000 persons aged 45-64 yrs at baseline
(1987-89)
• Multi-center: Jackson (all African-American), Forsyth County,
NC (about 15% African-American), Minneapolis (mostly white)
and Washington County, MD (mostly white)
• Follow-up approaches: Periodic visits to ARIC clinic (4 visits
every 3 years); Annual telephone interviews; Hospital chart
and death certificate reviews
7. The 2x2 Table
DiseaseNo
Disease
Exposed
Totals
A
B
A+B
Not
Exposed
C
D
C+D
Disease
Totals
A+C
B+D
A+B+C+D
Exposed
8. Determining the Cohort
PopulationPeople
without
DISEASE at
baseline
9. Determining Exposure
DetermineExposure Status
yes
Exposed
Defined
Population
People
without
DISEASE at
baseline
no
Unexposed
10. Determining Disease Status
1. DetermineExposure Status
2. Determine
Disease Status
yes
Defined
Population
People
without
DISEASE at
baseline
followed over
a time period
Exposed
yes
Disease
no
No Disease
yes
no
Disease
Unexposed
no
No Disease
11. The 2x2 Table for Calculating Incidence of Disease
IncidenceNo
Expose
Disease
of
Disease d Totals
Disease
Exposed
A
B
A+B
A
A B
Not
Exposed
C
D
C+D
C
C D
12. If Exposure is Associated with Disease, then we would expect
Exposed:Disease
EXPOSED
Exposed:No Disease
NOT
EXPOSED
Not Exposed:Disease
Not Exposed:No Disease
13. Example
CHD*Exposed Incidence
No CHD
Totals
per 1,000
Smoke
Cigarettes
84
2,916
3,000
28.0
Do Not
Smoke
Cigarettes
87
4,913
5,000
17.4
* CHD = Coronary Heart Disease
14. Types of Cohort Studies
• Prospective or Concurrent• Retrospective or Historical
• Mixed
15. Prospective Cohort Study
DiseaseDefined
Population
People
without
DISEASE at
baseline
followed over
a time period
EXPOSED
No Disease
NOT
EXPOSED
No Disease
YEAR
2004
Investigator
Starts Study
Disease
2006
Complete Classifying
Exposure Status
2016
Follow-up for
Disease Outcome
16.
17.
18.
19.
20.
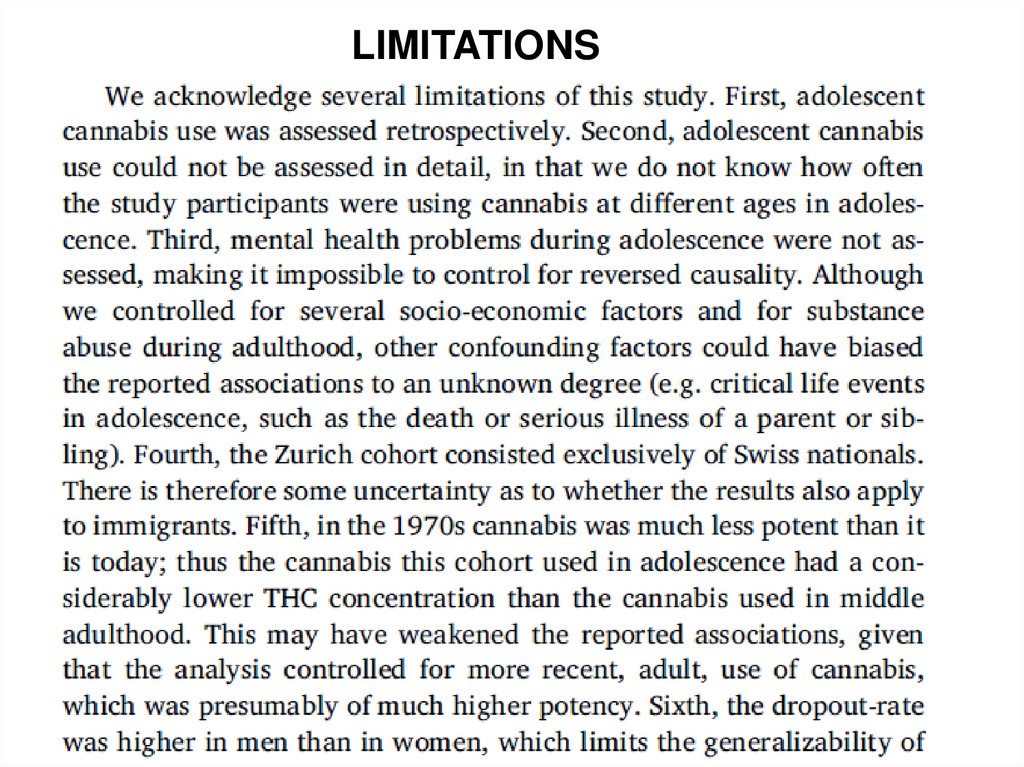
LIMITATIONS21. Historical Cohort Study
DiseaseDefined
Population
People
without
DISEASE at
baseline
followed over
a time period
EXPOSED
No Disease
NOT
EXPOSED
Disease
No Disease
YEAR
1984
Investigator Defines
Starting Time for
Study Population
1986
Use Historic
Records to
Classify Exposure
2004
2006
Disease
Study
Outcome Begins
22.
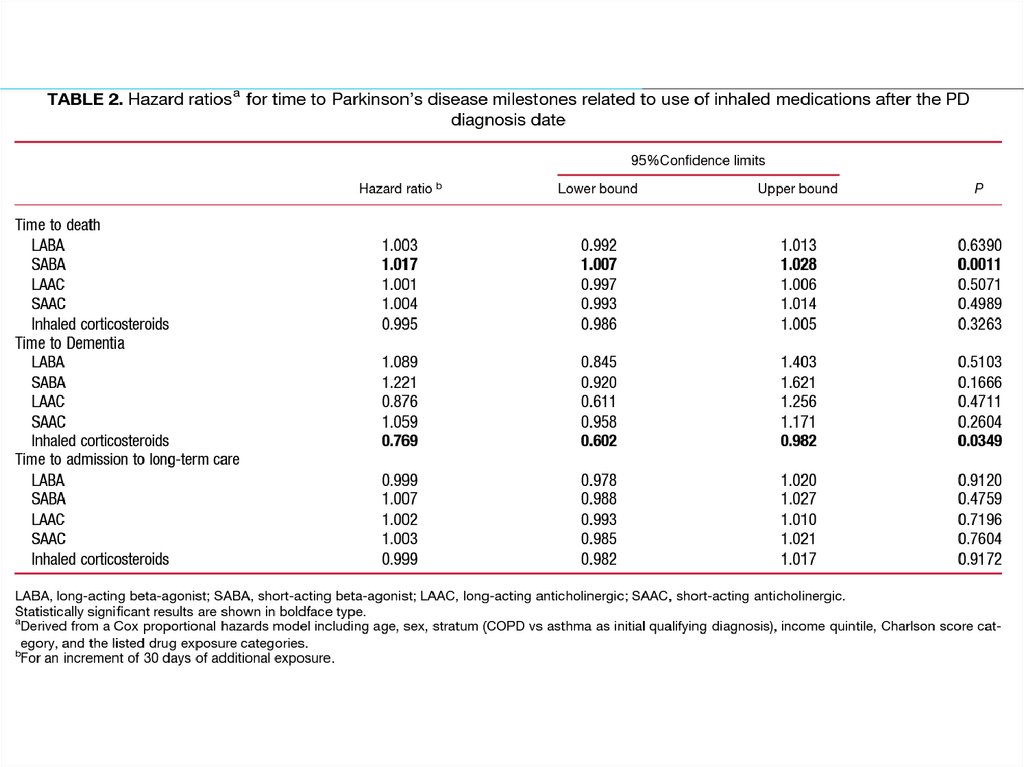
Movement Disorders, Vol. 35, No. 7, 202023.
24.
25. 1940’s The Framingham Study
1. ObjectiveTo study the impact of several factors on
incidence of cardiovascular diseases
2. Exposures Studied
Smoking, Diet/Cholesterol Levels,
Physical Activity, Blood Pressure
3. Multiple Outcomes
Coronary Heart Disease, Stroke,
Myocardial Infarction, Congestive Heart
Failure, Peripheral Artery Disease, etc.
26. The Famed Framingham Research Center
27. Original 1940s Framingham Study Objectives
1. CVD incidence increases with age though itoccurs earlier and more frequently in males.
2. Persons with high blood pressure develop
CVD at a greater rate than those who are
normotensive
3. Elevated cholesterol levels are associated
with increased risk of CVD
4. Tobacco smoking and habitual consumption
of alcohol are associated with increased
incidence of CVD.
28.
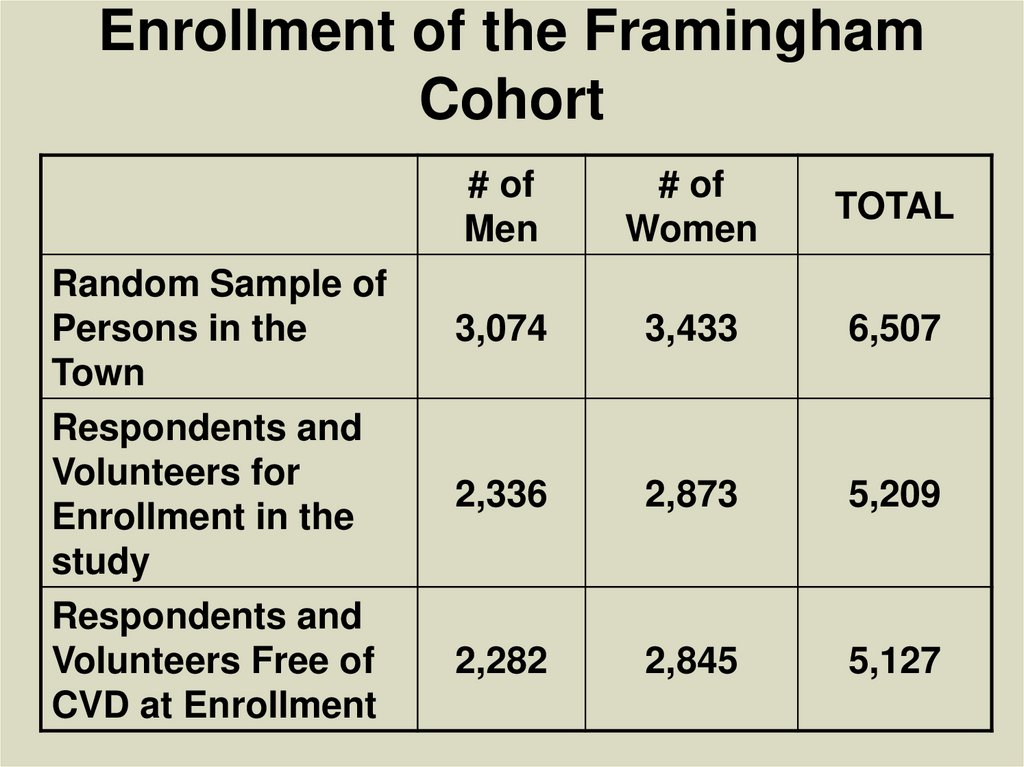
Enrollment of the FraminghamCohort
Random Sample of
Persons in the
Town
Respondents and
Volunteers for
Enrollment in the
study
Respondents and
Volunteers Free of
CVD at Enrollment
# of
Men
# of
Women
TOTAL
3,074
3,433
6,507
2,336
2,873
5,209
2,282
2,845
5,127
29.
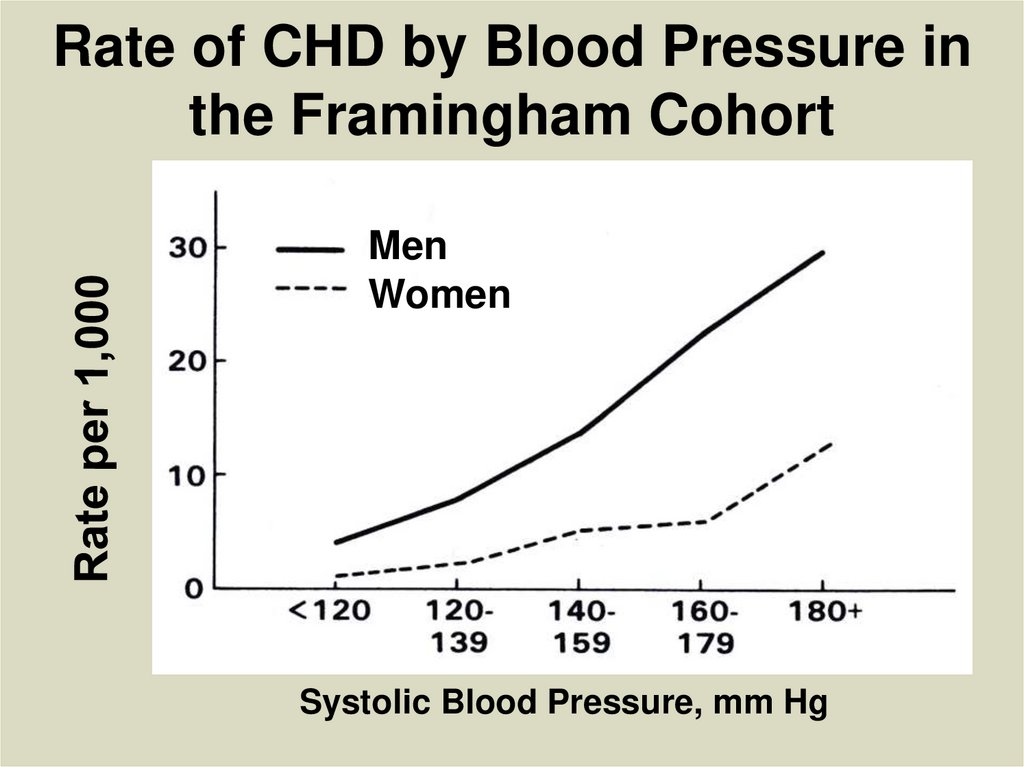
Rate of CHD by Blood Pressure inthe Framingham Cohort
Men
Women
Systolic Blood Pressure, mm Hg
30.
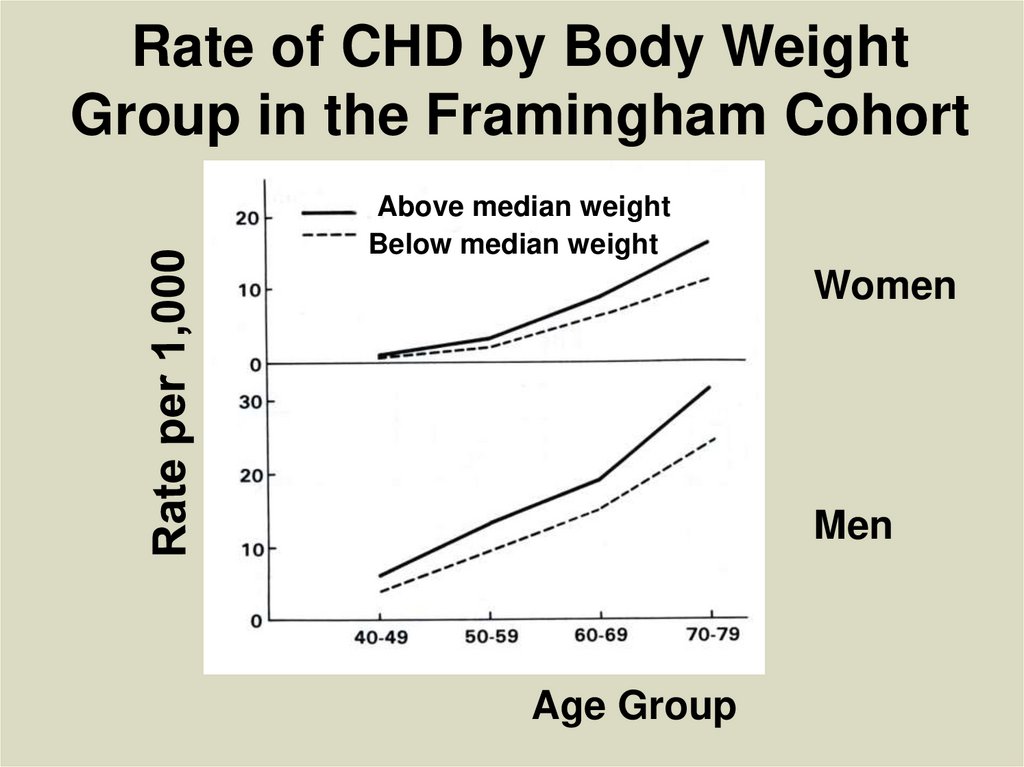
Rate of CHD by Body WeightGroup in the Framingham Cohort
Above median weight
Below median weight
Women
Men
Age Group
31. CHD Risk by Cholesterol Status
32
1
0
Low HDL
(< 26 mg/dl)
Low
Medium
Normal HDL
(27 to 56 mg/dl)
High
High HDL
(57 to 86 mg/dl)
32.
In more recent years research hasfocused on risk scales, biomarkers
and genetic studies.
Useful for future new targets for
pharmaceutical interventions and
the development of personalized or
precision medicine
33.
34.
35.
36.
37. Some Exposure Factors Change Over Time
38. Other Trends That Can Change Over Time
39. Problems in Cohort Studies
1. Selection issues: how participants arerecruited
2. Information: how measures are
performed
3. Outcome assessments: how disease is
diagnosed, observational time
4. Non-responses: Patterns of involvement
5. Analysis issues: Changes in statistical
methods
40.
41.
42.
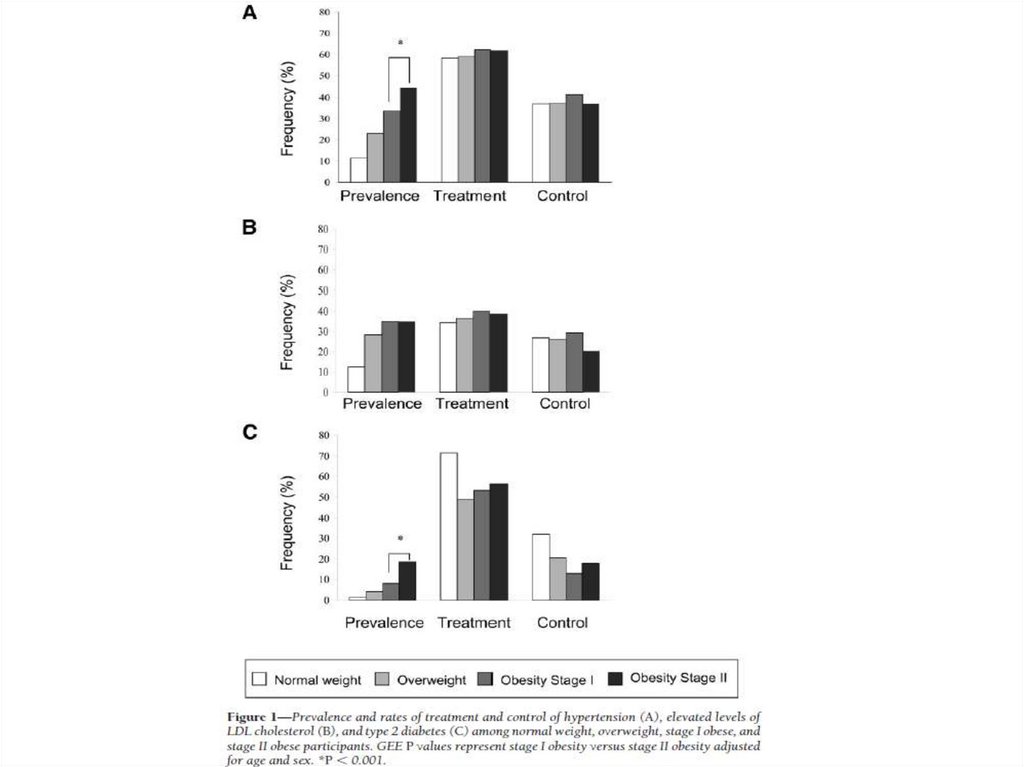
43. Cross-Sectional (Prevalence) Studies
CROSS-SECTIONAL (PREVALENCE)STUDIES
• Data on “exposure” and the
“outcome” is taken at “one point of
time”
• Unlike cohort studies that have a time
element, where it is clear that
exposure came before the outcome,
cross-sectional studies (without
outside information) have no clarity
whether “exposure” or “outcome”
came first
44. Cross-sectional studies
CROSS-SECTIONAL STUDIES• Potential biases in etiologic inferences:
I. Temporality
A. Which comes first?
II. Potential for incidence-prevalence bias (duration
differs by exposure; also called “survival bias”)
A. For example smoking ↑ incidence of
emphysema and ↓ its survival, thus
B. Prevalence RR underestimates incidence RR
45. Cross-sectional studies avoiding incidence-prevalence bias
CROSS-SECTIONAL STUDIESAVOIDING INCIDENCE-PREVALENCE
Prev
Incid
Duration
Prev RR
BIAS
DIS : EXP
Prev DIS:NOT EXPs
DIS EXP
DIS EXP
IncidDIS NOT EXP Duration DIS NOT EXP
For the Prevalence Ratio to equal the incidence Relative
Risk duration must not differ by exposure
PrevalenceExp ~ IncidenceExp x DurationExp
PrevalenceUnexp
IncidenceUnexp x DurationUnexp
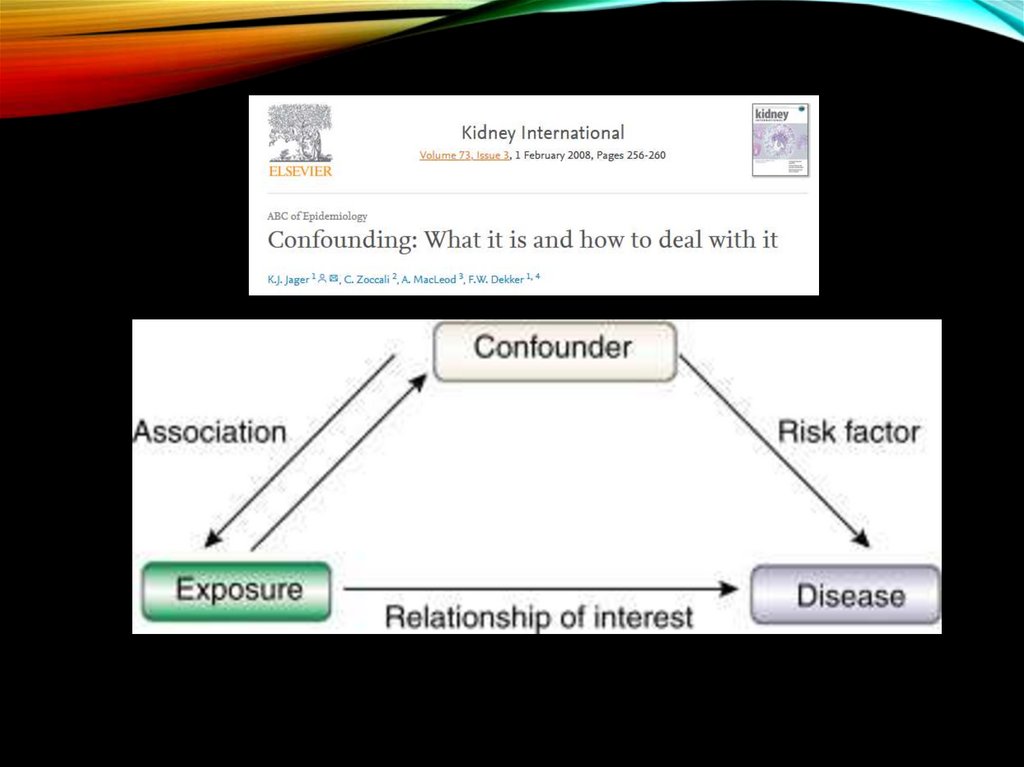
46. How to Control for Confounding In Cohort and Cross-Sectional Studies (approaching rigor of a RCT) 1. Mantel Haenszel Method 2.
Matching on Confounders3. Exclusion
4. Multivariate Regression Modeling:
Poisson Regression with Robust
Variance**, Logistic Regression**, Cox
Regression*, Linear Regression**
** Can be used for both cohort and cross-sectional
studies
* Can be used for cohort studies only
47. When is a Cohort Study Justified?
1. When there is prior evidence of theassociation of an exposure with disease
2. When exposure is rare, but disease
occurrence is common
3. When the time interval from exposure to
disease is short
4. When attrition of the study population can
be minimized
5. When sufficient (and much) funding is
available
6. When the investigator plans to be around
for a very long time---plan for a LONG LIFE!