


 informatics
Similar presentations:


")


Sampling and sampling distributions. Lecture 1
1. Lecture 1
LECTURE 1SAMPLING AND SAMPLING DISTRIBUTIONS
2. Sampling from a population
SAMPLING FROM A POPULATION• Simple Random Sampling:
Suppose that it is required to select a sample of n objects from a population of N objects. A
simple random sampling procedure is one in which every possible sample of n objects is
equally likely to be chosen. This method is in such common use that the adjective simple is
generally dropped, and the resulting sample is called a random sample.
3. Statistics and sampling distributions
STATISTICS AND SAMPLING DISTRIBUTIONS• Suppose that a random sample is drawn from a population and that an inference about
some characteristic of the population distribution is to be made. This inference is based
on some statistic, a particular function of the sample information. The sampling
distribution of this statistic is the probability distribution of the values it could take over
all possible samples of the same number of observations drawn from the population.
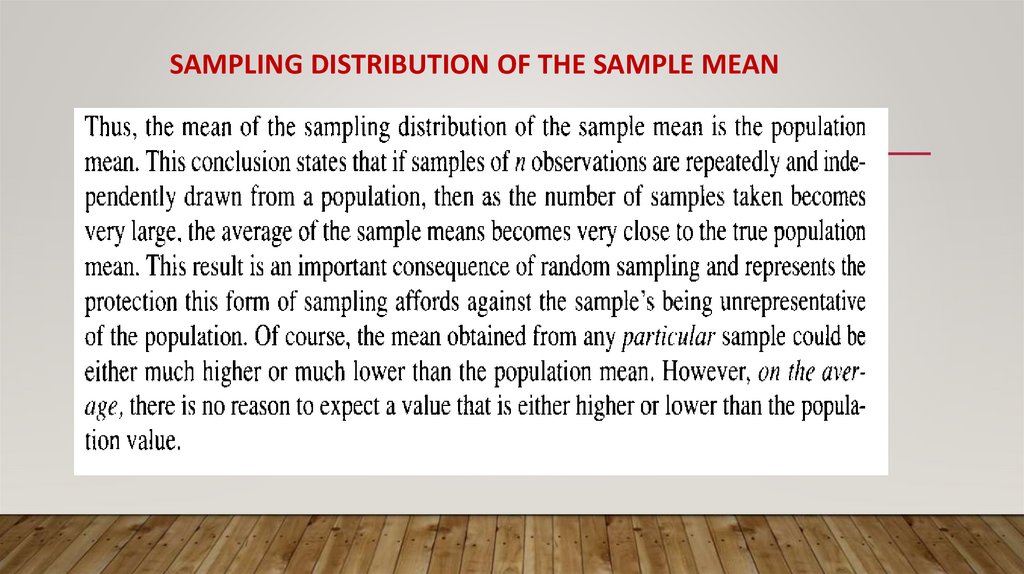
4. Sampling distribution of the sample mean
SAMPLING DISTRIBUTION OF THE SAMPLE MEAN5. Sampling distribution of the sample mean
SAMPLING DISTRIBUTION OF THE SAMPLE MEAN6.
SAMPLING DISTRIBUTION OF THE SAMPLE MEAN7.
SAMPLING DISTRIBUTION OF THE SAMPLE MEAN8.
Ex: Suppose that annual percentage salary increases for the CEO’s of all mid-size corporations are normally distributedwith mean 12.2% and standard deviation 3.6%. A random sample of 9 observations from this population is taken. What’s
the probability that the sample mean will be less than 10%?
9.
Ex: A manufacturer claims that the life of its spark plugs is normally distributed with mean 36,000 miles and standarddeviation of 4000 miles. For a random sample of 16 of these plugs, the average life was found to be 34,500 miles. If the
manufacturer claim is correct, what would be the probability of finding sample mean this small or smaller?
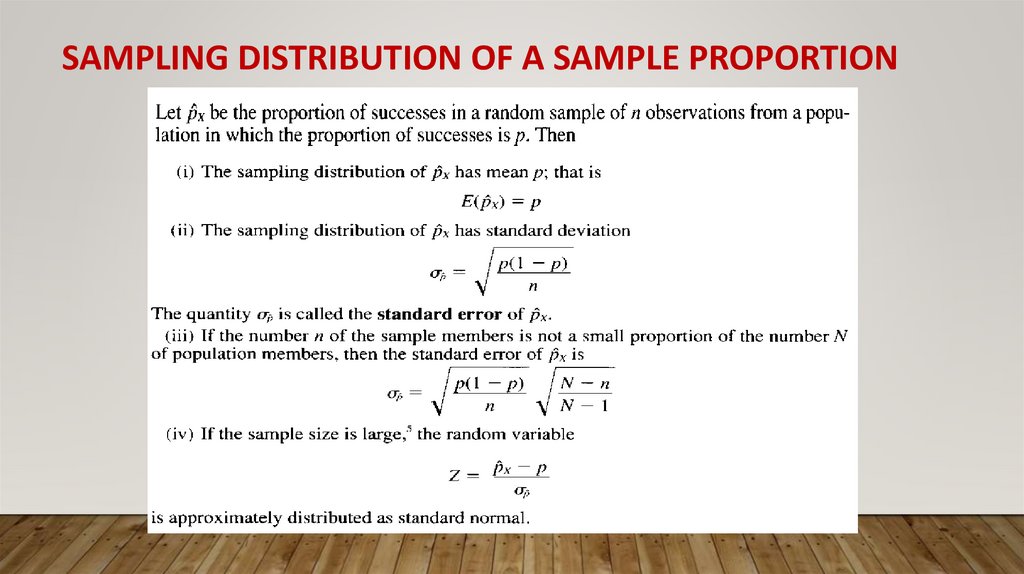
10. Sampling distribution of a sample proportion
SAMPLING DISTRIBUTION OF A SAMPLE PROPORTION11.
SAMPLING DISTRIBUTION OF A SAMPLE PROPORTION12.
Ex: A random sample of 250 homes was taken from a large population of older homes to estimate theproportion of such homes in which the electric wiring was unsafe. Suppose that in fact, 30% of all homes in his
population have unsafe wiring. Find the probability that the proportion of homes in the sample with unsafe
wiring is between 0.25 and 0.35.
13.
Ex: It has been estimated that 43% of business graduates believe that a course in business ethics is veryimportant for importing ethical values to students. Find the probability that more than one half of a random
sample of 80 business graduates have this belief.
14. Sampling distribution of the sample variance
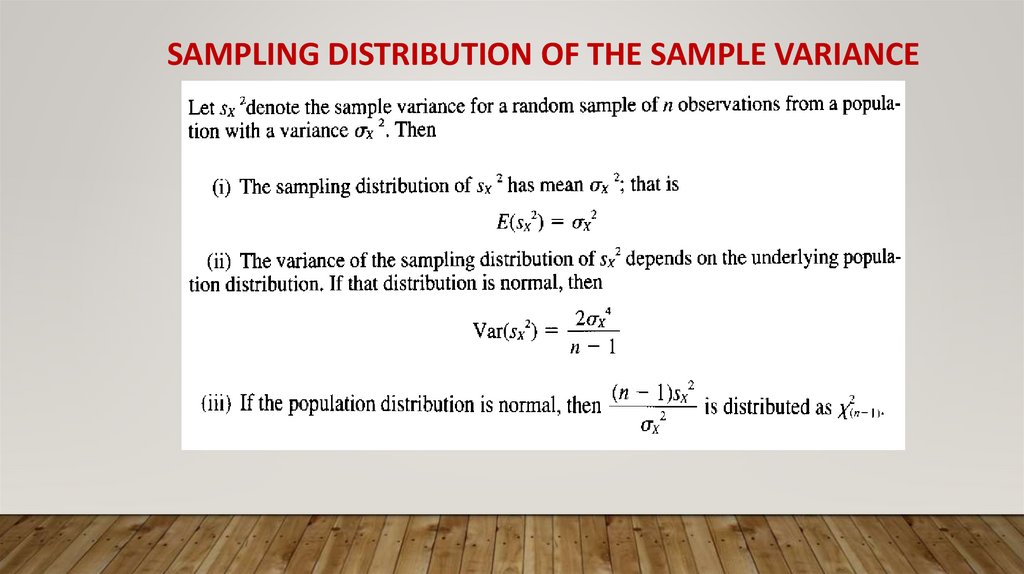
SAMPLING DISTRIBUTION OF THE SAMPLE VARIANCEIts square root, sx, is called the sample standart deviation.
15. Sampling distribution of the sample variance
SAMPLING DISTRIBUTION OF THE SAMPLE VARIANCE16.
SAMPLING DISTRIBUTION OF THE SAMPLE VARIANCE17.
Ex: When a production process is operating correctly, the resistance in ohms of components produces has anormal distribution with standard deviation 3.6. A random sample of four components was taken. What’s the
probability that the sample variance is bigger than 30?