


 mathematics
Similar presentations:

")


 when is known and n (large)")


Inferences comparing two populations means
1.
SEMESTER 2 WEEK 6INFERENCES COMPARING
TWO POPULATIONS
MEANS
(t-test)
2.
Lecture outline1. “z-test” versus “t-test”
2. Two sample t-test: Independent samples
Equal variance
Unequal variance
3. Paired t-test: Dependent samples
3.
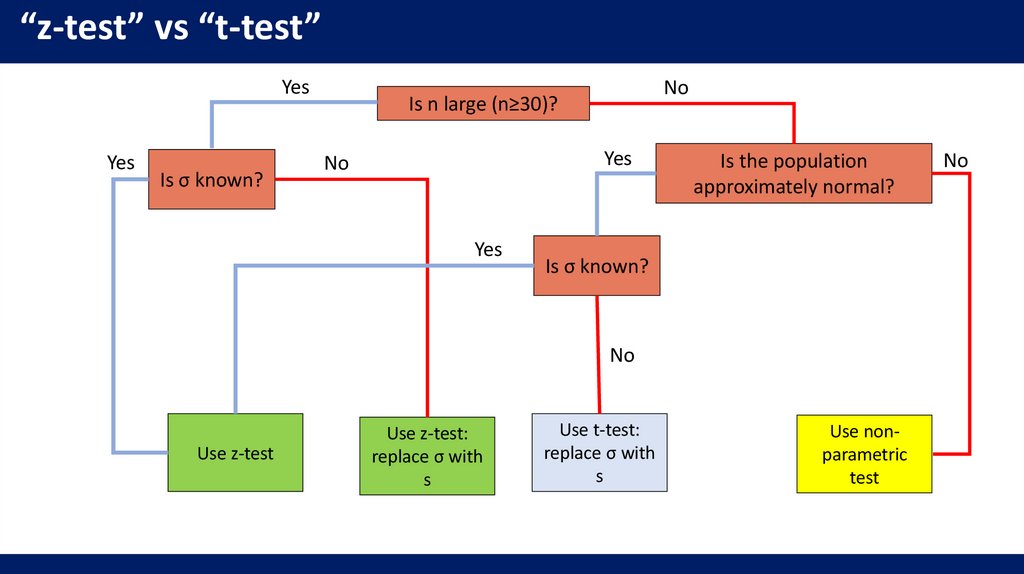
“z-test” vs “t-test”Yes
Yes
Is σ known?
No
Is n large (n≥30)?
Yes
No
Yes
Is the population
approximately normal?
Is σ known?
No
Use z-test
Use z-test:
replace σ with
s
Use t-test:
replace σ with
s
Use nonparametric
test
No
4.
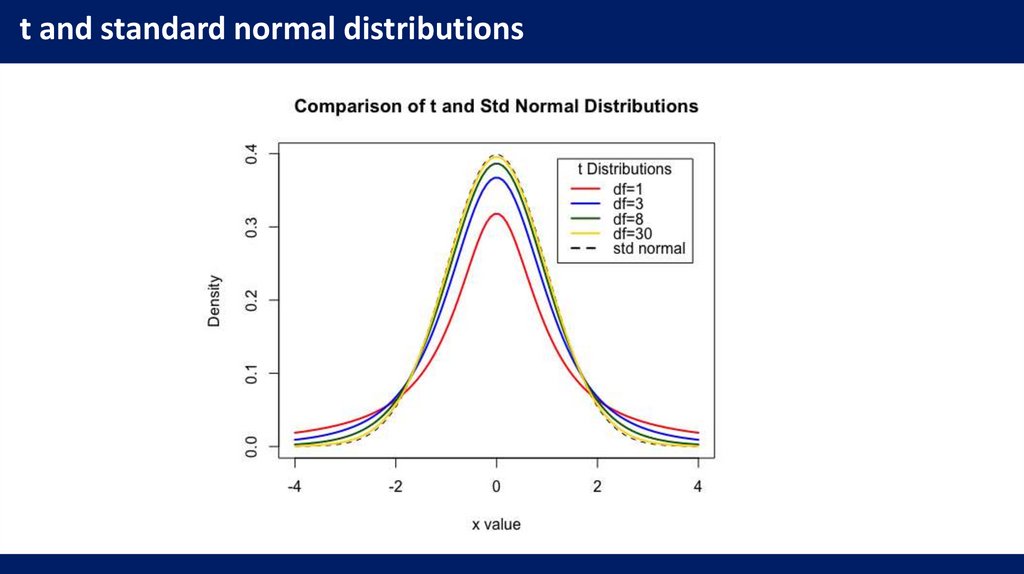
t and standard normal distributions5.
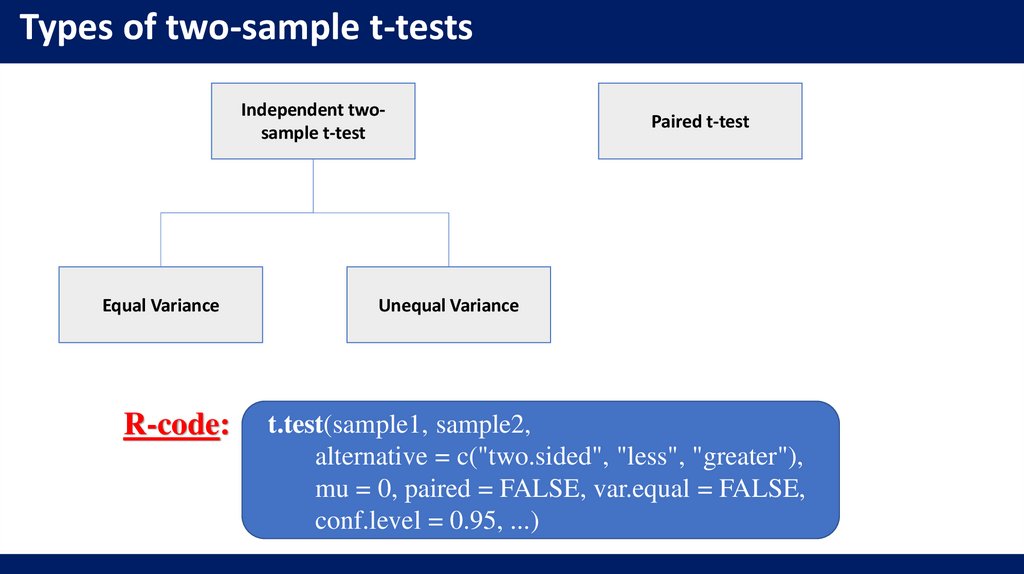
Types of two-sample t-testsIndependent twosample t-test
Equal Variance
R-code:
Paired t-test
Unequal Variance
t.test(sample1, sample2,
alternative = c("two.sided", "less", "greater"),
mu = 0, paired = FALSE, var.equal = FALSE,
conf.level = 0.95, ...)
6.
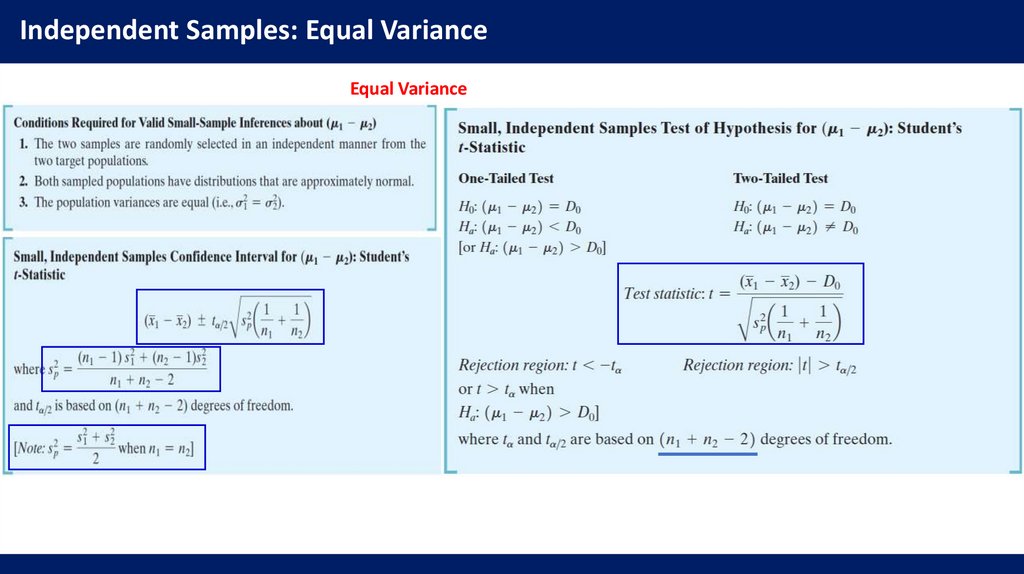
Independent Samples: Equal VarianceEqual Variance
7.
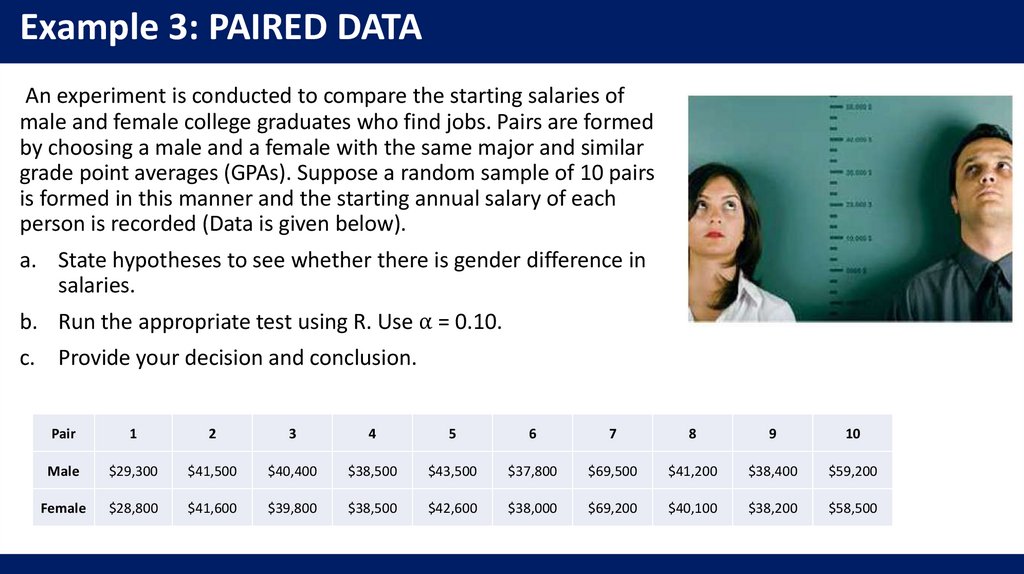
Example 1: EQUAL VARIANCESuppose you wish to compare a new method of teaching reading to “slow
learners” with the current standard method. You decide to base your comparison
on the results of a reading test given at the end of a learning period of six months.
Of a random sample of 22 “slow learners,” 10 are taught by the new method and
12 are taught by the standard method. All 22 children are taught by qualified
instructors under similar conditions for the designated six-month period. The test
results are given below (assume variances are equal for two populations).
New Method
80
80
79
81
76
66
71
76
70
85
Standard Method
79
62
70
68
73
76
86
73
72
68
a. State hypotheses whether new method yields significantly higher test results.
b. Run the appropriate test using R. Use ⍺ = 0.05.
c. Provide your decision and conclusion.
75
66
8.
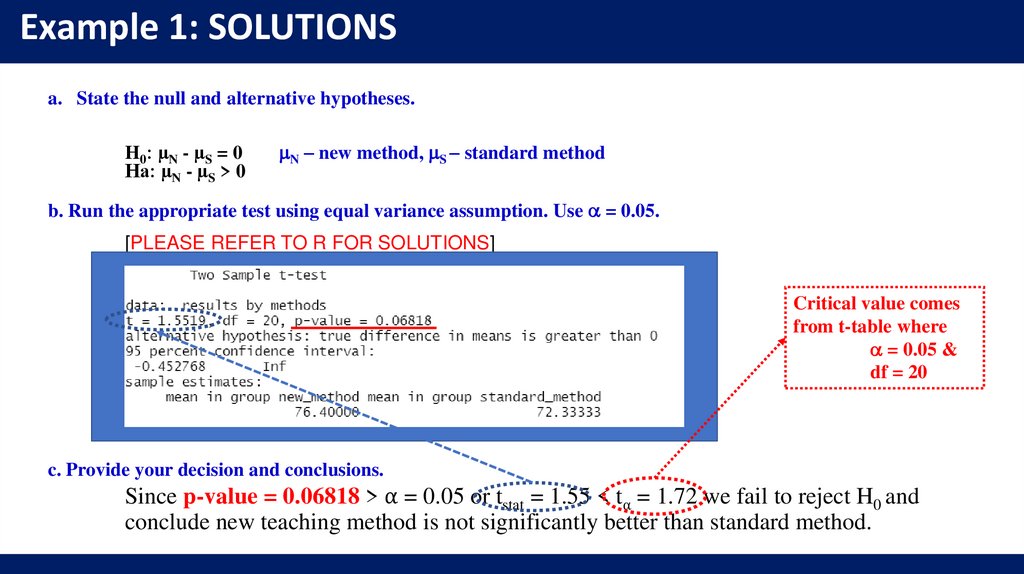
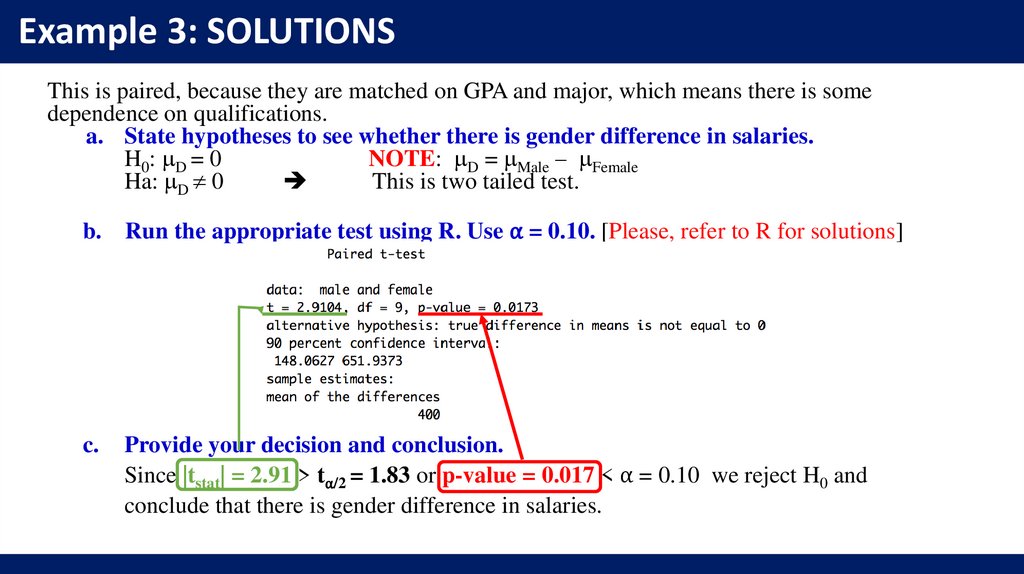
Example 1: SOLUTIONSa. State the null and alternative hypotheses.
H0: µN - µS = 0
Ha: µN - µS > 0
N – new method, S – standard method
b. Run the appropriate test using equal variance assumption. Use = 0.05.
[PLEASE REFER TO R FOR SOLUTIONS]
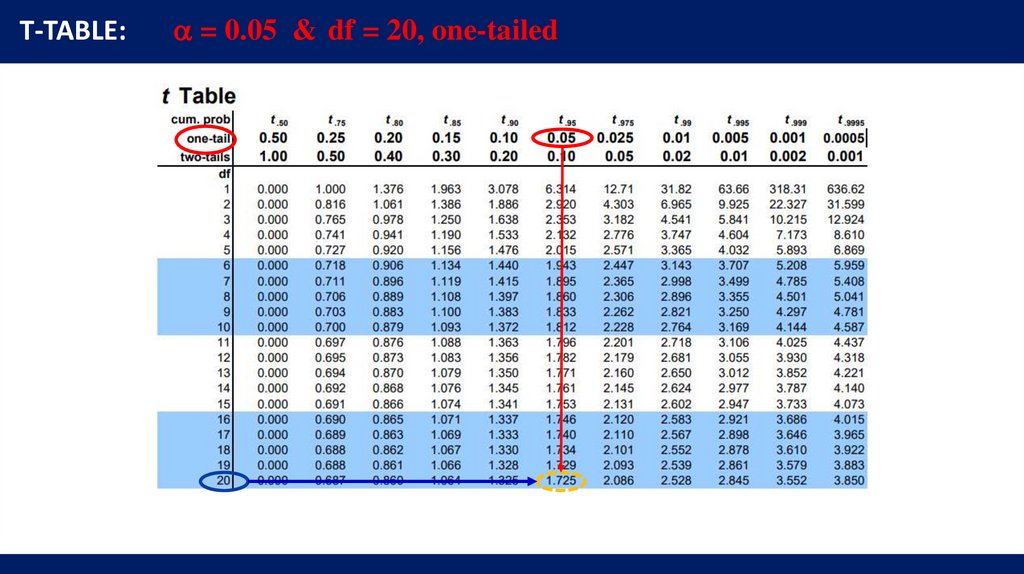
Critical value comes
from t-table where
= 0.05 &
df = 20
c. Provide your decision and conclusions.
Since p-value = 0.06818 > ⍺ = 0.05 or tstat = 1.55 < t⍺ = 1.72 we fail to reject H0 and
conclude new teaching method is not significantly better than standard method.
9.
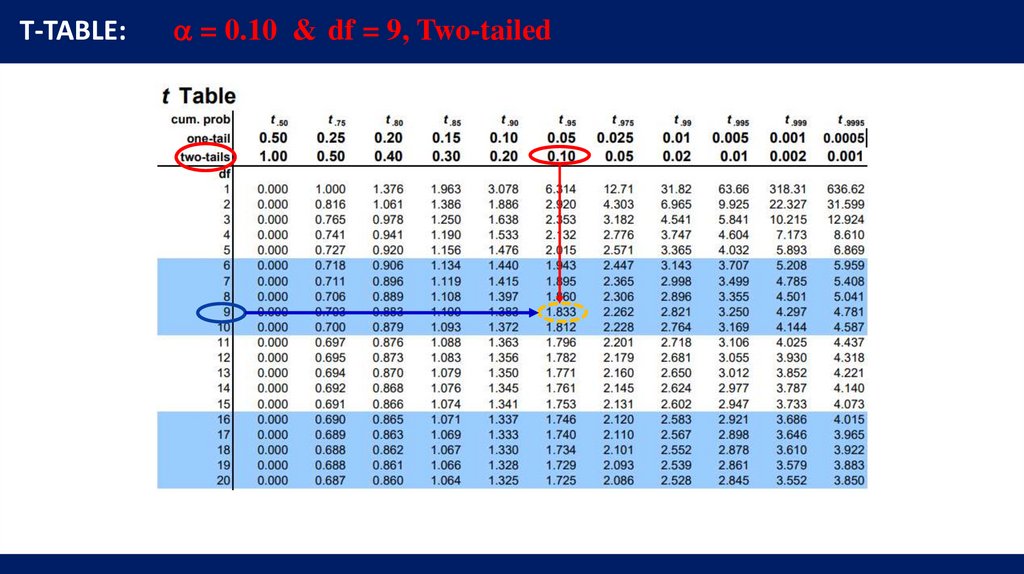
T-TABLE:= 0.05 & df = 20, one-tailed
10.
Independent Samples: Unequal VarianceIf calculated degree of freedom is not integer, please ROUND DOWN to the nearest integer
11.
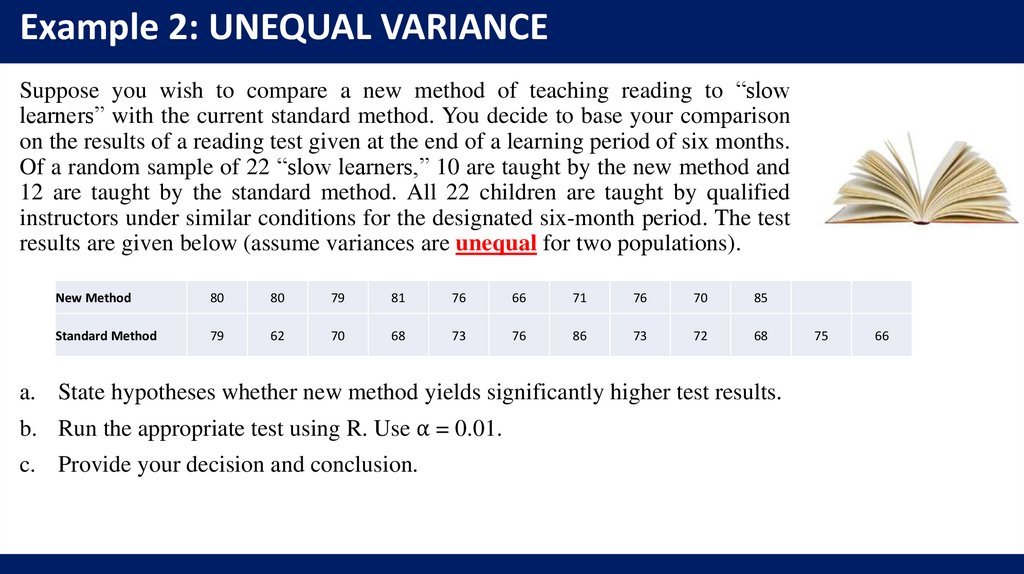
Example 2: UNEQUAL VARIANCESuppose you wish to compare a new method of teaching reading to “slow
learners” with the current standard method. You decide to base your comparison
on the results of a reading test given at the end of a learning period of six months.
Of a random sample of 22 “slow learners,” 10 are taught by the new method and
12 are taught by the standard method. All 22 children are taught by qualified
instructors under similar conditions for the designated six-month period. The test
results are given below (assume variances are unequal for two populations).
New Method
80
80
79
81
76
66
71
76
70
85
Standard Method
79
62
70
68
73
76
86
73
72
68
a. State hypotheses whether new method yields significantly higher test results.
b. Run the appropriate test using R. Use ⍺ = 0.01.
c. Provide your decision and conclusion.
75
66
12.
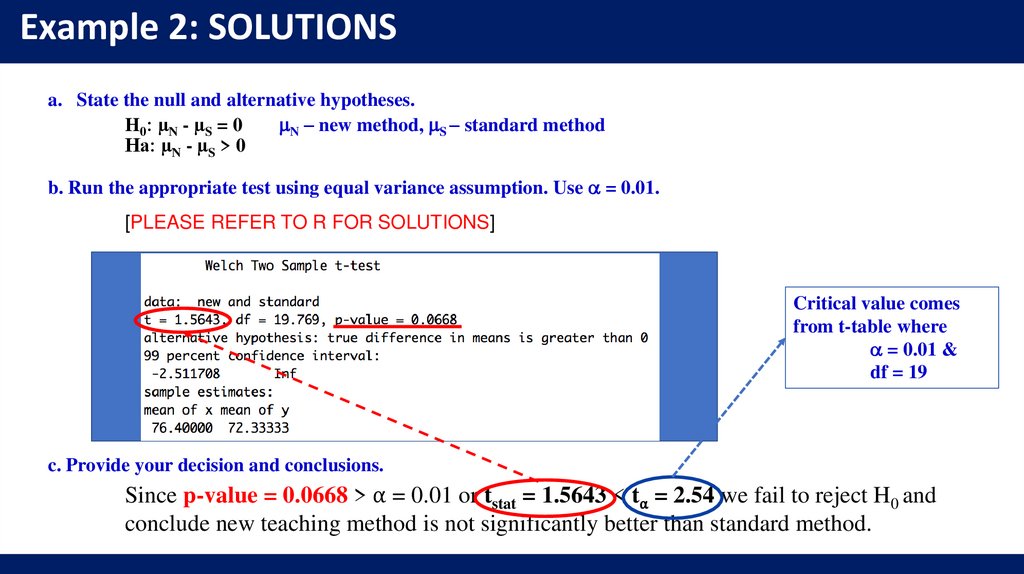
Example 2: SOLUTIONSa. State the null and alternative hypotheses.
H0: µN - µS = 0
N – new method, S – standard method
Ha: µN - µS > 0
b. Run the appropriate test using equal variance assumption. Use = 0.01.
[PLEASE REFER TO R FOR SOLUTIONS]
Critical value comes
from t-table where
= 0.01 &
df = 19
c. Provide your decision and conclusions.
Since p-value = 0.0668 > ⍺ = 0.01 or tstat = 1.5643 < t⍺ = 2.54 we fail to reject H0 and
conclude new teaching method is not significantly better than standard method.
13.
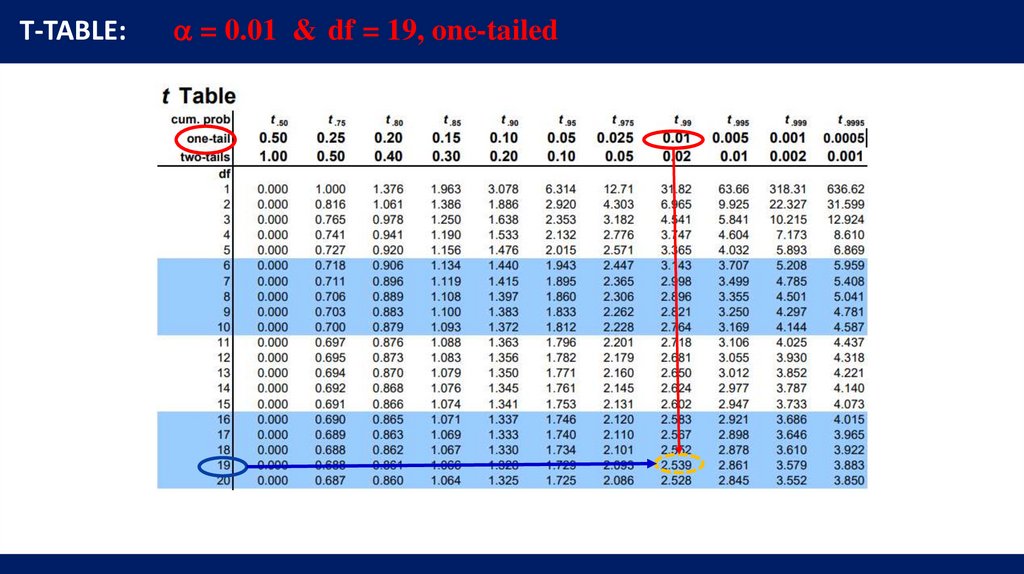
T-TABLE:= 0.01 & df = 19, one-tailed
14.
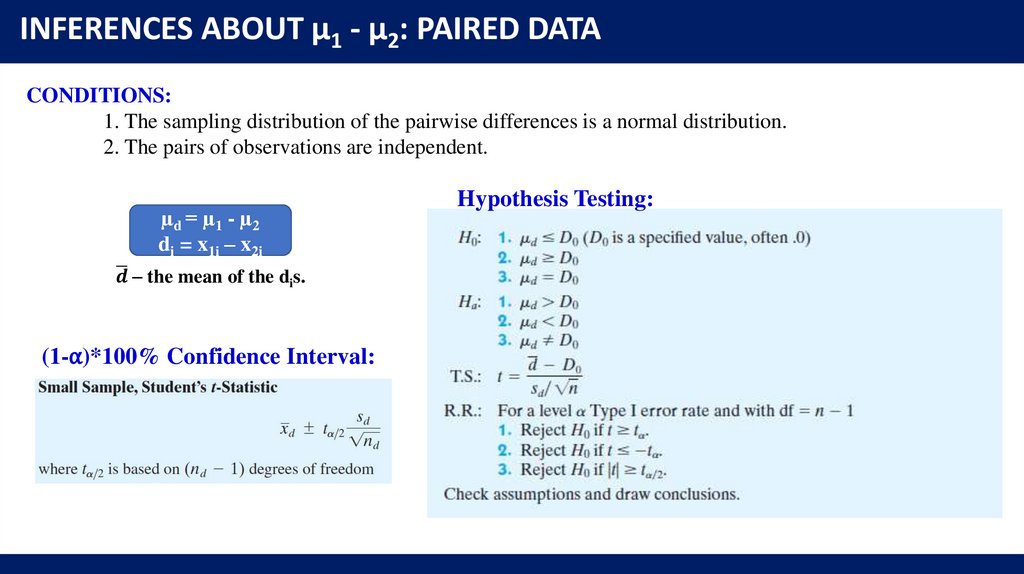
INFERENCES ABOUT µ1 - µ2: PAIRED DATACONDITIONS:
1. The sampling distribution of the pairwise differences is a normal distribution.
2. The pairs of observations are independent.
µd = µ1 - µ2
di = x1i – x2i
ഥ – the mean of the dis.