


 метод квадратов или ключевых участков")


 mathematics
Similar presentations:
")


Area Ecosystem Population
1. Test your knowledge
1. Define termsArea Ecosystem Population –
2. Home task for groups
Questions Research Hypotheses –
Null hypotheses Alternate hypothesesYour topic ecology of water bodies
2. You are a scientist in the field of ecology and you were given the task to determine the population of squirrels in a pine forest. How do you do that?
3. Data collection and analysis
• Methods of mathematical statistics• The application of these methods makes it
possible to get an objective view on a
particular (определённая) population
4. Types of statistical test
T-test (Student’s T-test)Chi- squared test (X2).
Use if using categorical
Use to test the equality of
the average values in two variables (if you are evaluating
the differences between
samples
experimental data and
(проверка равенства
expected or hypothetical
средних значений в двух
data)… Example: expected
выборках)
distribution of organisms
(оценка различий между
экспериментальными
данными и ожидаемыми
данными)
5. T-test
• 2 test groups• Determining the differences between the two
groups
• One or more samples per group are made
6. Example of research question
• Which species of pine (Scotch or Kulunda) aremore common in Kazakhstan?
Scotch pine (сосна обыкновенная)
Kulunda pine (сосна Кулундинская)
7. Examples of Hypotheses
Research HypothesesIn Kazakhstan the Kulunda pine is more common
Statistical hypotheses
Null hypotheses (Ho)
Ho – there is no difference in the prevalence of Scots
pine or Kulunda pine
Alternate hypotheses
Ha – there IS a difference in the predominance of Scots
pine or Kulunda pine
8. Methods of ecological research
• Laboratory method• Experimental and experimental method
• Field method
The objects of field research can be living
organisms, populations, species and their
natural communities
9. Objectives of field researches
Determine (определить)• the distribution (распространение), abundance
(численность) and quality of the species,
population, biocenosis, ecosystem of lakes, rivers
and other objects
• the influence of abiotic, biotic, anthropogenic
factors on organisms
10. Methods of field research
• Lay out and describe a sample area (закладка иописание пробных площадей (ключевых
участков))
• The sizes of sample areas (squares) for groups of
plants are 1, 10, 100 m², for forests - an area of
100 - 5000 m²
• The main indicator of the research is the
quantitative registration of organisms
11.
12. Example
Question: Which part of the school garden hasmore dandelions?
Research hypothesis:
Null hypothesis:
Alternate hypothesis:
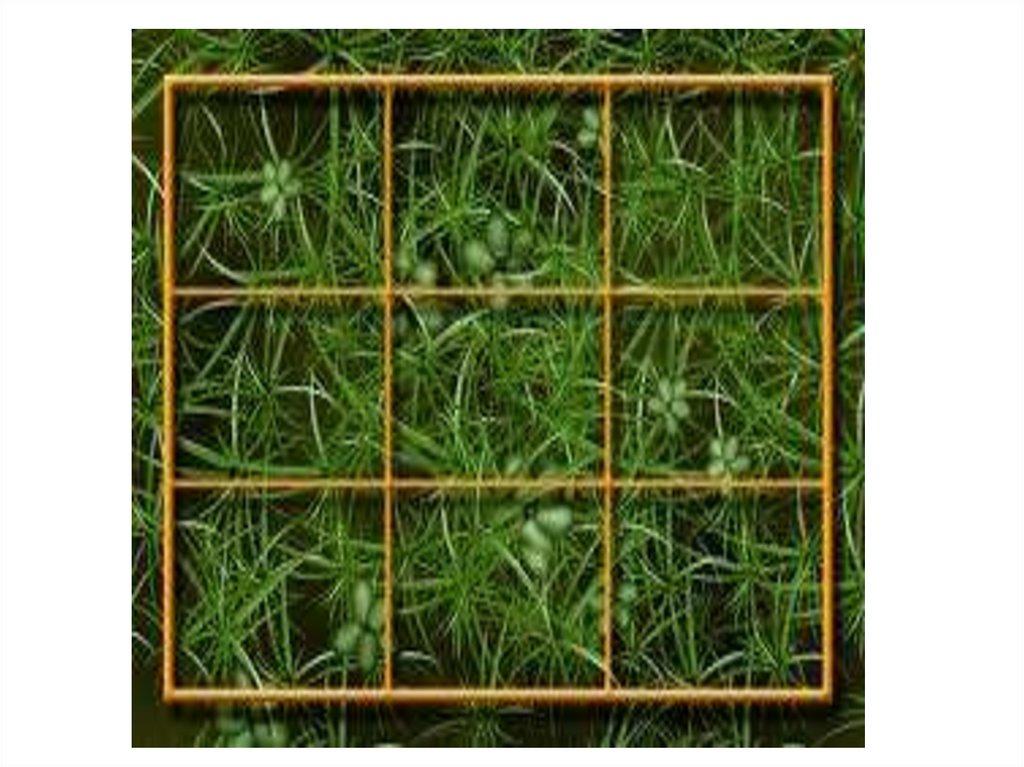
13. Method of research (squares method or key sites) метод квадратов или ключевых участков
1. Select the sample area.2. Lay out a square grid of
known size.
3. Count the dandelions in
each grid.
4. Repeat this 5 times for both
the locations.
5. Tabulate the data.
6. Analyze the data.
14. Data collection
Number of dandelions on the school gardenArea
Eastern part
Western part
Square 1
5
7
Square 2
12
1
Square 3
7
17
Square 4
8
5
Square 5
8
10
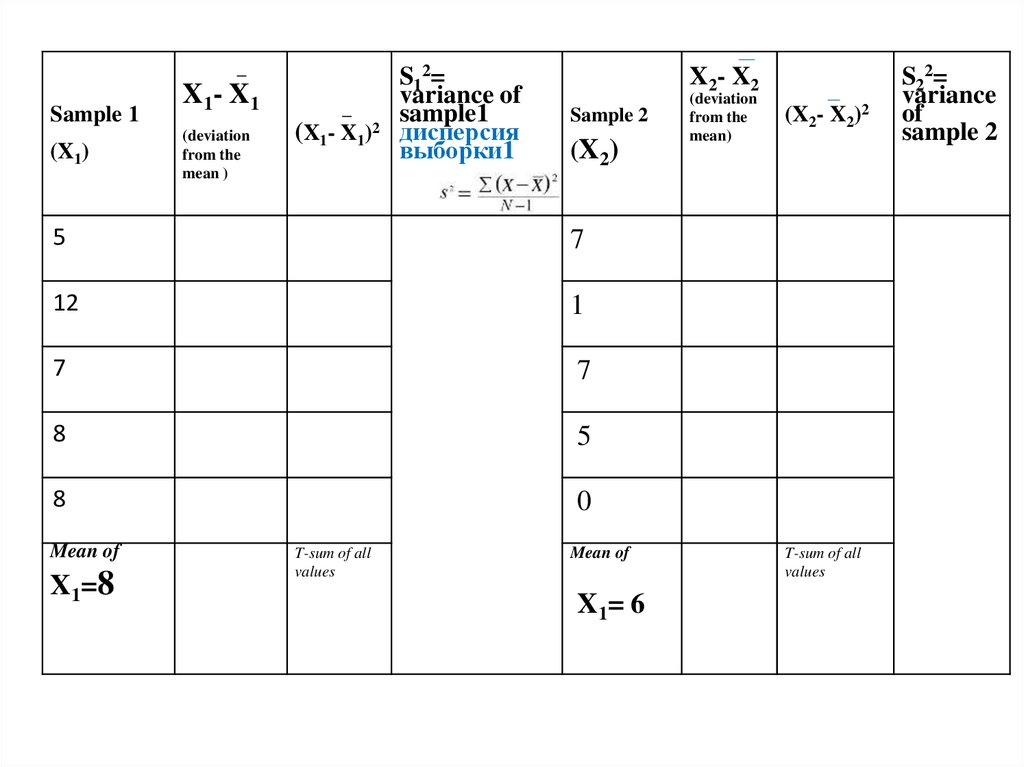
15. Step 1
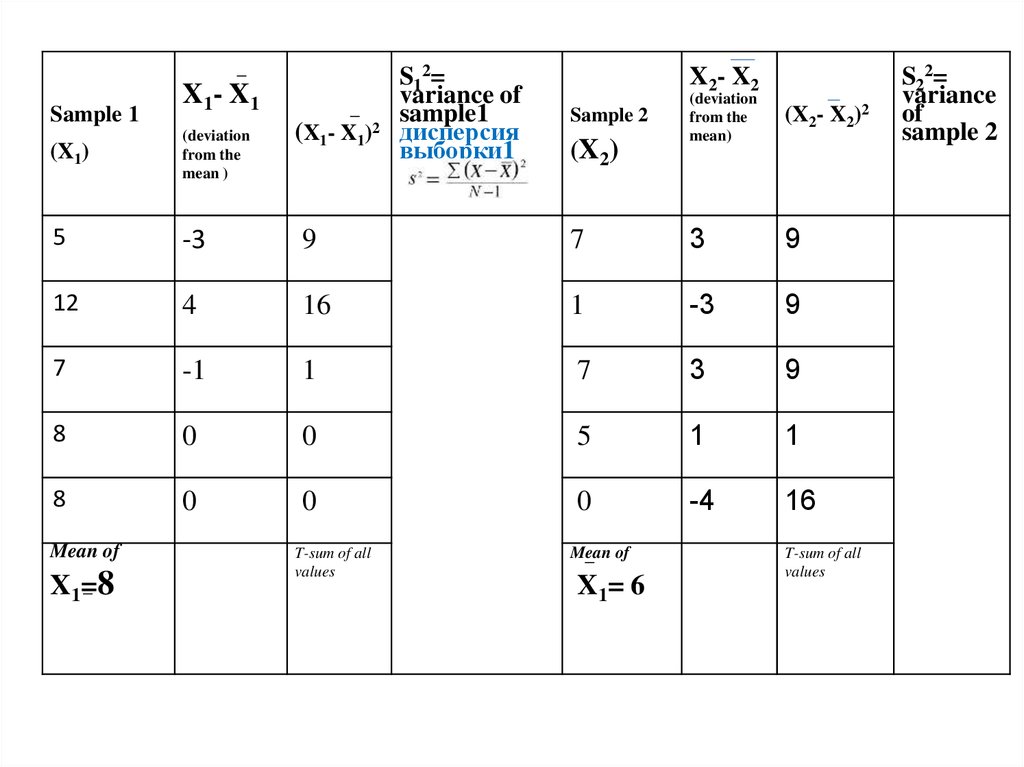
• Calculate the mean value16.
Sample 1(X1)
X 1- X 1
(deviation
from the
mean )
(X1- X1
)2
S12=
variance of
sample1
дисперсия
выборки1
X2- X2
Sample 2
(X 2 )
5
7
12
1
7
7
8
5
8
0
Mean of
X1=8
T-sum of all
values
Mean of
X 1= 6
(deviation
from the
mean)
(X2- X2)2
T-sum of all
values
S22=
variance
of
sample 2
17.
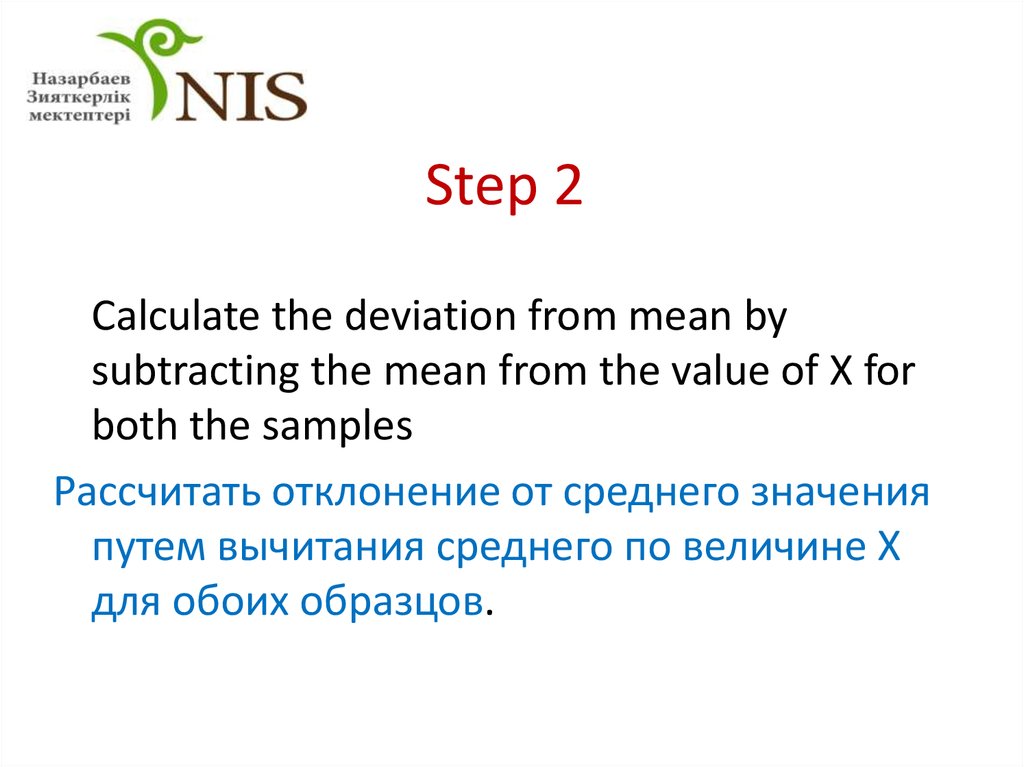
Step 2Calculate the deviation from mean by
subtracting the mean from the value of X for
both the samples
Рассчитать отклонение от среднего значения
путем вычитания среднего по величине X
для обоих образцов.
18.
Sample 1X 1- X 1
(X1- X1
)2
S12=
variance of
sample1
дисперсия
выборки1
X2- X2
Sample 2
(deviation
from the
mean)
(X1)
(deviation
from the
mean )
5
-3
7
3
12
4
1
-3
7
-1
7
3
8
0
5
1
8
0
0
-4
Mean of
X1=8
T-sum of all
values
(X 2 )
Mean of
X 1= 6
(X2- X2)2
T-sum of all
values
S22=
variance
of
sample 2
19. Step 3
• Square the deviation from the mean for boththe samples
20.
Sample 1X 1- X 1
(X1- X1
)2
S12=
variance of
sample1
дисперсия
выборки1
X2- X2
Sample 2
(deviation
from the
mean)
(X2- X2)2
(X1)
(deviation
from the
mean )
5
-3
9
7
3
9
12
4
16
1
-3
9
7
-1
1
7
3
9
8
0
0
5
1
1
8
0
0
0
-4
16
Mean of
X1=8
T-sum of all
values
(X 2 )
Mean of
X 1= 6
T-sum of all
values
S22=
variance
of
sample 2
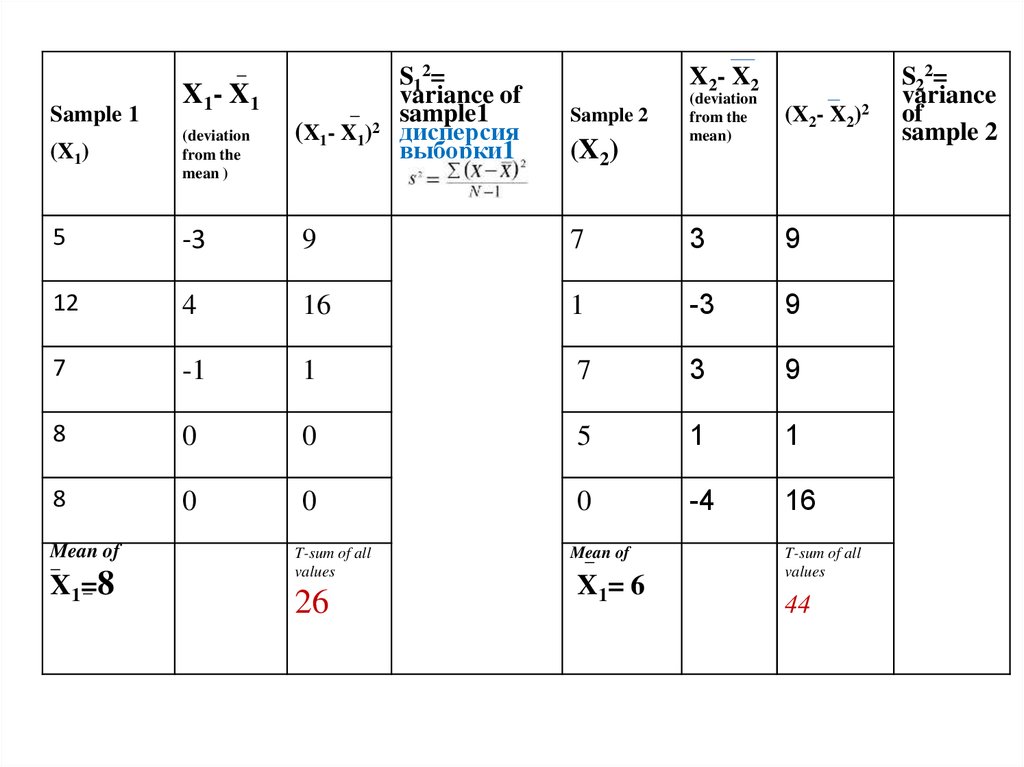
21. Step 4
• Calculate the sum of the squares22.
Sample 1X 1- X 1
(X1- X1
)2
S12=
variance of
sample1
дисперсия
выборки1
X2- X2
Sample 2
(deviation
from the
mean)
(X2- X2)2
(X1)
(deviation
from the
mean )
5
-3
9
7
3
9
12
4
16
1
-3
9
7
-1
1
7
3
9
8
0
0
5
1
1
8
0
0
0
-4
16
Mean of
X1=8
T-sum of all
values
26
(X 2 )
Mean of
X 1= 6
T-sum of all
values
44
S22=
variance
of
sample 2
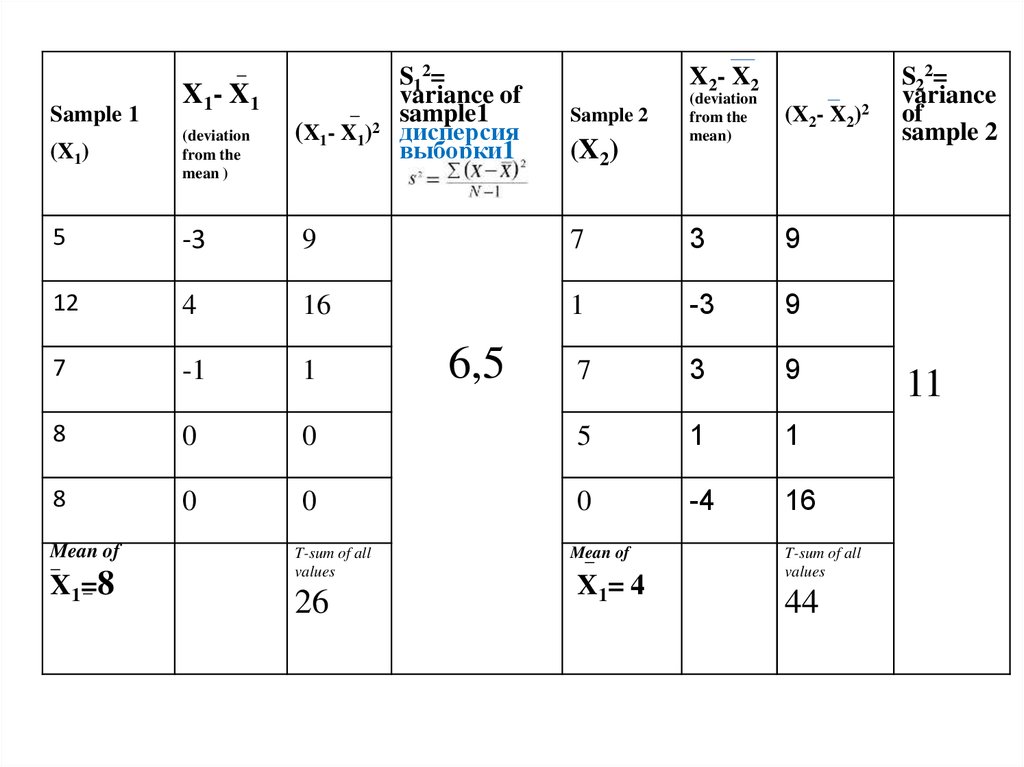
23. Step 5
• Calculate the variance for both the samples24.
Sample 1X 1- X 1
(X1- X1
)2
S12=
variance of
sample1
дисперсия
выборки1
X2- X2
Sample 2
(deviation
from the
mean)
(X2- X2)2
(X1)
(deviation
from the
mean )
5
-3
9
7
3
9
12
4
16
1
-3
9
7
-1
1
7
3
9
8
0
0
5
1
1
8
0
0
0
-4
16
Mean of
X1=8
T-sum of all
values
26
6,5
(X 2 )
Mean of
X 1= 4
T-sum of all
values
44
S22=
variance
of
sample 2
11
25. Step 6
• calculate the value of T using the formulaprovided in the Table
26. T –value
Where:X1= mean of sample 1
S12= variance of sample 1
N1= frequency of sample 1
X2= mean of sample 2
S22= variance of sample 2
N2= frequency of sample 2
Х1 - среднее значение выборки 1
Х2 - среднее значение выборки 2
S1²- дисперсия выборки 1
S2²- дисперсия выборки 2
N₁ - частота выборки 1
N₂ - частота выборки 2
27. Answer
• 2,1428. Step 7
• Calculate the degree of freedomРассчитать степень свободы
df = (N1+ N2) – 2= 8
29. Step 8
• Find the critical value using the t- table30. Degree of freedom
• 2,3131. Data analysis
• If the T-value is less than the critical value, then accept the nullhypothesis Если Т-значение меньше критического значения,
то следует принять нулевую гипотезу
• If the T-value is bigger than the critical value, the null
hypothesis should be rejected Если Т-значение больше, чем
критическое значение следует отклонить нулевую гипотезу
• Null hypothesis: There are no differences in the
number of dandelions on the western and eastern
sides of the school garden
• 2,14
2,31
32. Analysis of results
• If the null hypothesis is accepted, then therewas NO significant difference in the
distribution of dandelions in the school garden
• If the null hypothesis is rejected, then there
was a significant difference in the distribution
of dandelions in the school garden
33. Conclusion
There is no significant difference in thedistribution of dandelions in the school garden
on the western and eastern territories