


")
")


 mathematics
Similar presentations:

")


Confidence interval and Hypothesis testing for population mean (µ) when is known and n (large)
1. NUFYP Mathematics & Computing Science Pre-Calculus Course
Foundation Year ProgramNUFYP Mathematics & Computing Science
Pre-Calculus Course
L21 Confidence interval and
Hypothesis testing for
population mean (µ)
when is known and n (large)
Rustem Iskakov
1
2016-17
2. Lecture overview: Learning outcomes
Foundation Year ProgramLecture overview: Learning outcomes
At the end of this lecture you should be able to:
7.6.1 Calculate and interpret confidence
intervals for a population parameter
7.6.2 Test the hypothesis for a mean of a normal
distribution,
Ho: µ=k,
H1: µ≠k or µ>k or µ<k
2
2016-17
3. Lecture overview: Learning outcomes
Foundation Year ProgramLecture overview: Learning outcomes
At the end of this lecture you should be able to:
7.6.3 Test the hypothesis for the difference
between means of two independent normal
distributions
Ho: µx - µy=0,
H1: µx - µy≠0 or µx - µy<0 or µx - µy>0
3
2016-17
4. Textbook Reference
Foundation Year ProgramTextbook Reference
The content of this lecture is from the following
textbook:
Chapter 3
Statistics 3 Edexcel AS and A Level Modular
Mathematics S3 published by Pearson Education
Limited
ISBN 978 0 435519 14 8
Further examples can be found in the textbook.
4
2016-17
5. Terminology
Foundation Year ProgramTerminology
CONFIDENCE INTERVAL
A range of values constructed so that
there is a specified probability of
including the true value of a parameter
within it
5
2016-17
6. Terminology
Foundation Year ProgramTerminology
CONFIDENCE LEVEL
• Probability of including the true value of
a parameter
within a confidence
interval
• Percentage
6
2016-17
7. Terminology
Foundation Year ProgramTerminology
CONFIDENCE LIMITS – CRITICAL
VALUES
• Two extreme measurements within
which an observation lies
• End points of the confidence interval
• Larger confidence – Wider interval
7
2016-17
8. Estimation of population parameters
Foundation Year ProgramEstimation of population
parameters
Point estimate
Interval estimate
We have covered this
in previous lecture
8
2016-17
9. Point estimate VS Interval estimate
Foundation Year ProgramPoint estimate VS Interval
estimate
Point estimate
x ˆ
s ˆ
2
2
But, sample mean is still an approximation, and
how close (ERROR) it is to true population mean
value we do not consider in the Point estimate.
9
2016-17
10. Point estimate VS Interval estimate
Foundation Year ProgramPoint estimate VS Interval
estimate
Point estimate
x ˆ
s ˆ
2
10
Interval estimate
x Error x Error
2
2016-17
11. Point estimate VS Interval estimate
Foundation Year ProgramPoint estimate VS Interval
estimate
Interval estimate
x Error x Error
In interval estimate we
do consider ERROR
Interval estimate is a range of numbers
around the point estimate within which
the parameter is believed to fall
11
2016-17
12. Point estimate VS Interval estimate
Foundation Year ProgramPoint estimate VS Interval
estimate
Point estimate
x ˆ
s ˆ
2
Interval estimate
x Error x Error
2
Until now we didn’t specify what is
meant by error
12
2016-17
13. Point estimate VS Interval estimate
Foundation Year ProgramPoint estimate VS Interval
estimate
Point estimate
x ˆ
s ˆ
2
Interval estimate
x
x
n
n
2
Standard error
13
2016-17
14. 7.5.1 Calculate and interpret confidence intervals for a population parameter
Foundation Year Program7.5.1 Calculate and interpret confidence
intervals for a population parameter
•Interval estimate provides us interval
within which we believe value of true
population mean falls
•Then by using Standard Normal
Distribution we can consider specific
level of confidence that µ is really there
by adjusting critical coefficient
14
2016-17
15. The general formula for all confidence intervals are:
Foundation Year Program7.5.1 Calculate and interpret confidence
intervals for a population parameter
The general formula for all confidence intervals
are:
Point Estimate ± (Critical Value) (Standard Error)
x Z / 2
n
2016-17
16. 7.5.1 Calculate and interpret confidence intervals for a population parameter
Foundation Year Program7.5.1 Calculate and interpret confidence
intervals for a population parameter
x Z / 2
n
x Z / 2
n
Critical values
16
2016-17
17.
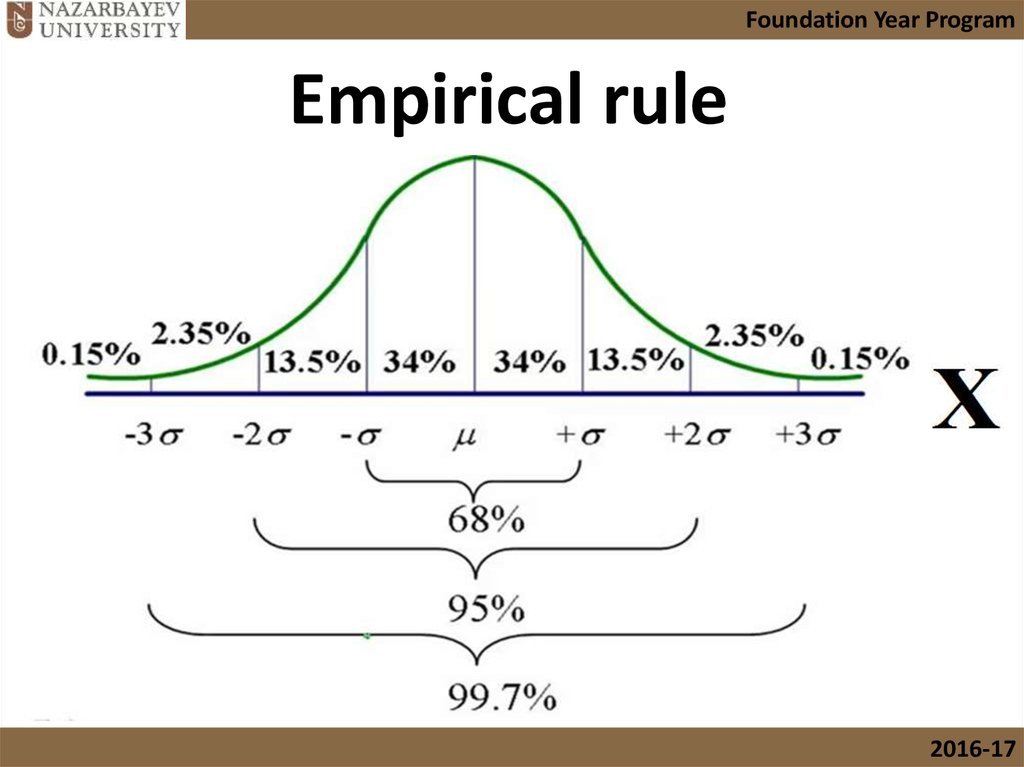
Foundation Year ProgramEmpirical rule
2016-17
18.
Foundation Year ProgramEmpirical rule
2016-17
19. 95% Confidence Interval of the Mean
Foundation Year Program95% Confidence Interval of the Mean
?
?
19
Bluman, Chapter 7
2016-17
20. Common Levels of Confidence
Foundation Year ProgramCommon Levels of Confidence
Confidence level
1–α
.90
α level
α
.10
Z value
z1–(α/2)
1.645
.95
.05
1.960
.99
.01
2.576
20
Bluman, Chapter 7
2016-17
21. Formula for the Confidence Interval of the Mean for a Specific a
Foundation Year ProgramFormula for the Confidence Interval of the
Mean for a Specific
X z / 2
X
z
/2
n
n
For a 90% confidence interval: z / 2 1.65
For a 95% confidence interval: z / 2 1.96
For a 99% confidence interval: z / 2 2.58
21
Bluman, Chapter 7
2016-17
22. 7.5.1 Calculate and interpret confidence intervals for a population parameter
Foundation Year Program7.5.1 Calculate and interpret confidence
intervals for a population parameter
Example 1
22
2016-17
23. 7.5.1 Calculate and interpret confidence intervals for a population parameter
Foundation Year Program7.5.1 Calculate and interpret confidence
intervals for a population parameter
Example 1
23
2016-17
24. 7.5.1 Calculate and interpret confidence intervals for a population parameter
Foundation Year Program7.5.1 Calculate and interpret confidence
intervals for a population parameter
Example 2
24
2016-17
25. 7.5.1 Calculate and interpret confidence intervals for a population parameter
Foundation Year Program7.5.1 Calculate and interpret confidence
intervals for a population parameter
Example 2
25
2016-17
26. 7.5.2 Test the hypothesis for a mean of a normal distribution
Foundation Year Program7.5.2 Test the hypothesis for a mean of a
normal distribution
Hypothesis testing
• Hypothesis testing as well as estimation
is a method used to reach a conclusion
on population parameter by using
sample statistics.
2016-17
27. 7.5.2 Test the hypothesis for a mean of a normal distribution
Foundation Year Program7.5.2 Test the hypothesis for a mean of a
normal distribution
Hypothesis testing
• In Hypothesis testing beside sample
statistics level of significance (α) is used
to make a meaningful conclusion.
2016-17
28.
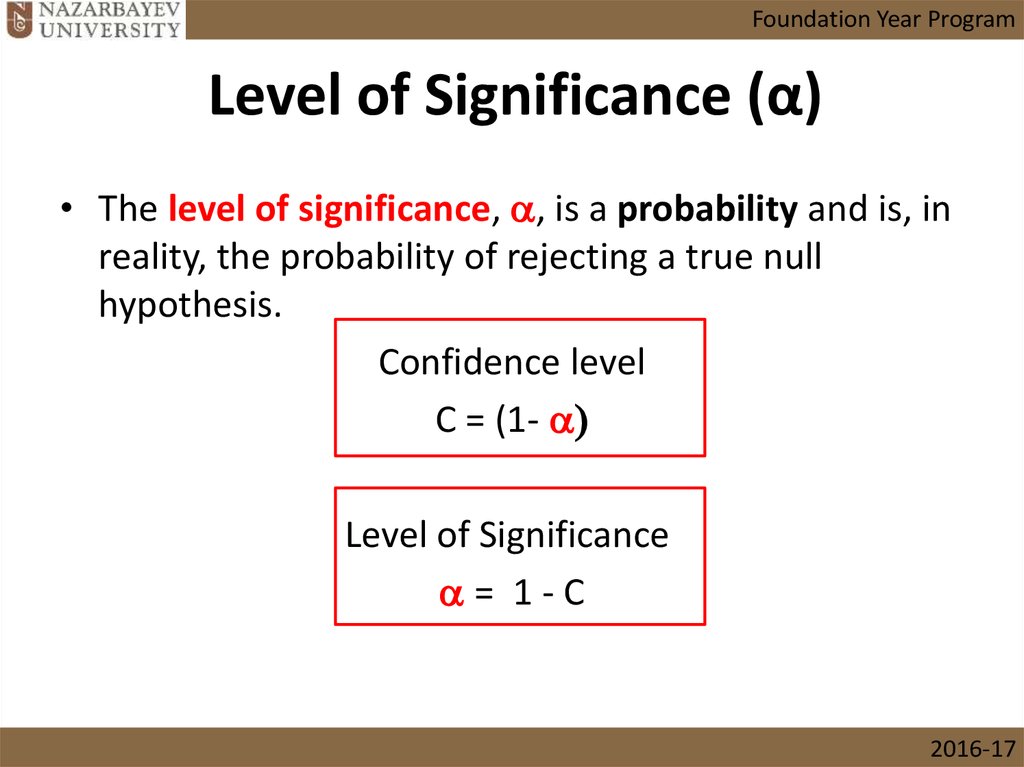
Foundation Year ProgramLevel of Significance (α)
• The level of significance, , is a probability and is, in
reality, the probability of rejecting a true null
hypothesis.
Confidence level
C = (1- )
Level of Significance
= 1-C
28
2016-17
29. 7.5.2 Test the hypothesis for a mean of a normal distribution
Foundation Year Program7.5.2 Test the hypothesis for a mean of a
normal distribution
Hypothesis testing
• In Hypothesis testing we compare a
sample statistic to a population
parameter to see if there is a significant
difference.
2016-17
30.
Foundation Year Program7.5.1 Calculate and interpret confidence
intervals for a population parameter
Hypothesis testing
2016-17
31.
Foundation Year Program7.5.1 Calculate and interpret confidence
intervals for a population parameter
Hypothesis testing
2016-17
32. Types of Hypothesis testing
Foundation Year ProgramTypes of Hypothesis testing
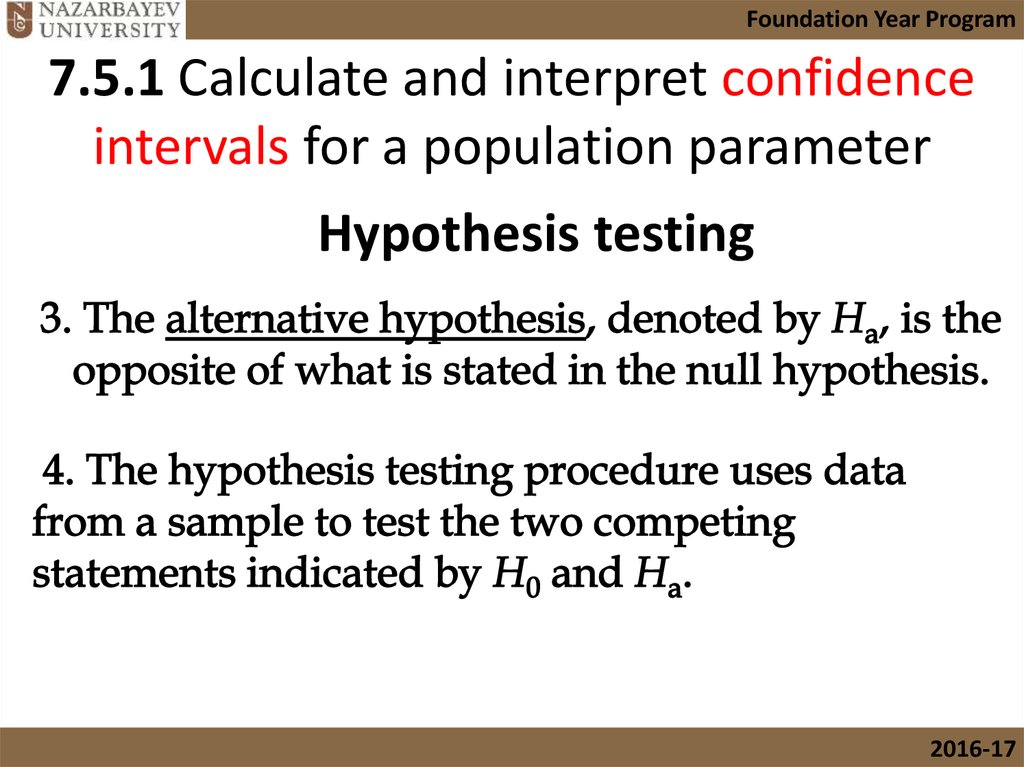
• Null Hypothesis (H0)
• Alternative Hypothesis (Ha or H1)
Each of the following statements is an example of a null
hypothesis and corresponding alternative hypothesis.
32
2016-17
33.
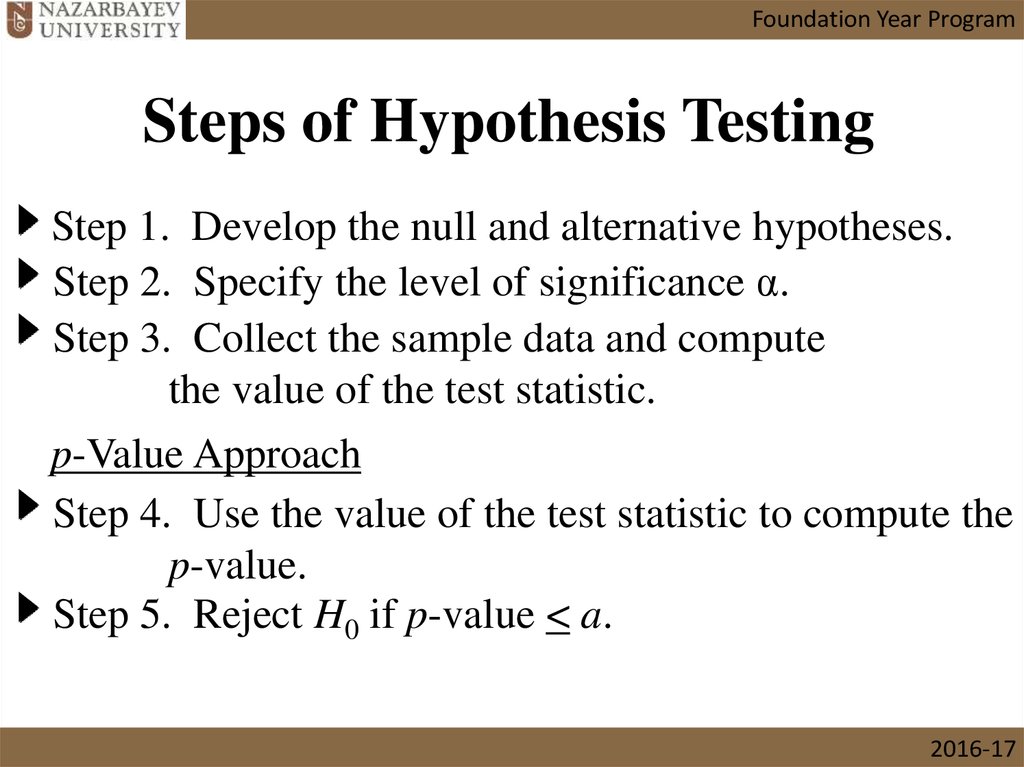
Foundation Year ProgramSteps of Hypothesis Testing
Step 1. Develop the null and alternative hypotheses.
Step 2. Specify the level of significance α.
Step 3. Collect the sample data and compute
the value of the test statistic.
p-Value Approach
Step 4. Use the value of the test statistic to compute the
p-value.
Step 5. Reject H0 if p-value < a.
2016-17
34.
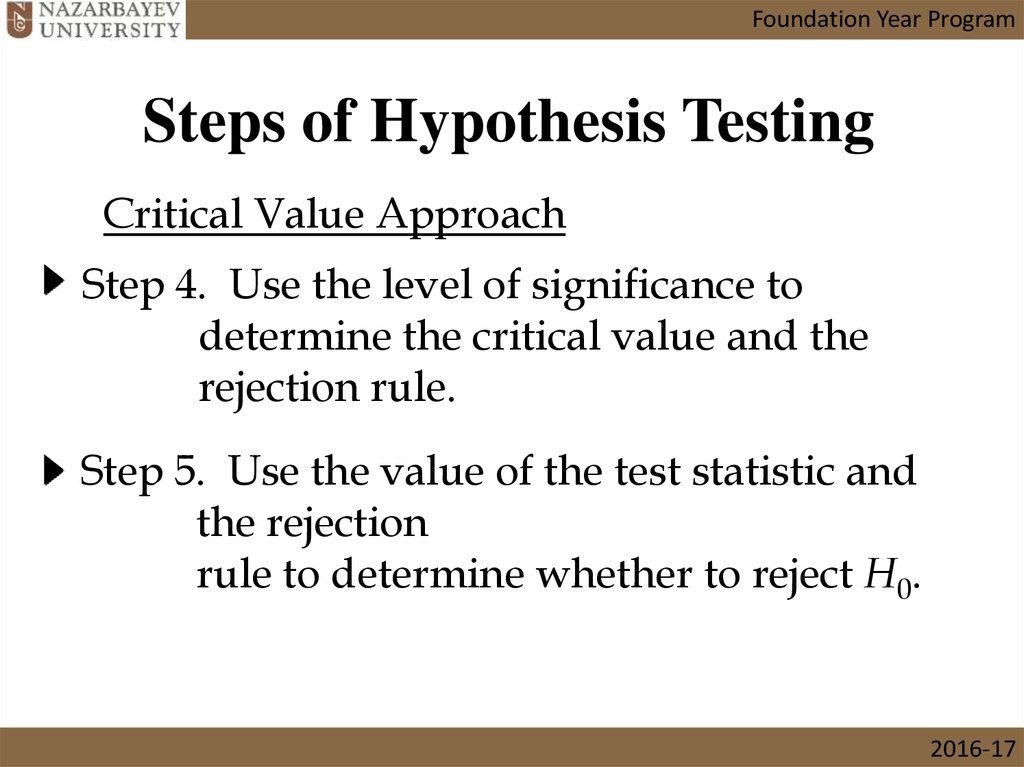
Foundation Year ProgramSteps of Hypothesis Testing
Critical Value Approach
Step 4. Use the level of significance to
determine the critical value and the
rejection rule.
Step 5. Use the value of the test statistic and
the rejection
rule to determine whether to reject H0.
2016-17
35.
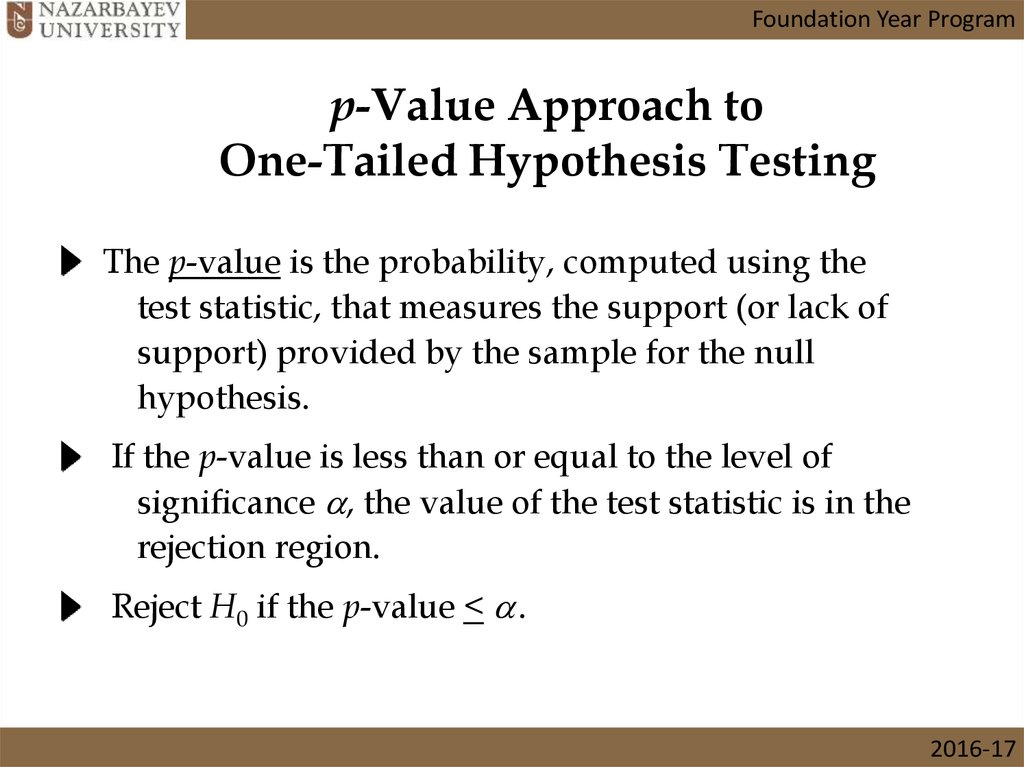
Foundation Year Programp-Value Approach to
One-Tailed Hypothesis Testing
The p-value is the probability, computed using the
test statistic, that measures the support (or lack of
support) provided by the sample for the null
hypothesis.
If the p-value is less than or equal to the level of
significance , the value of the test statistic is in the
rejection region.
Reject H0 if the p-value < .
2016-17
36.
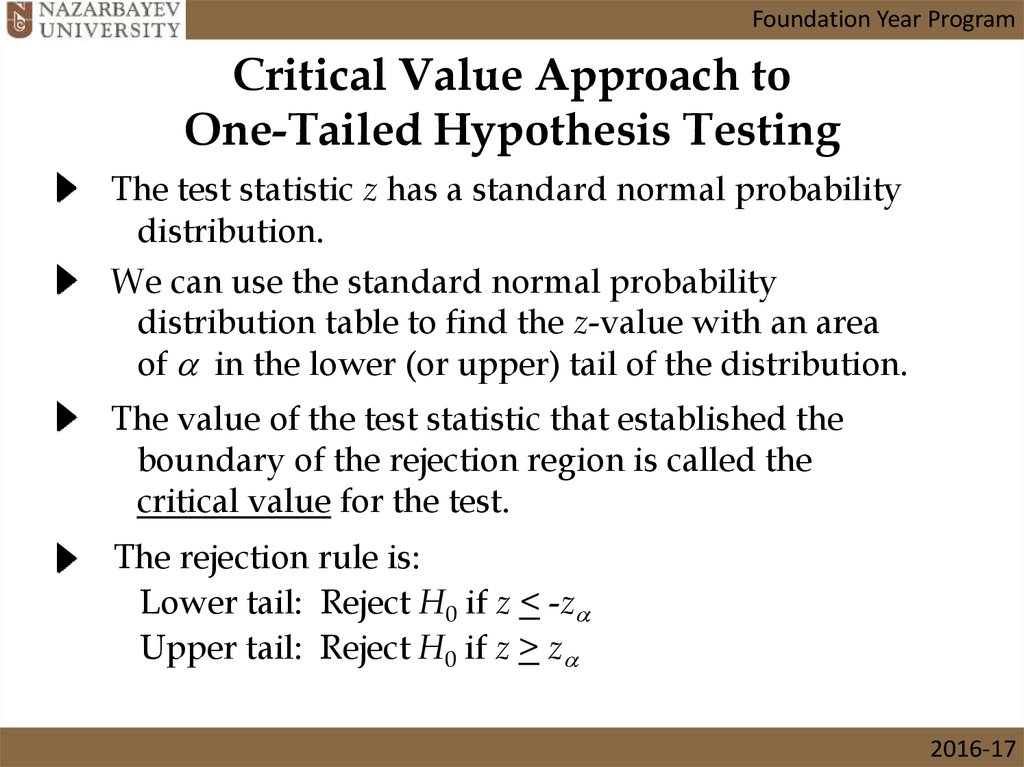
Foundation Year ProgramCritical Value Approach to
One-Tailed Hypothesis Testing
The test statistic z has a standard normal probability
distribution.
We can use the standard normal probability
distribution table to find the z-value with an area
of in the lower (or upper) tail of the distribution.
The value of the test statistic that established the
boundary of the rejection region is called the
critical value for the test.
The rejection rule is:
Lower tail: Reject H0 if z < -z
Upper tail: Reject H0 if z > z
2016-17
37. One-tailed test (left-tailed)
Foundation Year ProgramOne-tailed test (left-tailed)
37
2016-17
38. One-tailed test (right-tailed)
Foundation Year ProgramOne-tailed test (right-tailed)
38
2016-17
39. Two-tailed test
Foundation Year ProgramTwo-tailed test
39
2016-17
40. 7.5.2 Test the hypothesis for a mean of a normal distribution, Ho: µ=k, H1: µ≠k or µ>k or µ<k
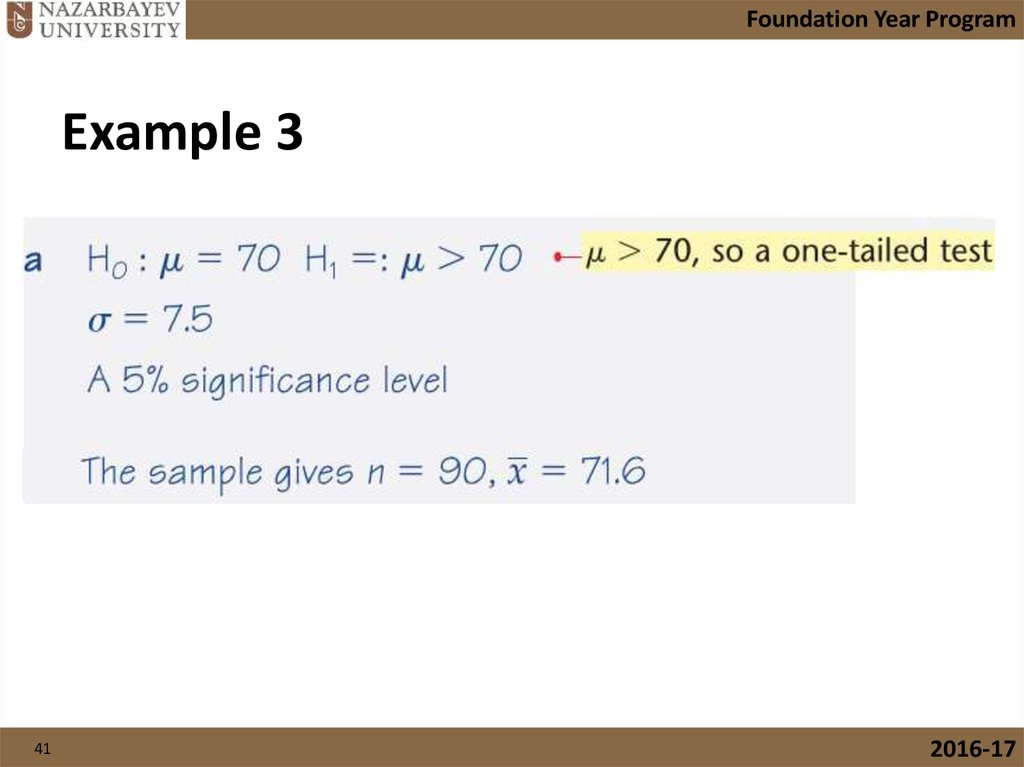
Foundation Year Program7.5.2 Test the hypothesis for a mean of a normal
distribution, Ho: µ=k, H1: µ≠k or µ>k or µ<k
Example 3
40
2016-17
41.
Foundation Year ProgramExample 3
41
2016-17
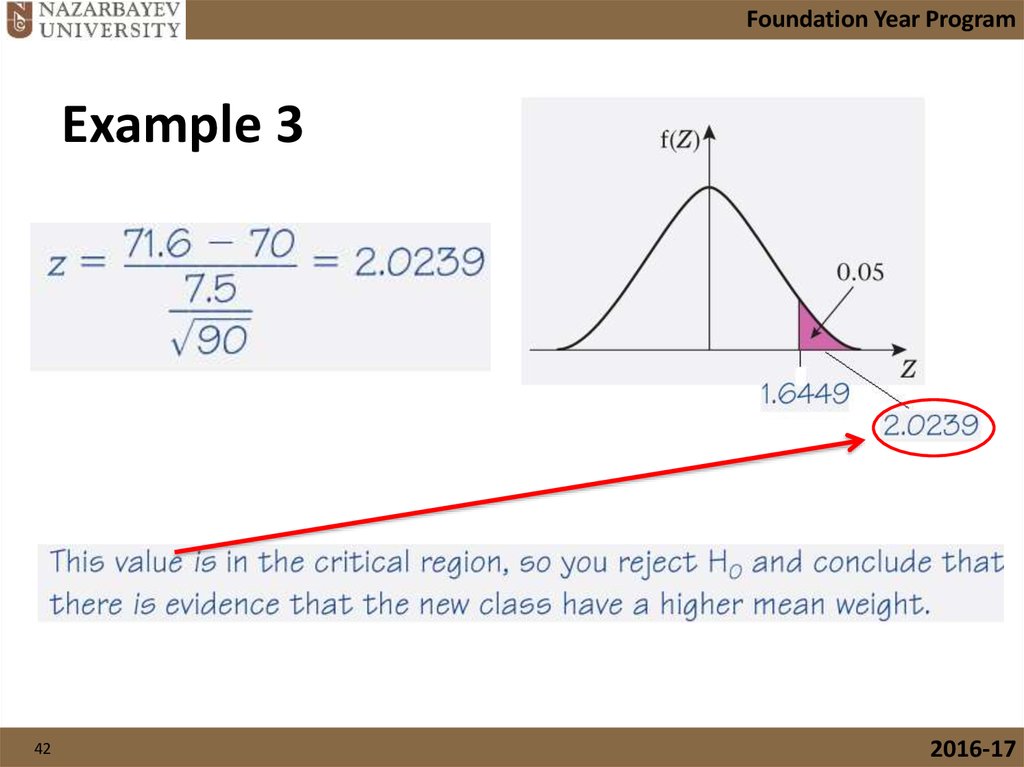
42.
Foundation Year ProgramExample 3
42
2016-17
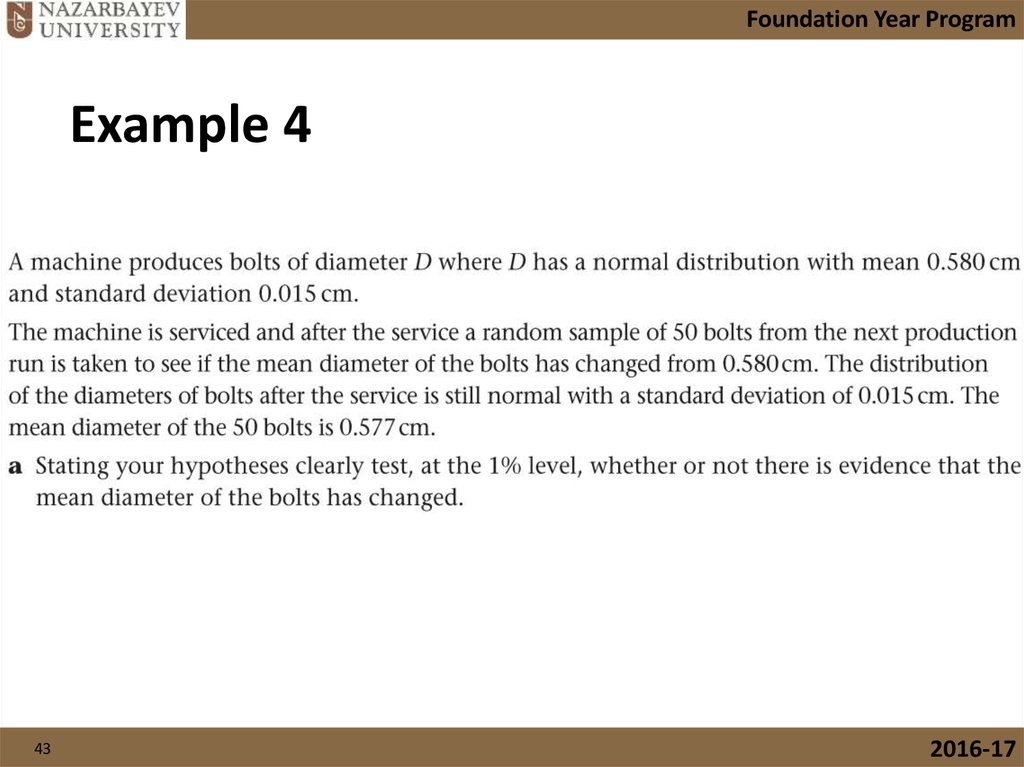
43.
Foundation Year ProgramExample 4
43
2016-17
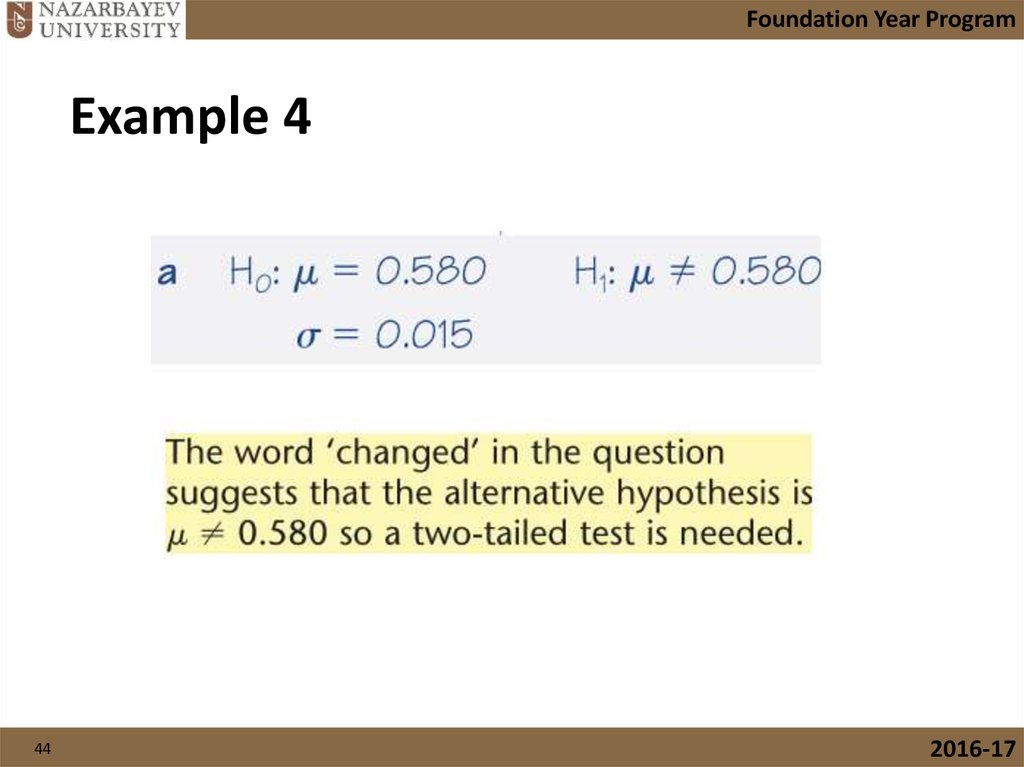
44.
Foundation Year ProgramExample 4
44
2016-17
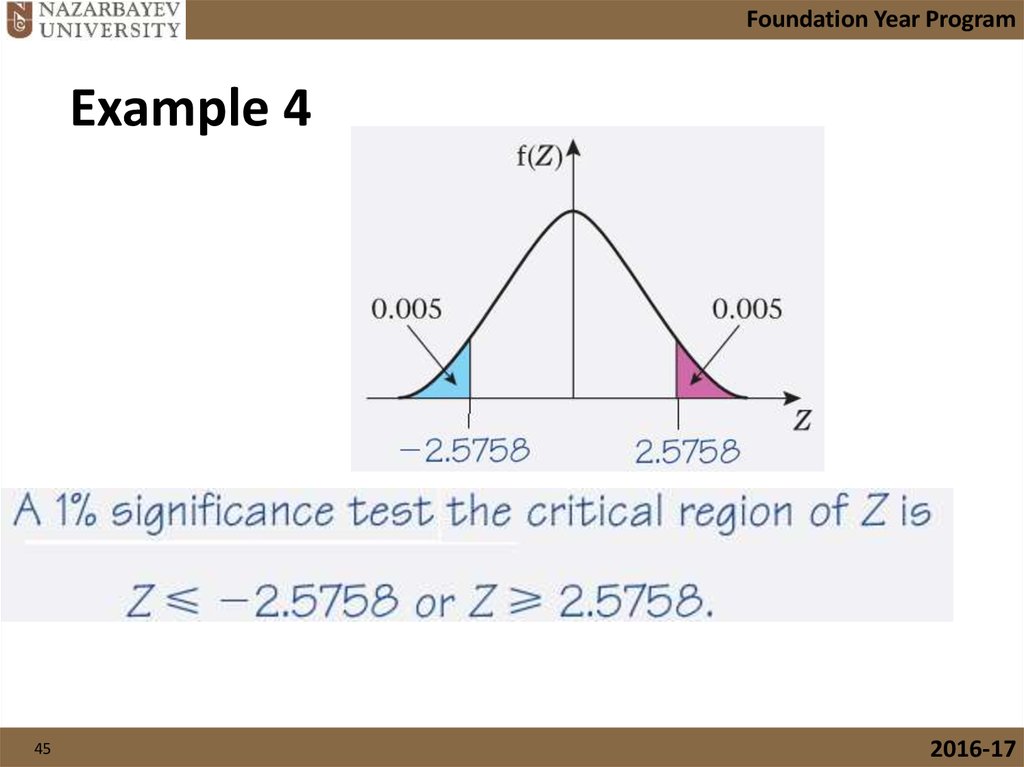
45.
Foundation Year ProgramExample 4
45
2016-17
46.
Foundation Year ProgramExample 4
46
2016-17
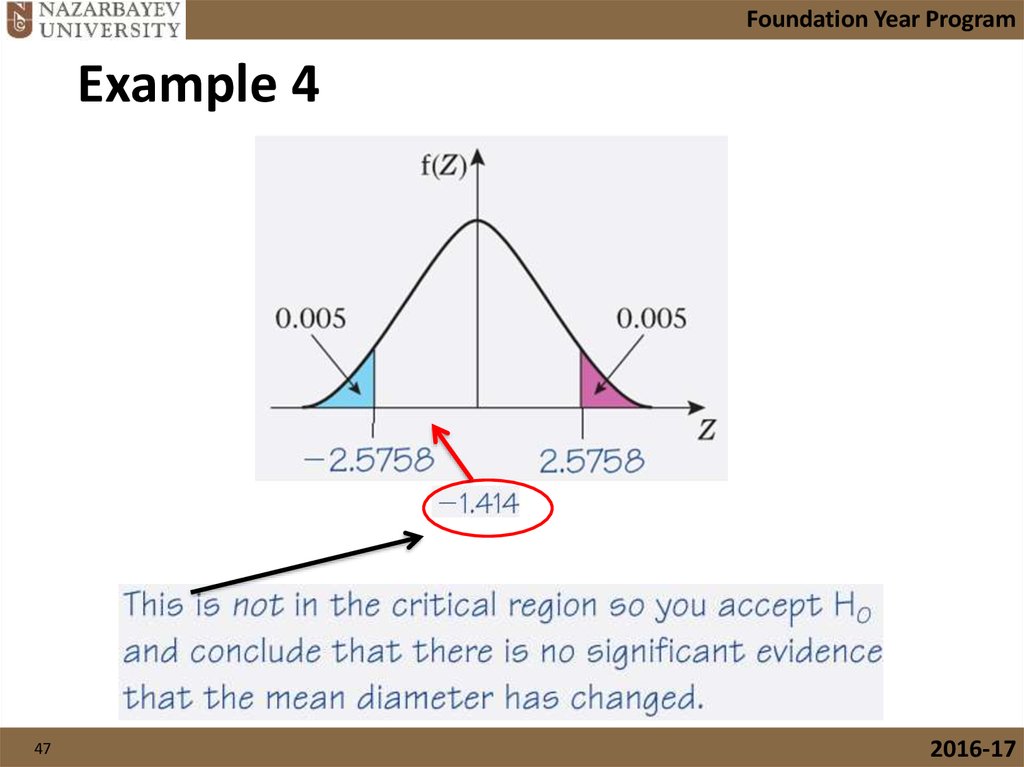
47.
Foundation Year ProgramExample 4
47
2016-17
48. 7.5.2 Test the hypothesis for a mean of a normal distribution, Ho: µ=k, H1: µ≠k or µ>k or µ<k
Foundation Year Program7.5.2 Test the hypothesis for a mean of a normal
distribution, Ho: µ=k, H1: µ≠k or µ>k or µ<k
Example 5
48
2016-17
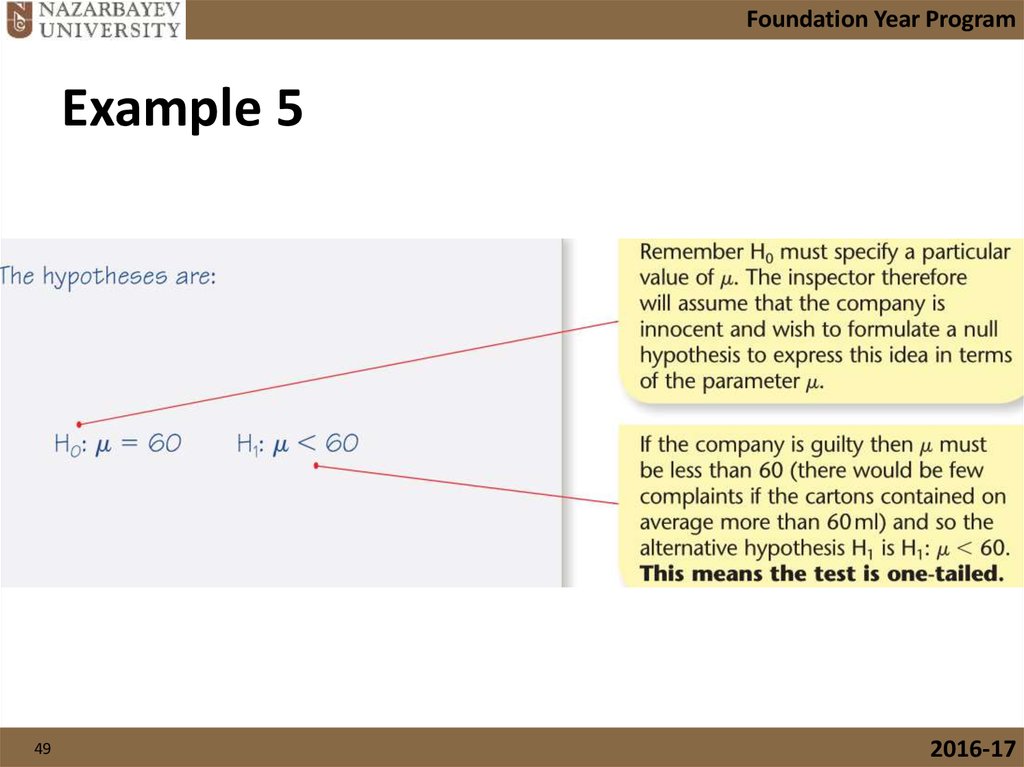
49.
Foundation Year ProgramExample 5
49
2016-17
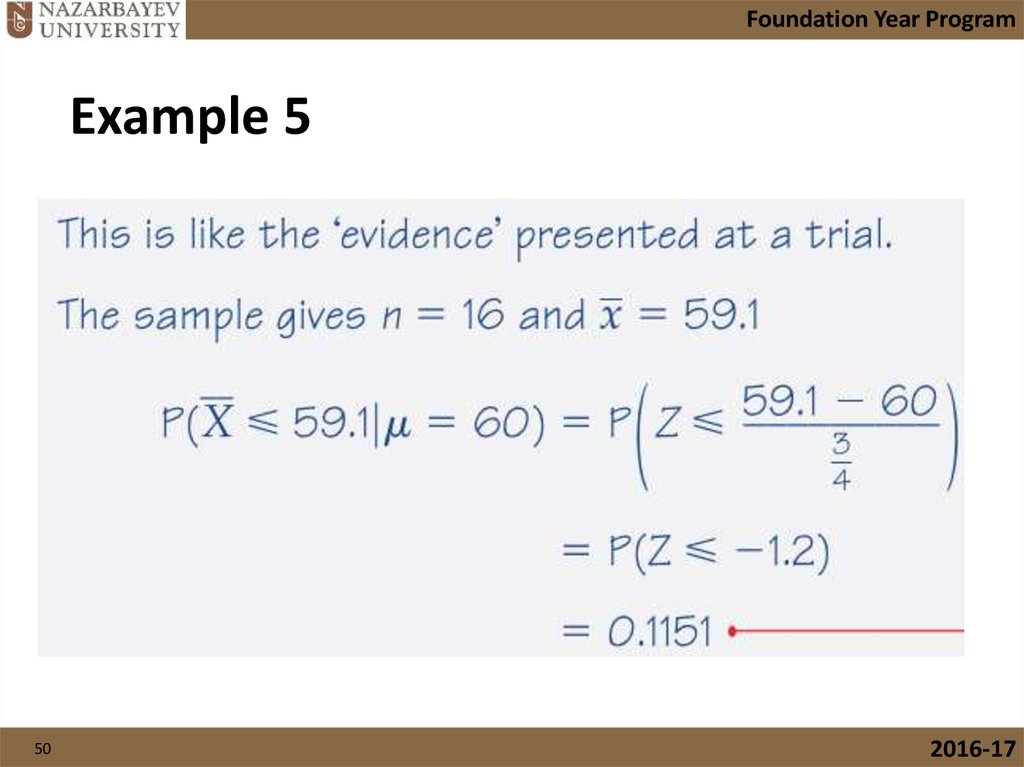
50.
Foundation Year ProgramExample 5
50
2016-17
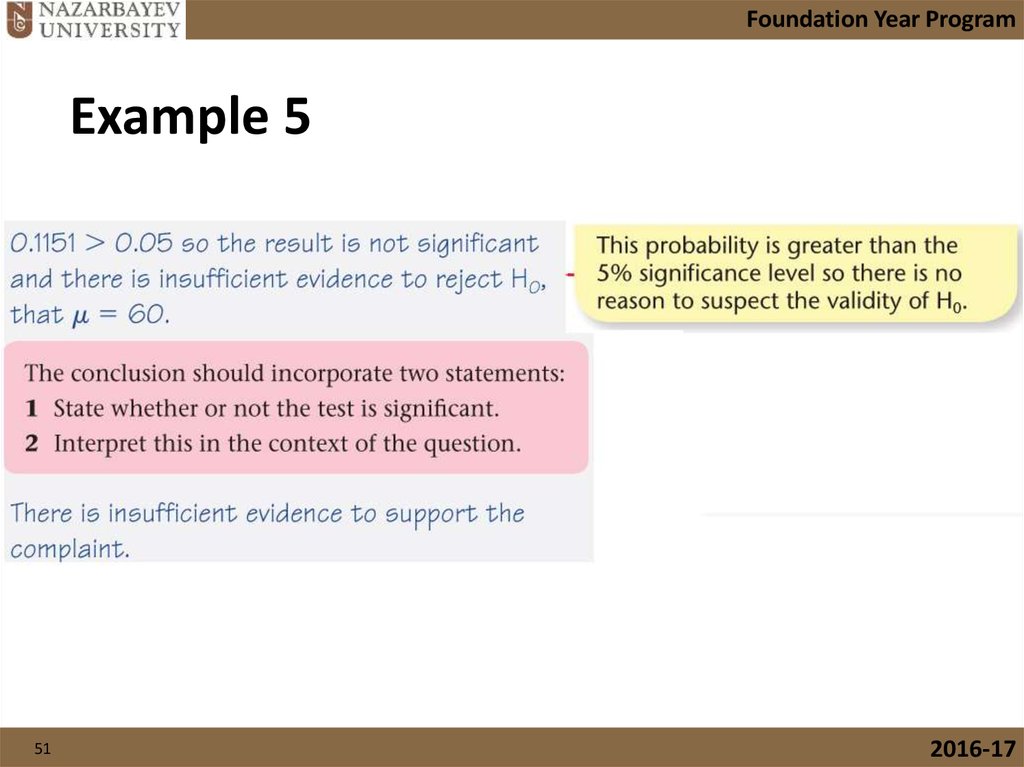
51.
Foundation Year ProgramExample 5
51
2016-17
52. 7.5.3 Test the hypothesis for the difference between means of two independent normal distributions
Foundation Year Program7.5.3 Test the hypothesis for the difference between
means of two independent normal distributions
52
2016-17
53. 7.5.3 Test the hypothesis for the difference between means of two independent normal distributions
Foundation Year Program7.5.3 Test the hypothesis for the difference between
means of two independent normal distributions
53
2016-17
54. 7.5.3 Test the hypothesis for the difference between means of two independent normal distributions
Foundation Year Program7.5.3 Test the hypothesis for the difference between
means of two independent normal distributions
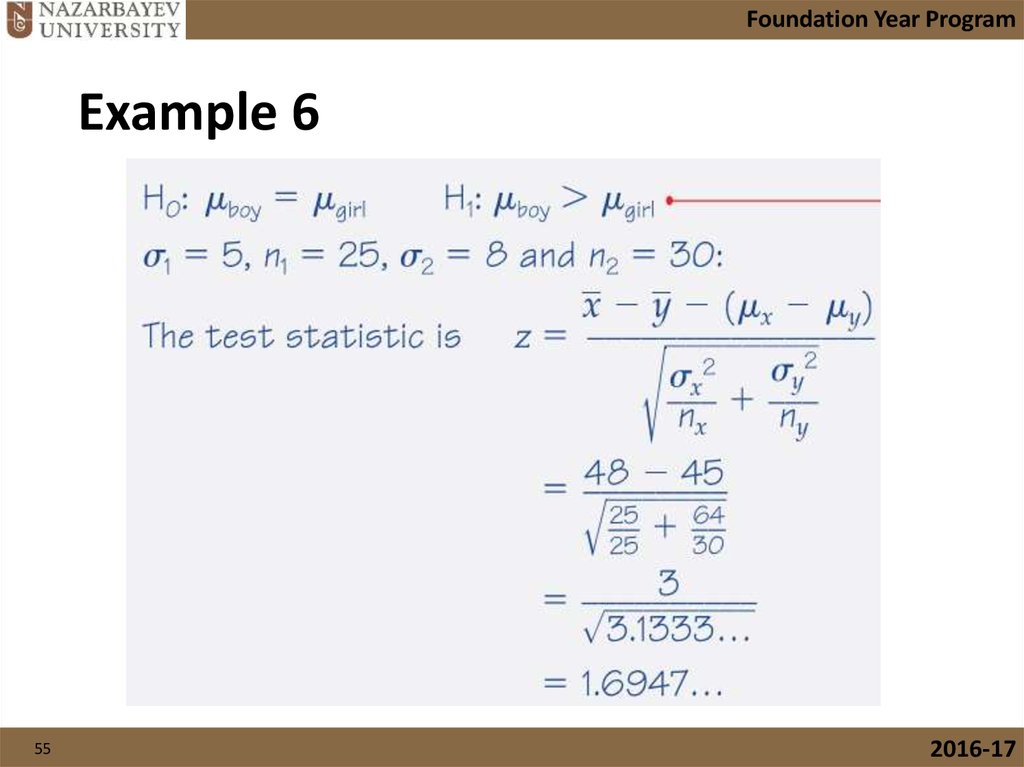
Example 6
54
2016-17
55.
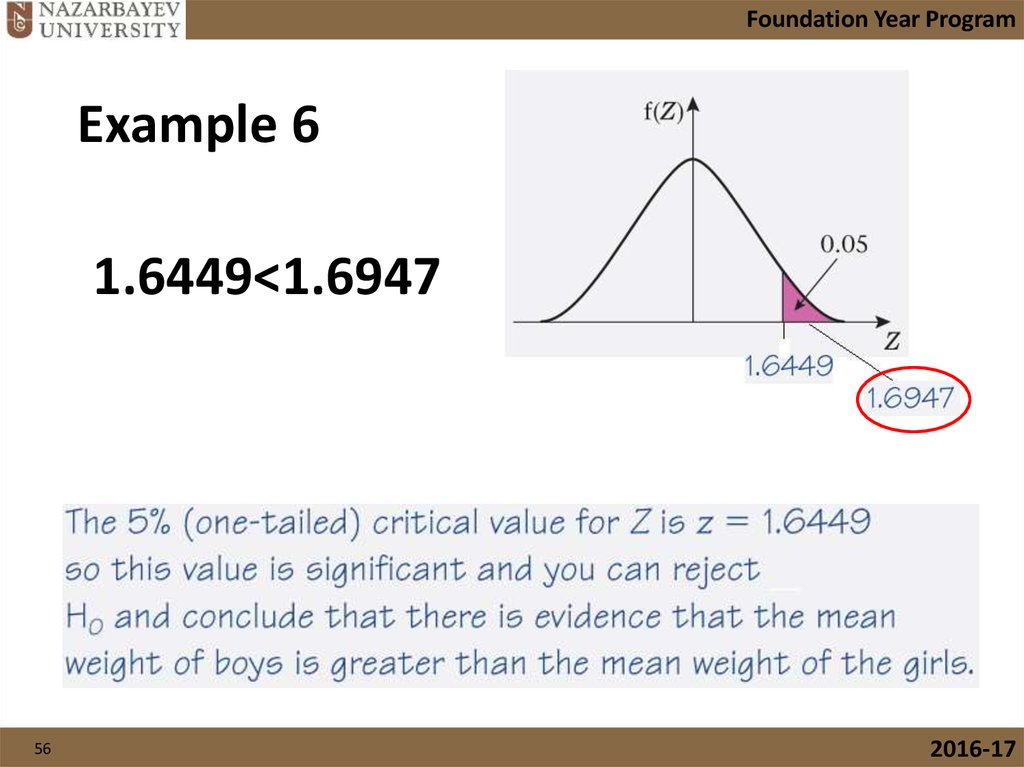
Foundation Year ProgramExample 6
55
2016-17
56.
Foundation Year ProgramExample 6
1.6449<1.6947
56
2016-17