


 mathematics
Similar presentations:


")


Functions and Graphs (lecture 1)
1.
Lecture 1. Functions and Graphs(part 1)
Lecturer : Askar Maulenov, PhD,
associate professor
Askar Maulenov
2.
Content• Definition of function. Examples
• Forms of representing a function
• The domain of a function.
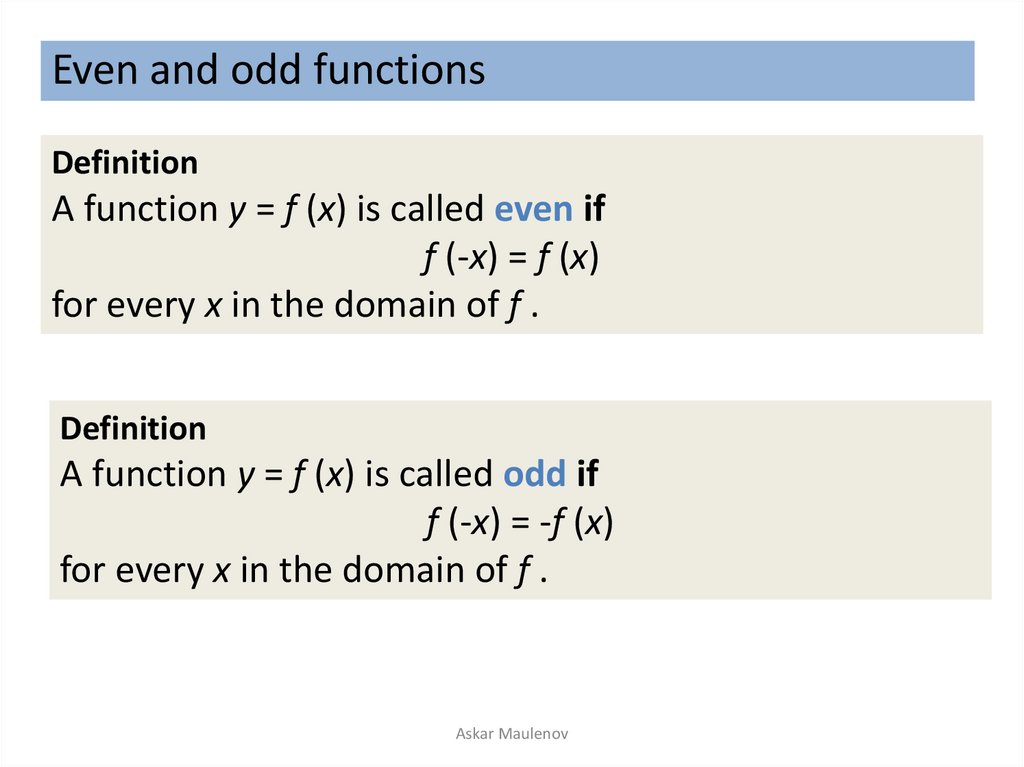
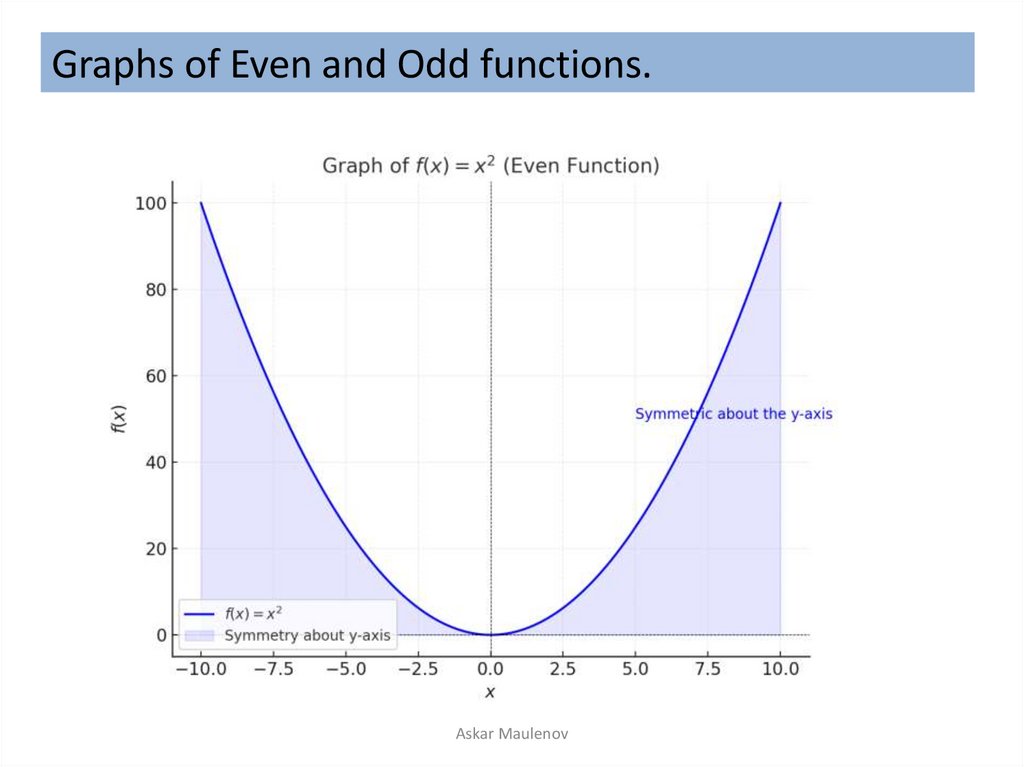
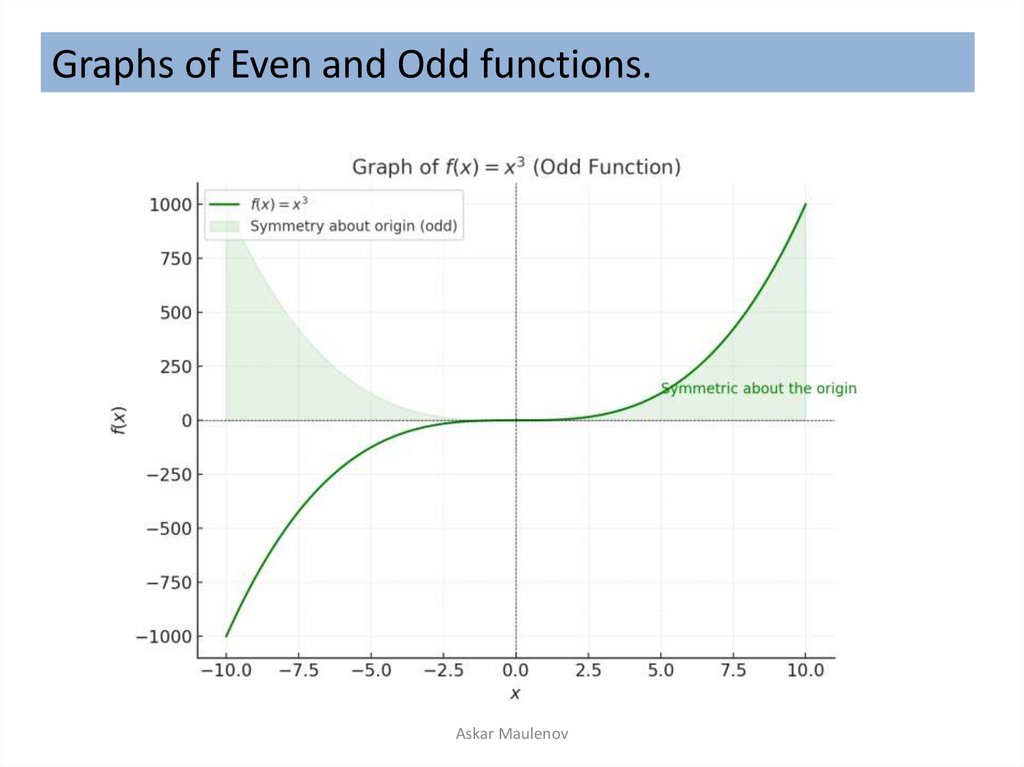
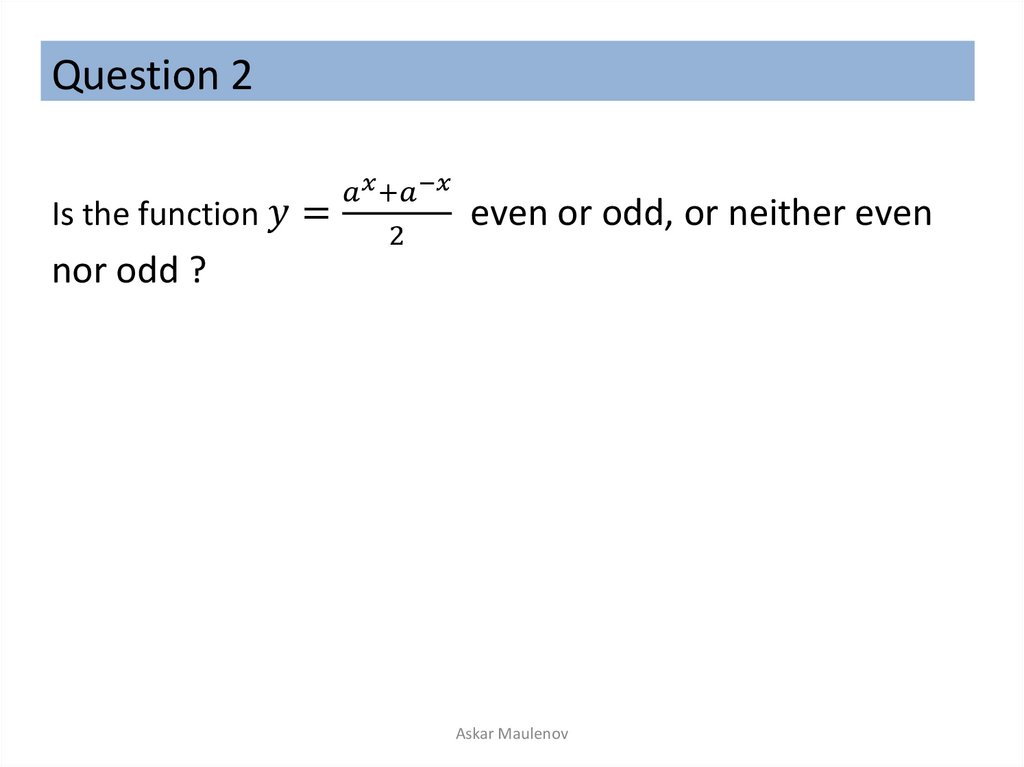
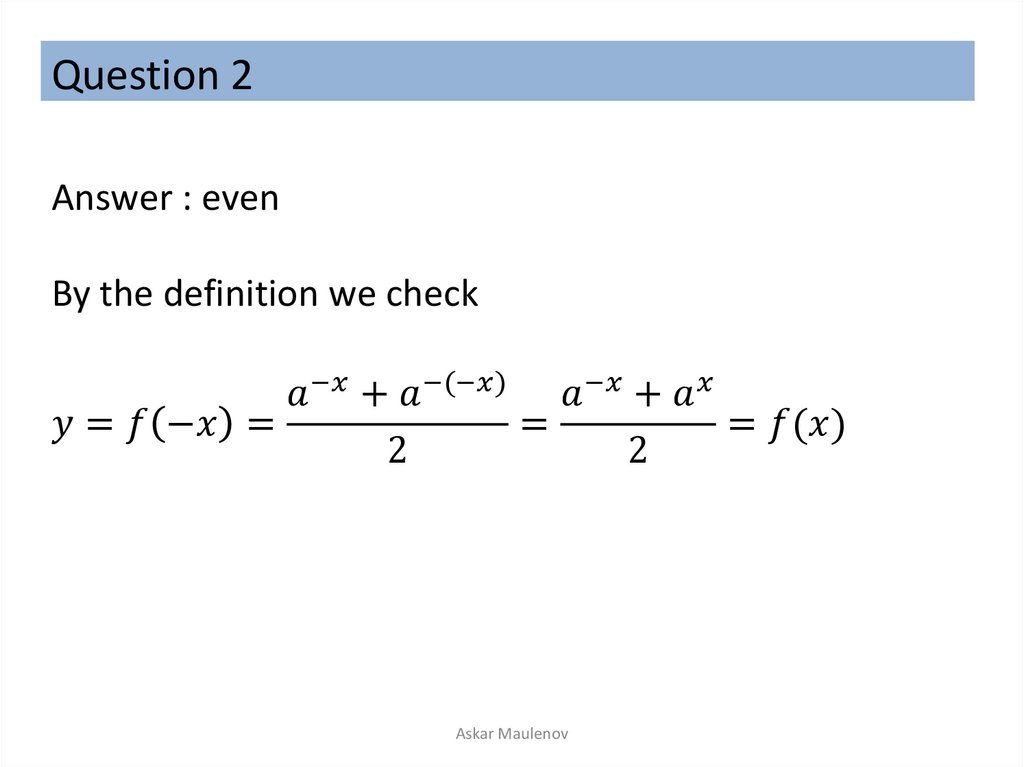
• Even and odd functions. Examples
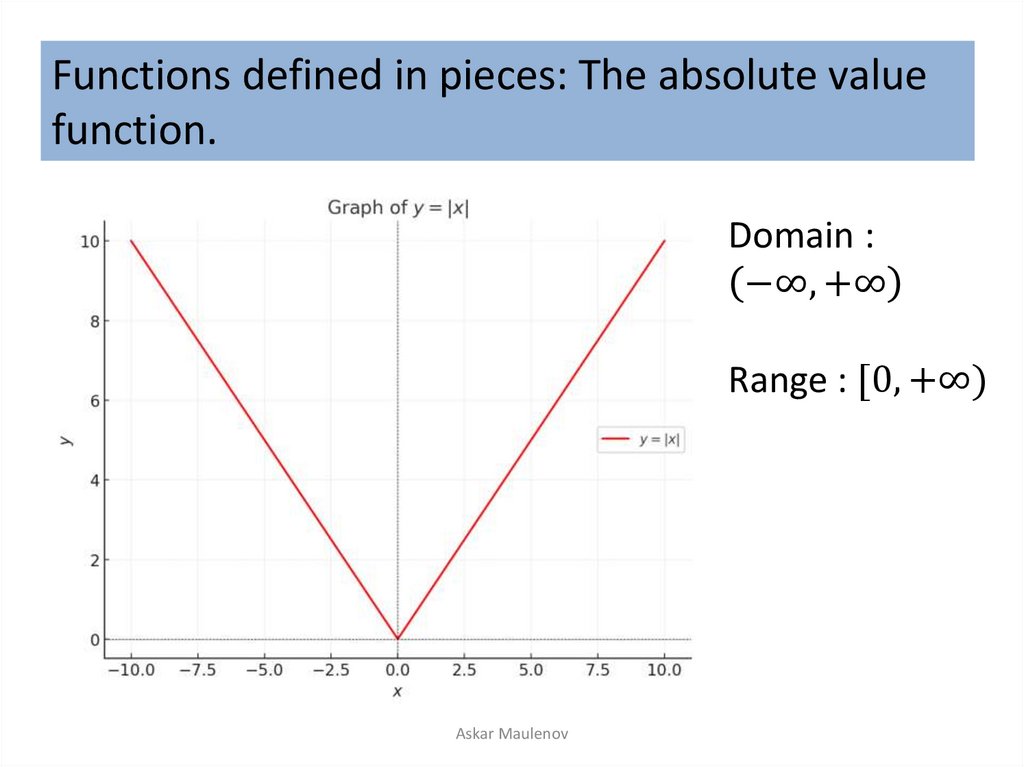
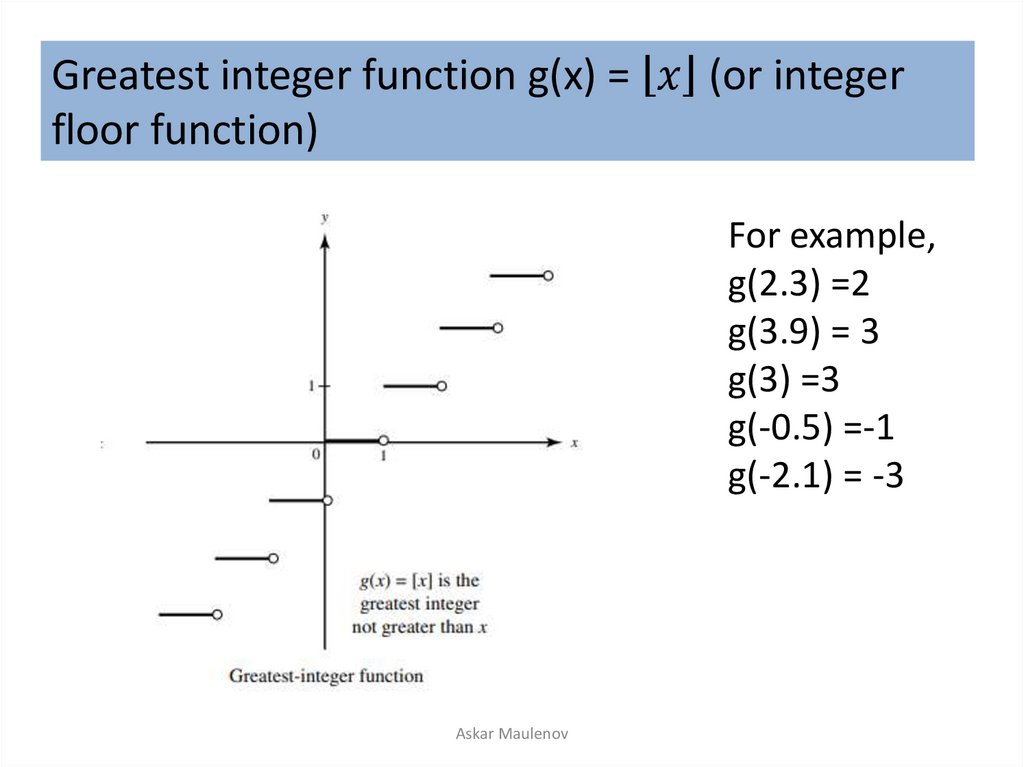
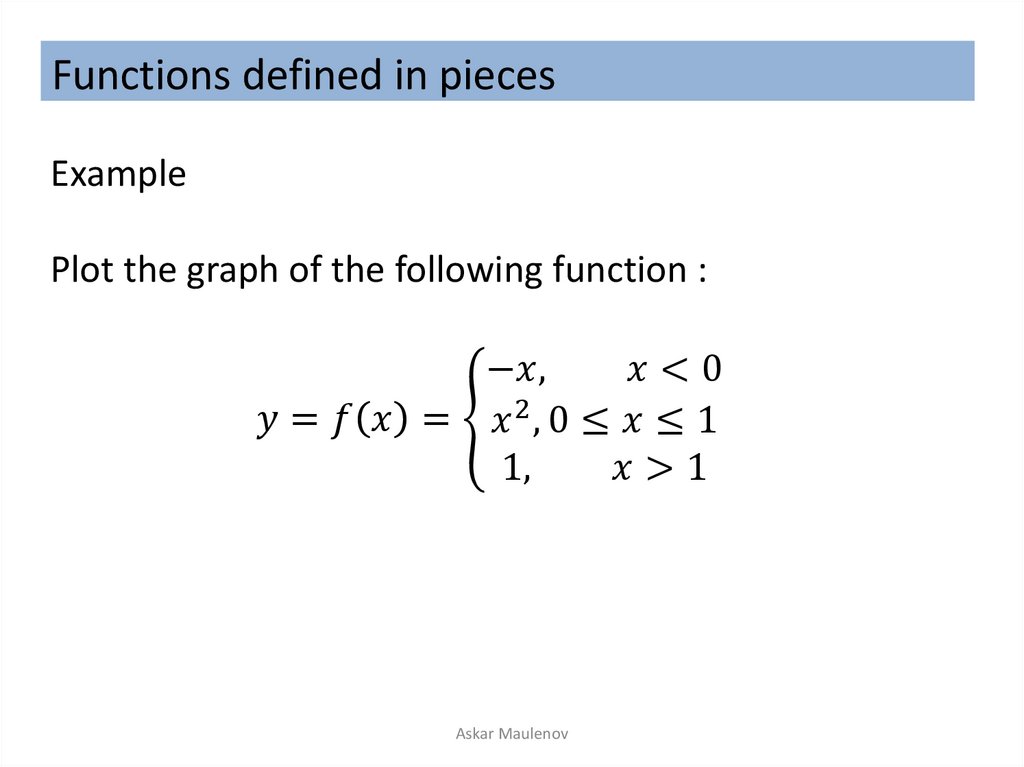
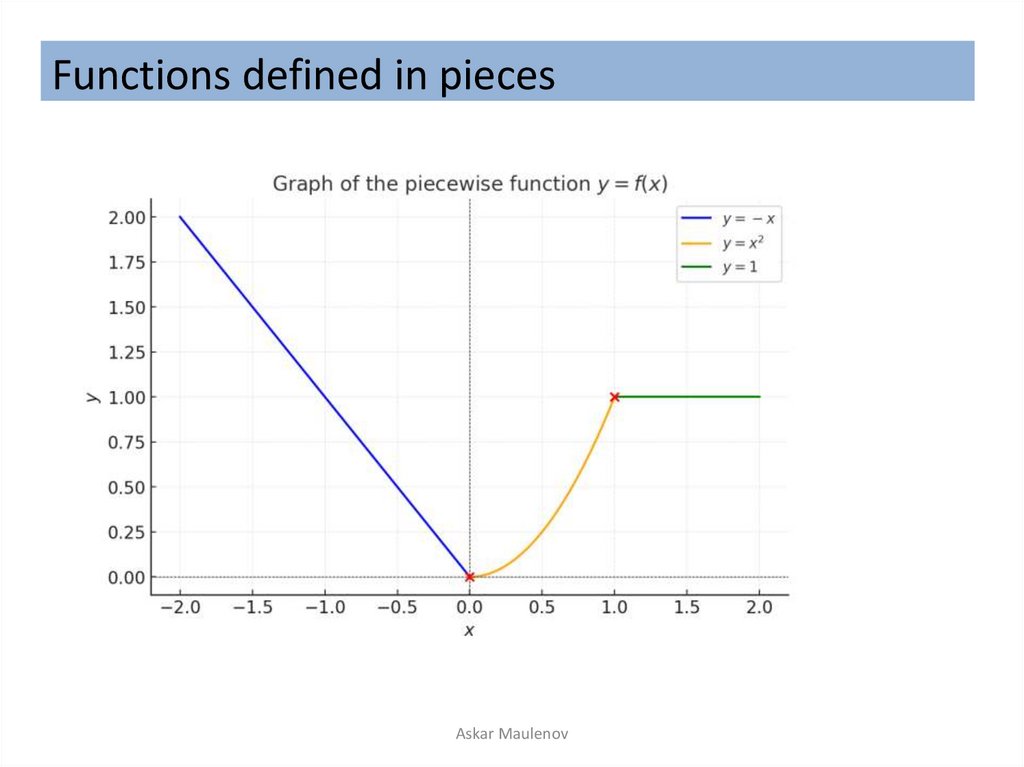
• Functions defined in pieces
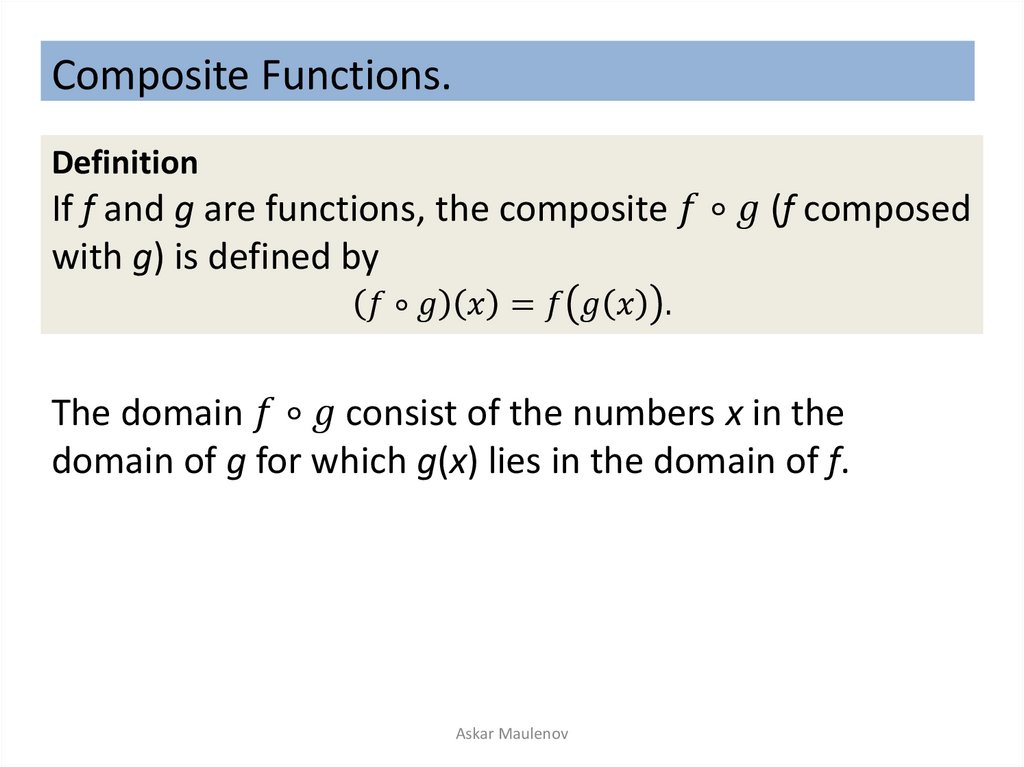
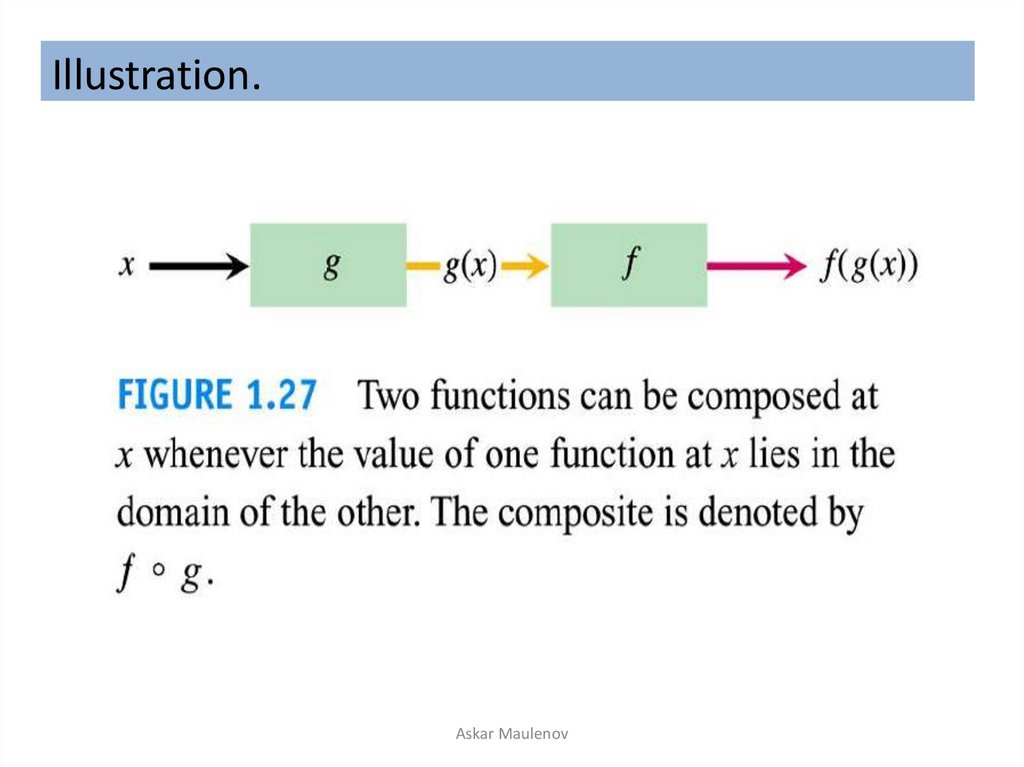
• Composite functions
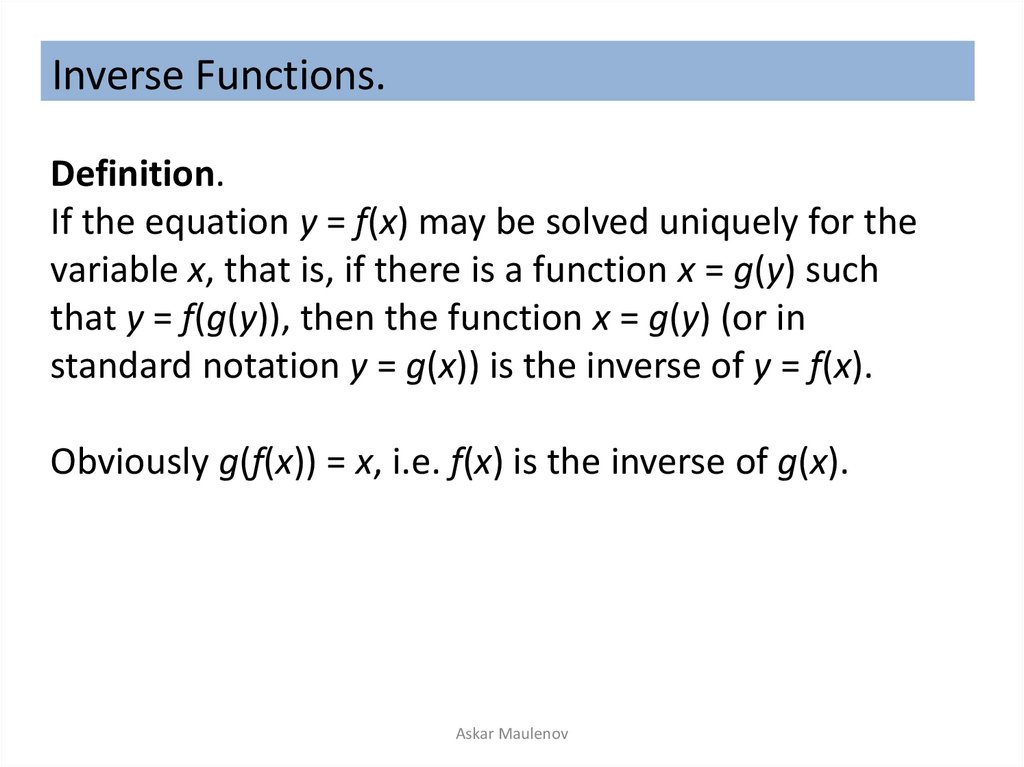
• Inverse functions
• Classification of functions
Askar Maulenov
3.
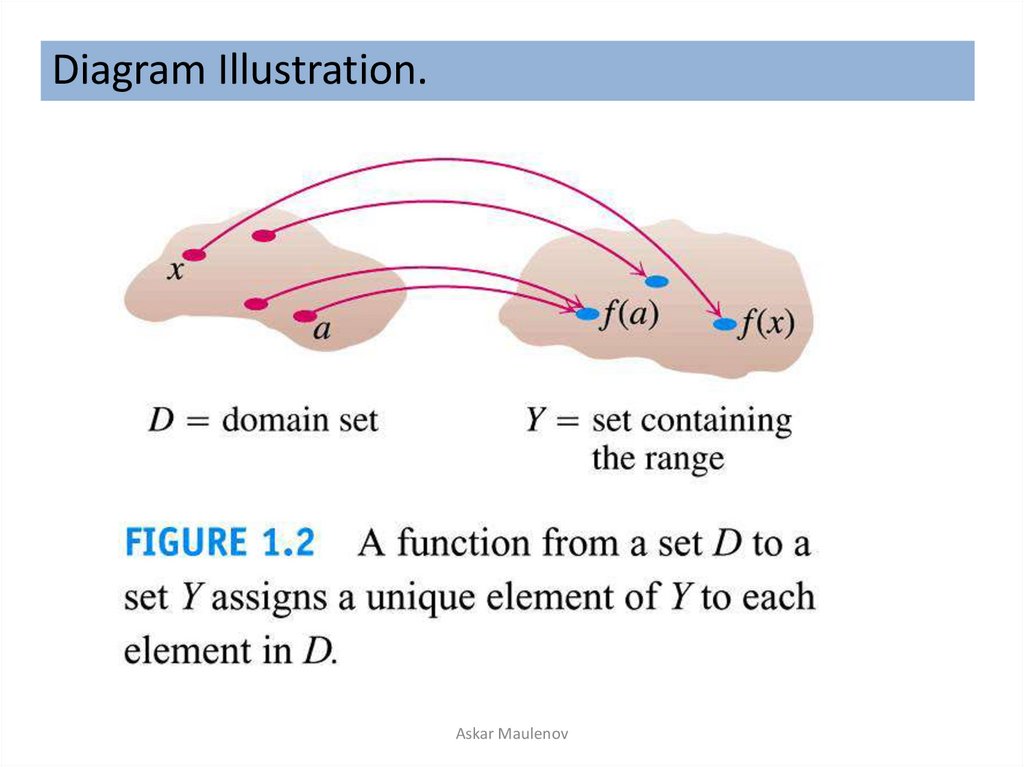
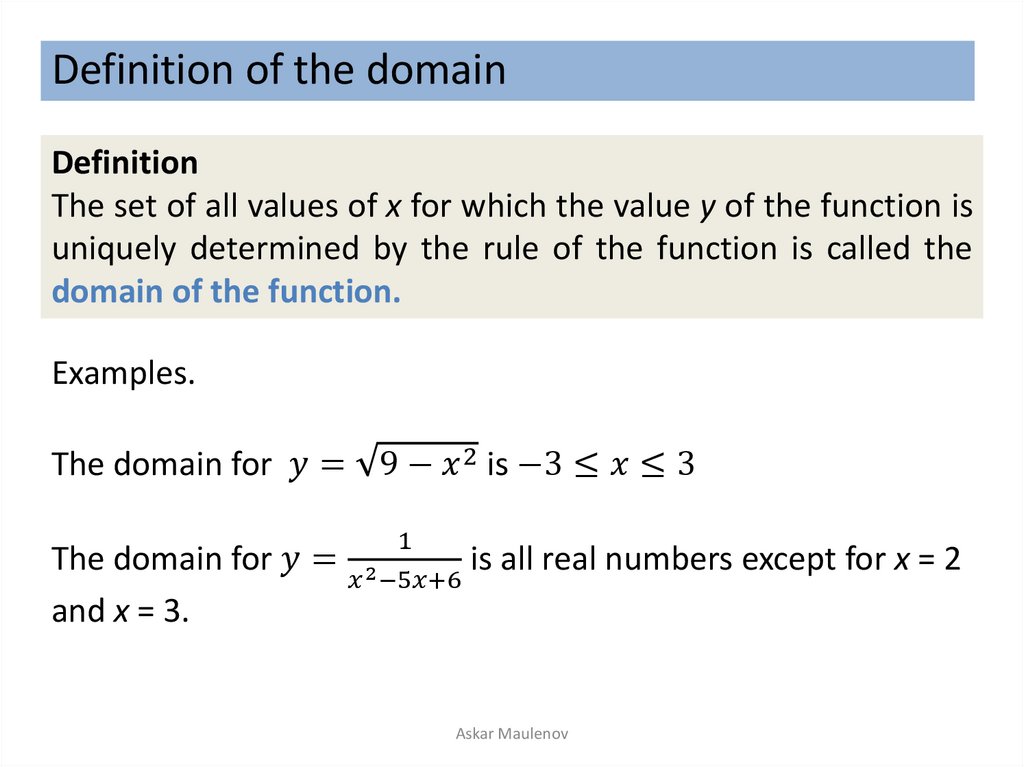
Definition of function.Definition
If to each value of the variable x (independent variable within a
certain range) there corresponds one definite value of another
variable y (dependent variable) ,
then y is a function of x: y = f(x).
We read as “y equals f of x.”
Standard notations :
,
Askar Maulenov
4.
Definition of function.Askar Maulenov
5.
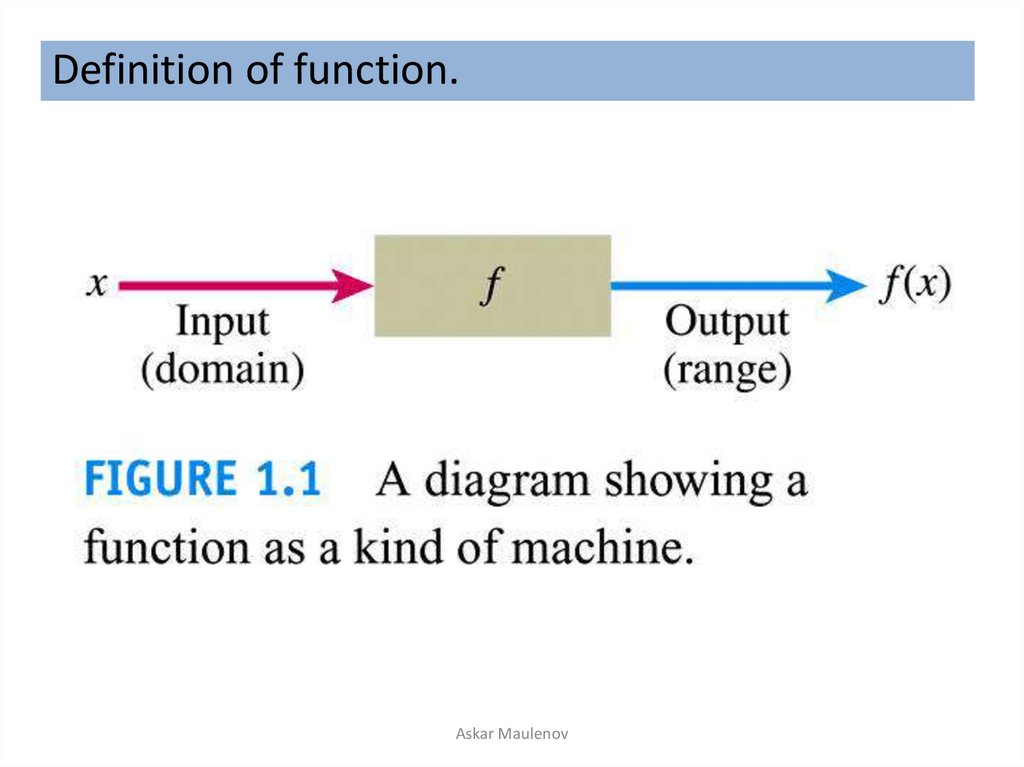
Diagram Illustration.Askar Maulenov
6.
Examples of function.The values of one variable often depend on the values for
another:
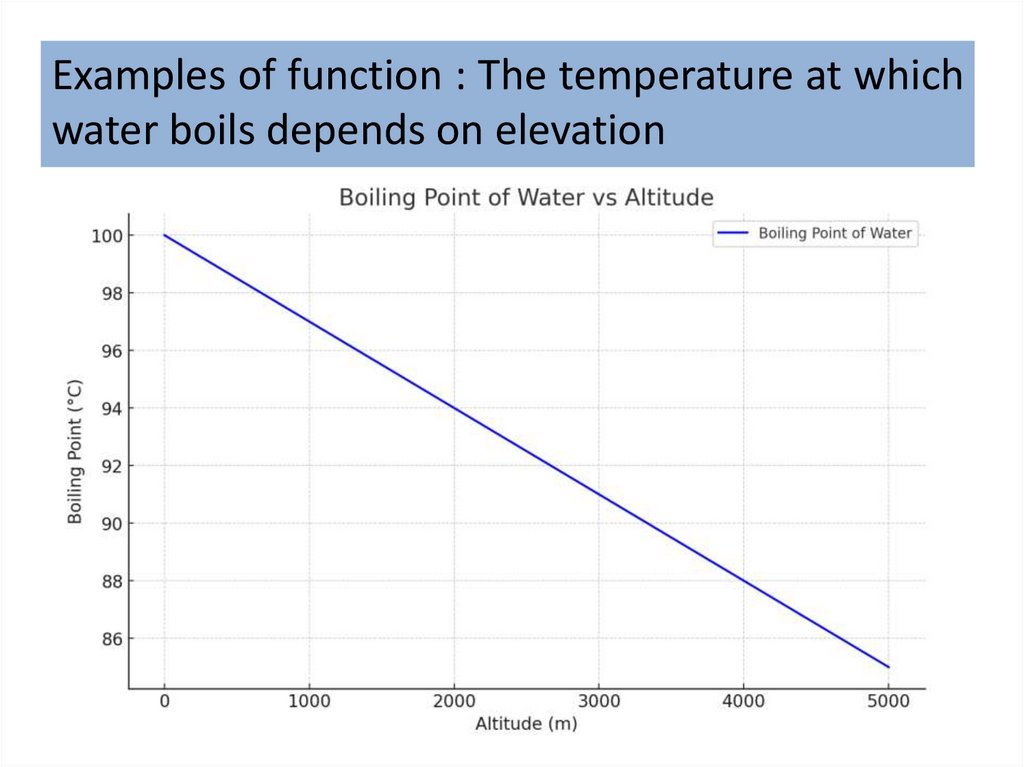
• The temperature at which water boils depends on elevation
(the boiling point drops as you go up due to decreasing
atmospheric pressure).
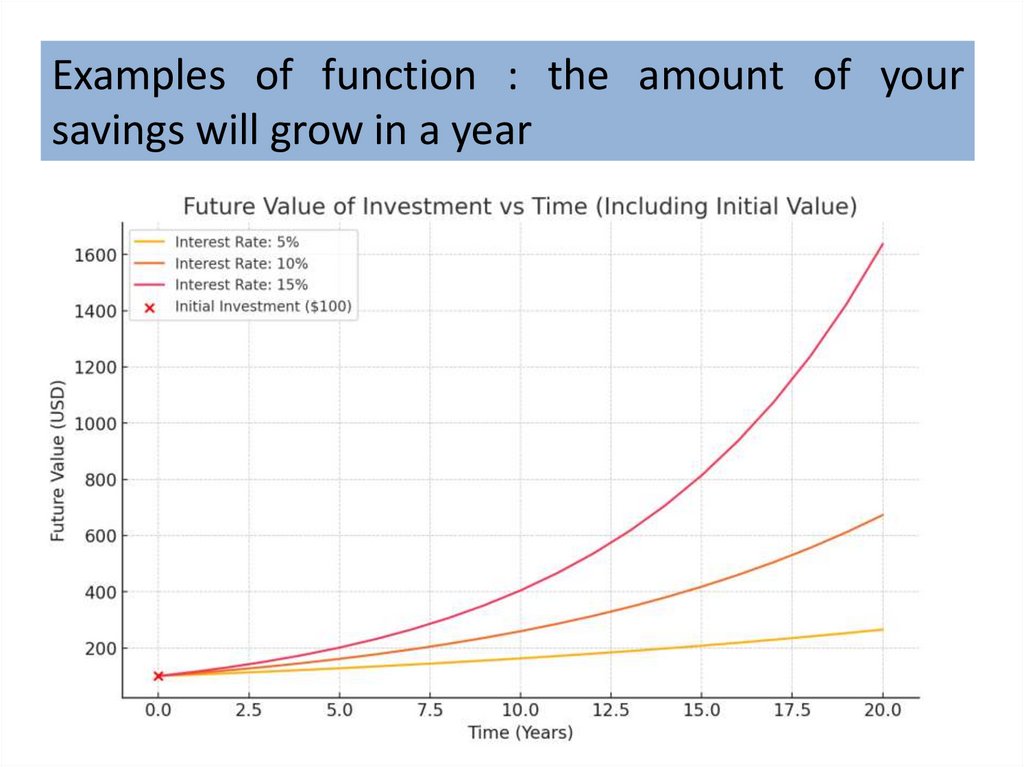
• The amount by which your savings will grow in a year
depends on the interest rate offered by the bank and the
time.
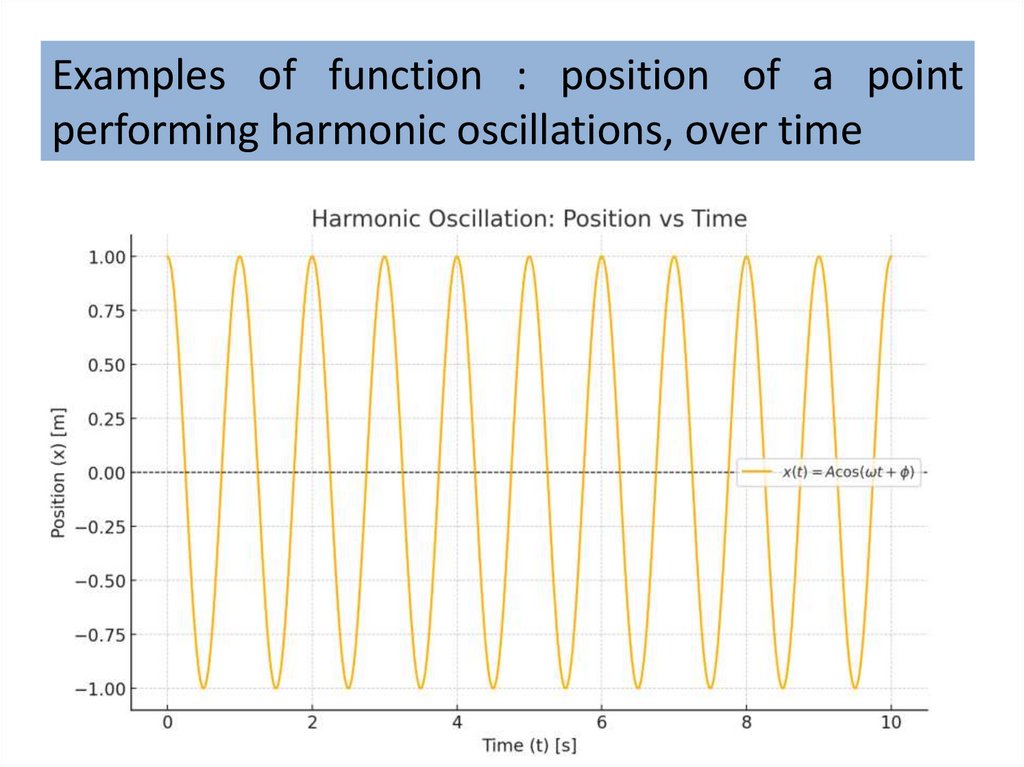
• The position of the point performing harmonic oscillations
depends on time
Askar Maulenov
7.
Examples of function : The temperature at whichwater boils depends on elevation
Askar Maulenov
8.
Examples of function : the amount of yoursavings will grow in a year
Askar Maulenov
9.
Examples of function : position of a pointperforming harmonic oscillations, over time
Askar Maulenov
10.
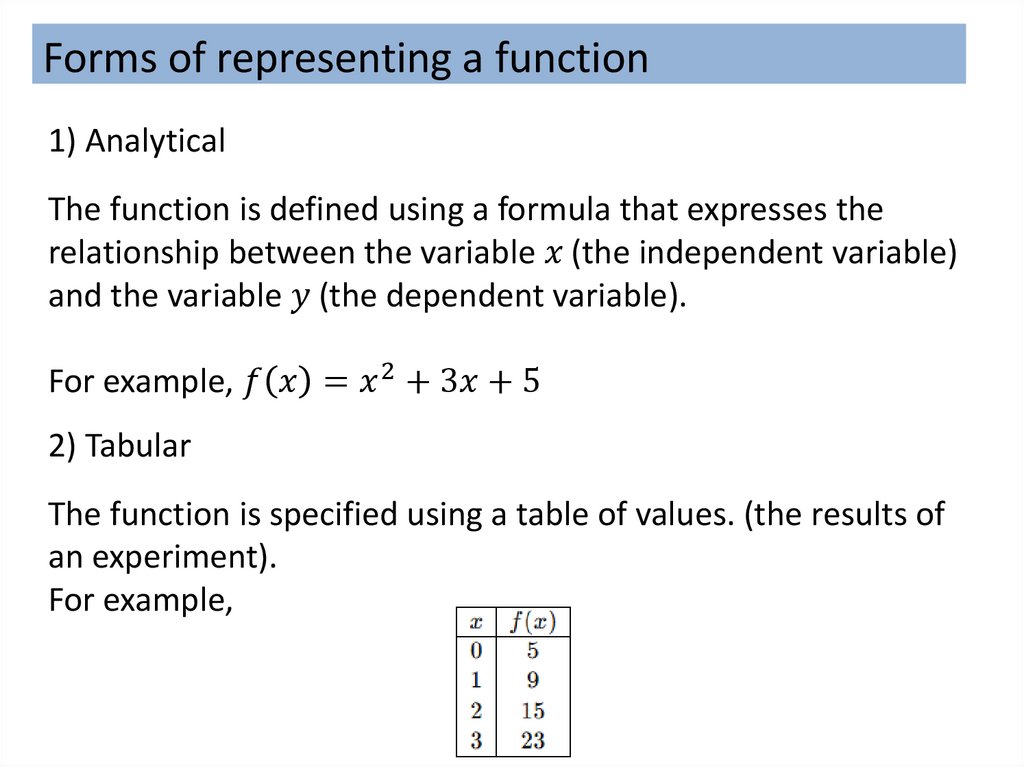
Forms of representing a function1) Analytical
The function is defined using a formula that expresses the
relationship between the variable