


 software
Similar presentations:


")


")


Developed and maintained
1.
EXPEC ARC/GTDIPGEM-ARChem Manual v.8
Developed and maintained by Dr. Nikolaos A. Michael (GTD/EXPEC ARC)/Maria Sideltseva (MRC)
EPPR database support by Zafar Minhas (EDMD) / Geolog connection by Robert Smith (GPD/EXPEC ARC) /
Petrophysical input Meer Ibrahim (EAED) / Geological input Chris Reid (GLOD)
Machine Learning and Similarity Learning: Maria Sideltseva(MRC)
For queries please contact: nikolaos.michael@aramco.com
Saudi Aramco: Company General Use
2.
IPGEM-Path Step 1 Gui Interface1
2
3
4
5
6
The Interface
Four possible input types:
1. Chemostratigraphic database
(EPPR)
2. Well Class – Well tops and logs
3. Input of chemostrat as an xlsx
spreadsheet
4. Interpreted Tops as an xlsx
spreadsheet
5. User can choose the UTM Zone
6. User can choose the focused
interval
Saudi Aramco: Company General Use
3.
Step 1: Select Chemostratigraphic Data(required/optional)
Matlab file that contains all
the Chemostratigraphic data
from EPPR transformed into
an ARChem native format.
It is a table that contains all
the elemental information
for every well and every
sample in the database.
Saudi Aramco: Company General Use
4.
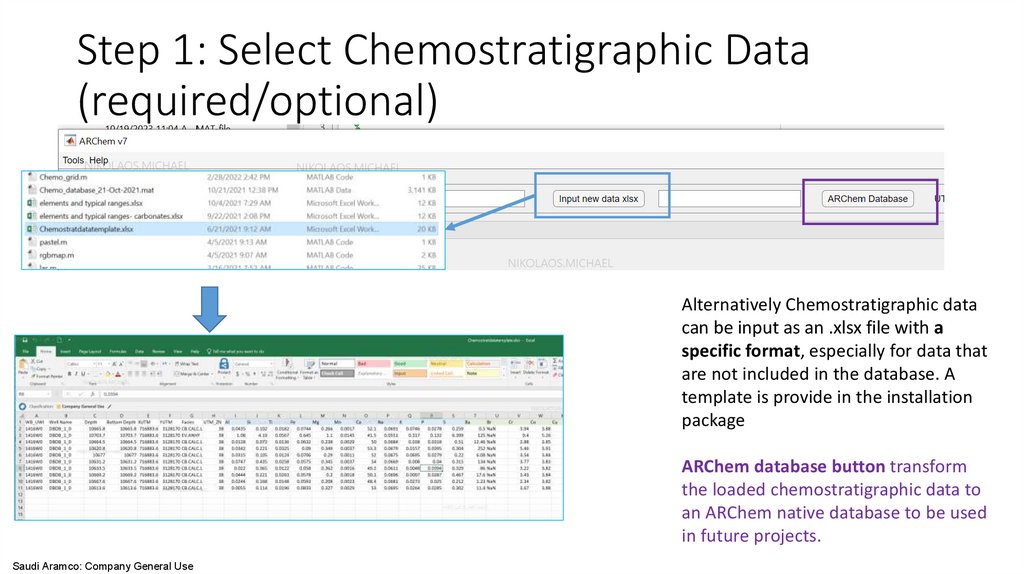
Step 1: Select Chemostratigraphic Data(required/optional)
Alternatively Chemostratigraphic data
can be input as an .xlsx file with a
specific format, especially for data that
are not included in the database. A
template is provide in the installation
package
ARChem database button transform
the loaded chemostratigraphic data to
an ARChem native database to be used
in future projects.
Saudi Aramco: Company General Use
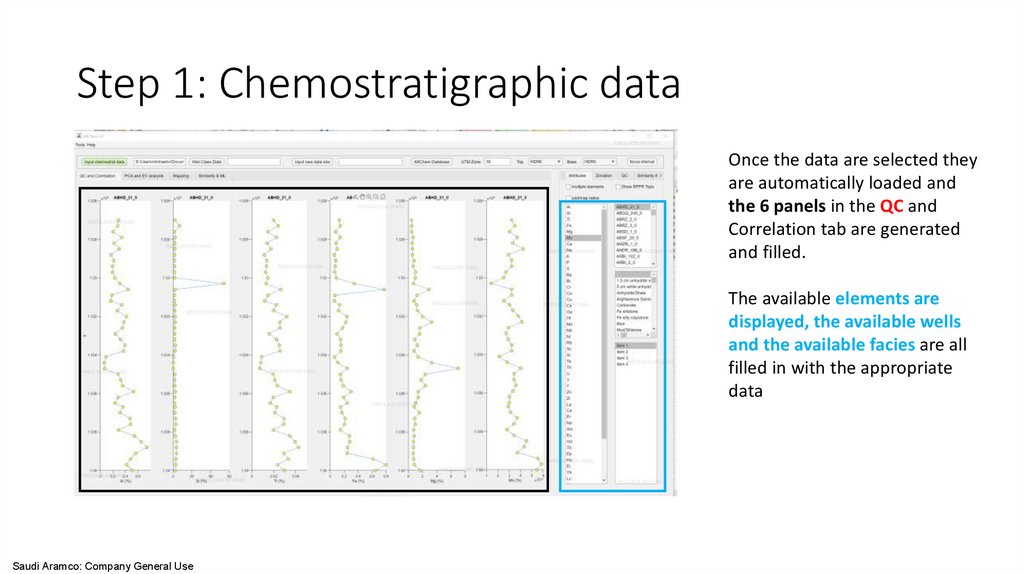
5.
Step 1: Chemostratigraphic dataOnce the data are selected they
are automatically loaded and
the 6 panels in the QC and
Correlation tab are generated
and filled.
The available elements are
displayed, the available wells
and the available facies are all
filled in with the appropriate
data
Saudi Aramco: Company General Use
6.
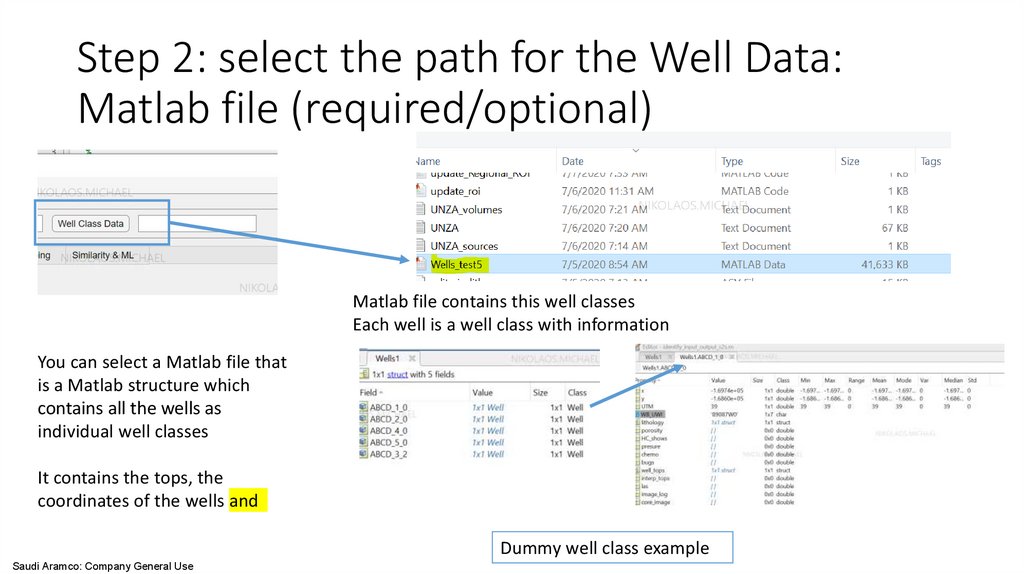
Step 2: select the path for the Well Data:Matlab file (required/optional)
Matlab file contains this well classes
Each well is a well class with information
You can select a Matlab file that
is a Matlab structure which
contains all the wells as
individual well classes
It contains the tops, the
coordinates of the wells and
Dummy well class example
Saudi Aramco: Company General Use
7.
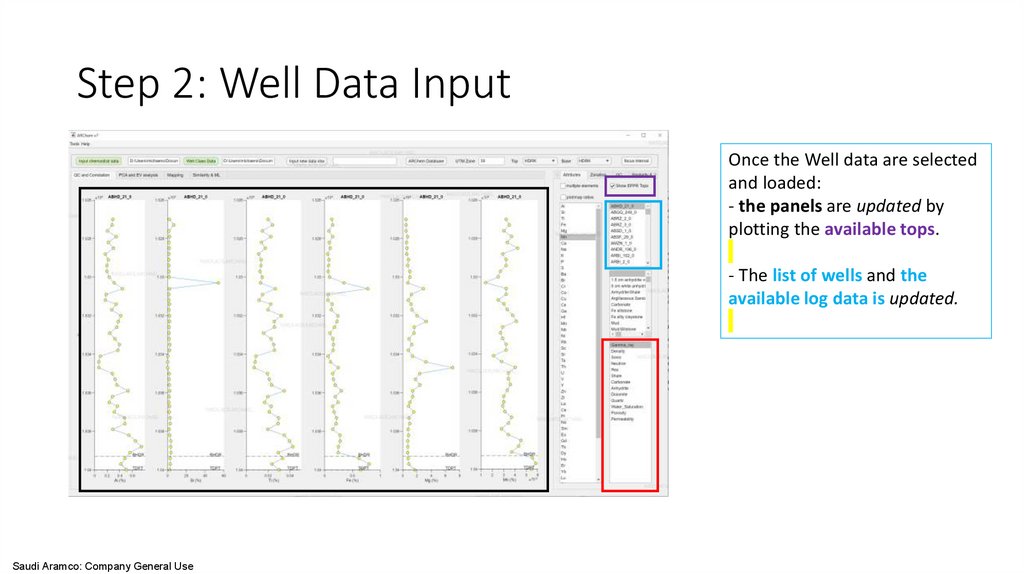
Step 2: Well Data InputOnce the Well data are selected
and loaded:
- the panels are updated by
plotting the available tops.
- The list of wells and the
available log data is updated.
Saudi Aramco: Company General Use
8.
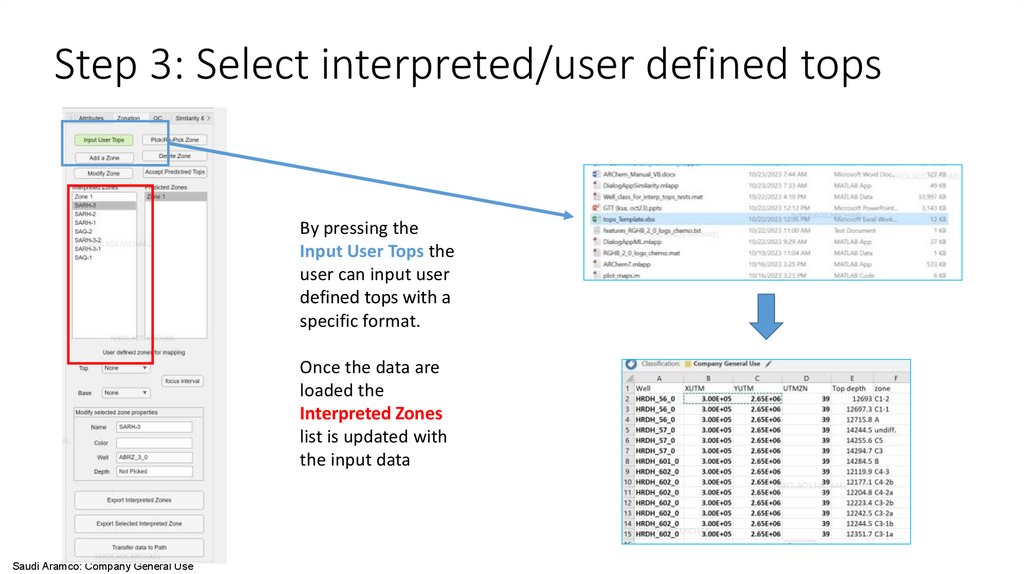
Step 3: Select interpreted/user defined topsBy pressing the
Input User Tops the
user can input user
defined tops with a
specific format.
Once the data are
loaded the
Interpreted Zones
list is updated with
the input data
Saudi Aramco: Company General Use
9.
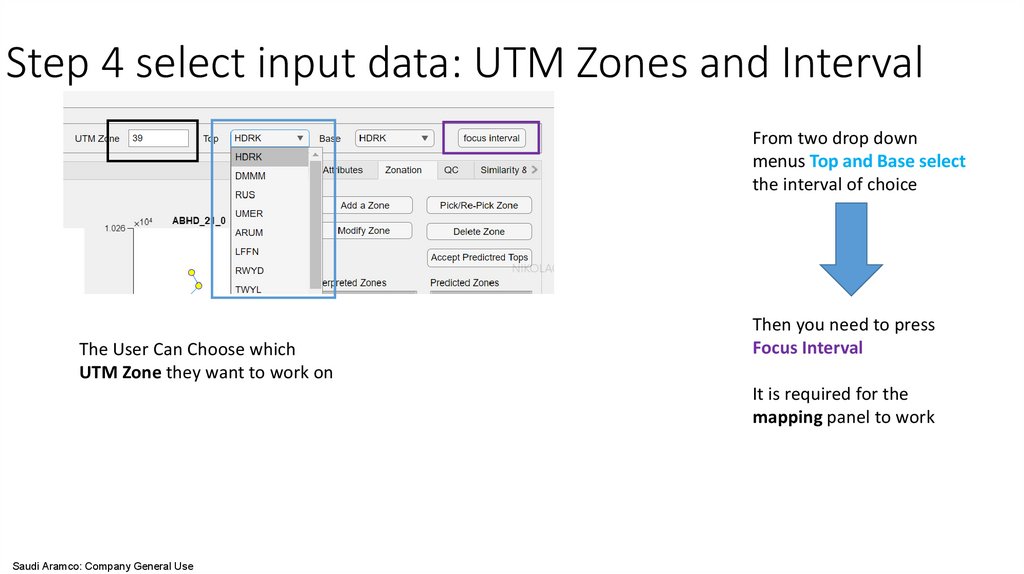
Step 4 select input data: UTM Zones and IntervalFrom two drop down
menus Top and Base select
the interval of choice
The User Can Choose which
UTM Zone they want to work on
Then you need to press
Focus Interval
It is required for the
mapping panel to work
Saudi Aramco: Company General Use
10.
Creating the Well Class: Step A1
2
3
5
4
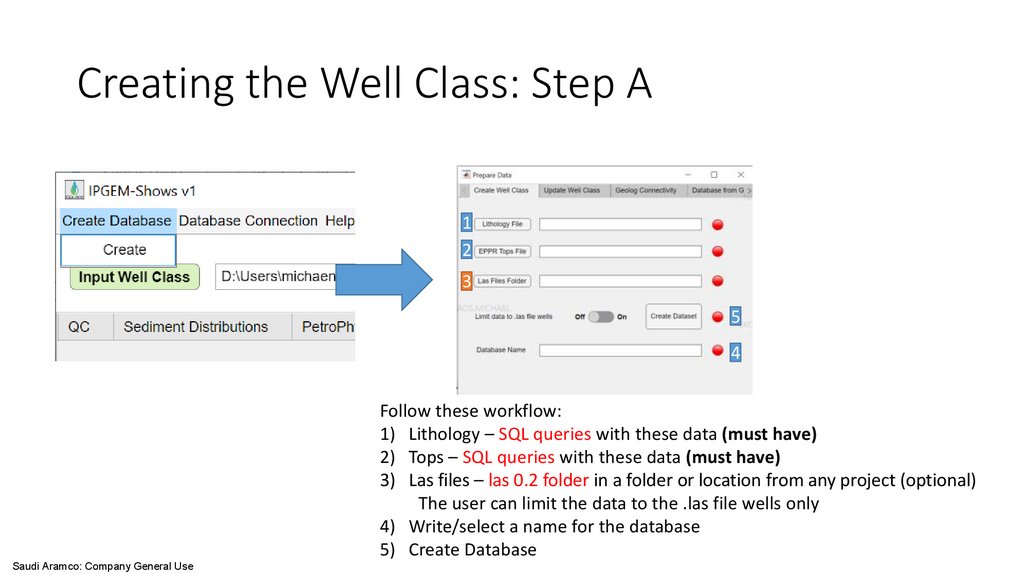
Follow these workflow:
1) Lithology – SQL queries with these data (must have)
2) Tops – SQL queries with these data (must have)
3) Las files – las 0.2 folder in a folder or location from any project (optional)
The user can limit the data to the .las file wells only
4) Write/select a name for the database
5) Create Database
Saudi Aramco: Company General Use
11.
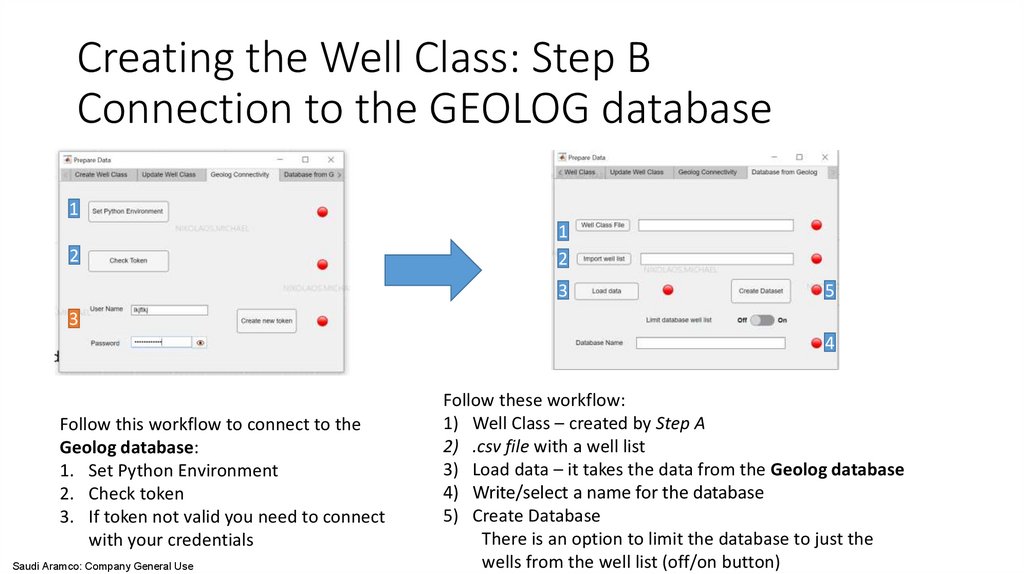
Creating the Well Class: Step BConnection to the GEOLOG database
1
2
1
2
3
5
3
4
Follow this workflow to connect to the
Geolog database:
1. Set Python Environment
2. Check token
3. If token not valid you need to connect
with your credentials
Saudi Aramco: Company General Use
Follow these workflow:
1) Well Class – created by Step A
2) .csv file with a well list
3) Load data – it takes the data from the Geolog database
4) Write/select a name for the database
5) Create Database
There is an option to limit the database to just the
wells from the well list (off/on button)
12.
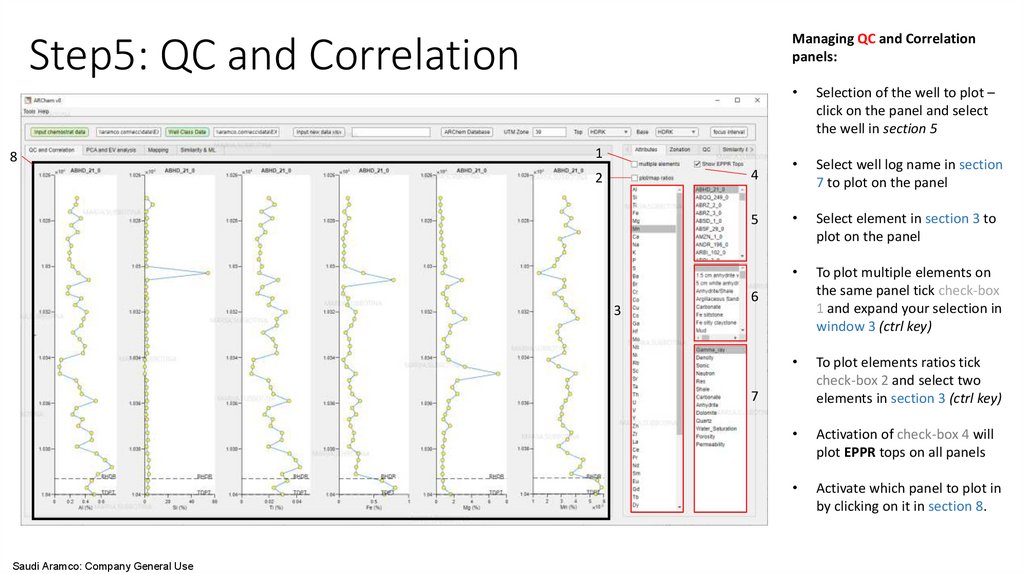
Managing QC and Correlationpanels:
Step5: QC and Correlation
8
1
4
2
5
3
Selection of the well to plot –
click on the panel and select
the well in section 5
Select well log name in section
7 to plot on the panel
Select element in section 3 to
plot on the panel
To plot multiple elements on
the same panel tick check-box
1 and expand your selection in
window 3 (ctrl key)
To plot elements ratios tick
check-box 2 and select two
elements in section 3 (ctrl key)
Activation of check-box 4 will
plot EPPR tops on all panels
Activate which panel to plot in
by clicking on it in section 8.
6
7
Saudi Aramco: Company General Use
13.
Step 6: Limit the Well ListThis will update well selection
section in the main interface.
To limit the list of available wells:
-use the context menu.
To call context menu:
1- Click the right key of your mouse
at the field with the well list.
2- Select the way of wells list
limitation.
Saudi Aramco: Company General Use
Selected scenario will
automatically propose selected
wells.
1- Edit the list in the right column
using “>” and “<“ buttons.
2- Press “apply” and “ok”.
14.
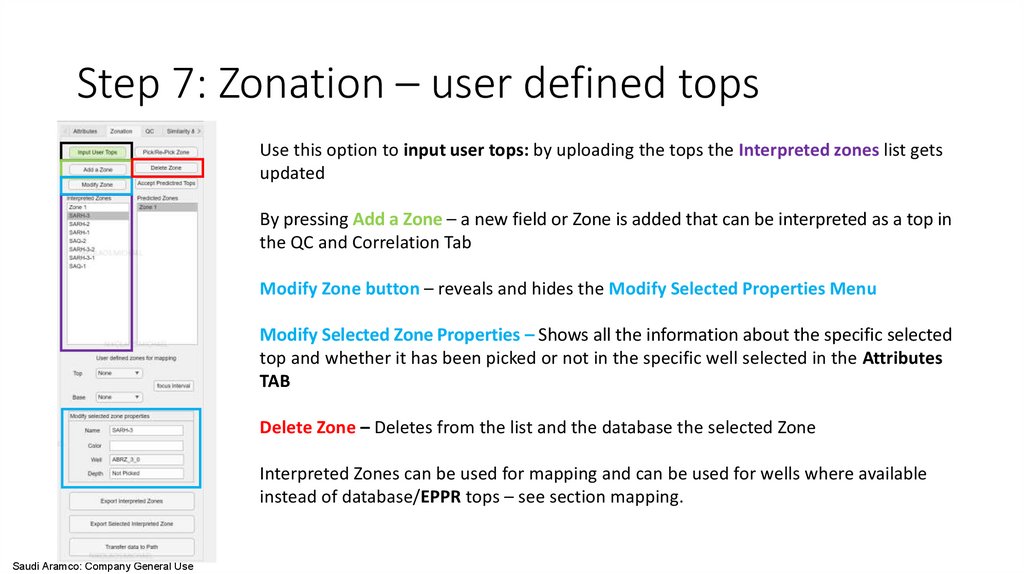
Step 7: Zonation – user defined topsUse this option to input user tops: by uploading the tops the Interpreted zones list gets
updated
By pressing Add a Zone – a new field or Zone is added that can be interpreted as a top in
the QC and Correlation Tab
Modify Zone button – reveals and hides the Modify Selected Properties Menu
Modify Selected Zone Properties – Shows all the information about the specific selected
top and whether it has been picked or not in the specific well selected in the Attributes
TAB
Delete Zone – Deletes from the list and the database the selected Zone
Interpreted Zones can be used for mapping and can be used for wells where available
instead of database/EPPR tops – see section mapping.
Saudi Aramco: Company General Use
15.
Step 7: Zonation – Picking Tops in thecorrelation panels
Pick/Re-Pick Zone – Allows the user to pick and adjust the interpreted
zones for the selected well (this updates the database and the Modify
zone Properties)
Once all the zones have been picked and interpreted – Export
Interpreted Zones exports all the interpreted Zones for all the wells
that are available.
Export Selected Interpreted Zones – Only exports the Selected Zone
from the intrepted Zones list for all the wells where available.
Transfer data to Path – where the connection with Path is available it
transfers the top and base Zones from the list of interpreted zones for
all the wells were available (the focus interval button needs to be
active)
Saudi Aramco: Company General Use
16.
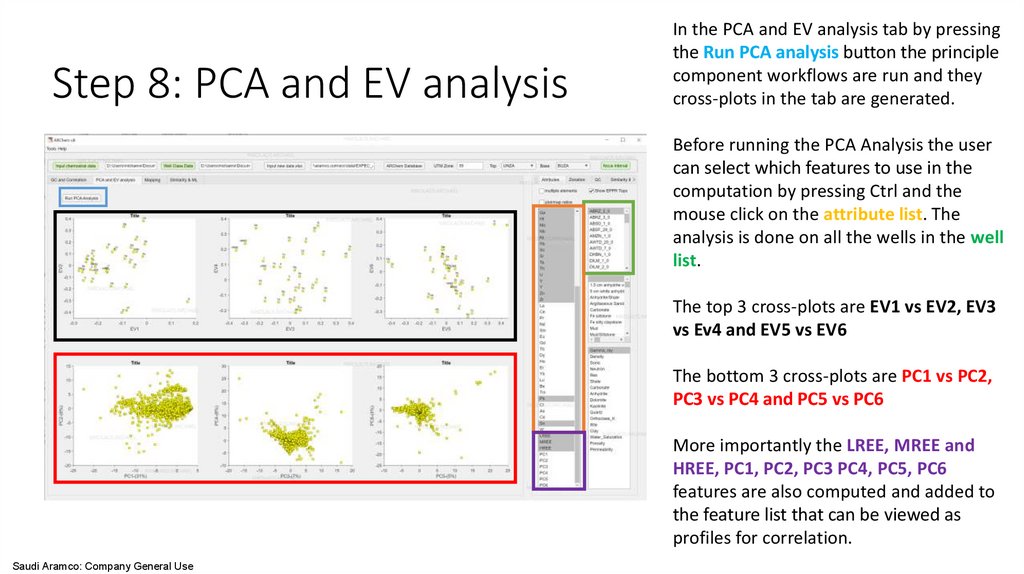
Step 8: PCA and EV analysisIn the PCA and EV analysis tab by pressing
the Run PCA analysis button the principle
component workflows are run and they
cross-plots in the tab are generated.
Before running the PCA Analysis the user
can select which features to use in the
computation by pressing Ctrl and the
mouse click on the attribute list. The
analysis is done on all the wells in the well
list.
The top 3 cross-plots are EV1 vs EV2, EV3
vs Ev4 and EV5 vs EV6
The bottom 3 cross-plots are PC1 vs PC2,
PC3 vs PC4 and PC5 vs PC6
More importantly the LREE, MREE and
HREE, PC1, PC2, PC3 PC4, PC5, PC6
features are also computed and added to
the feature list that can be viewed as
profiles for correlation.
Saudi Aramco: Company General Use
17.
Step 9: PCA and EV analysis Tab: Cross plotsIn the same tab: PCA and EV analysis the
user can create cross-plots on the panels.
Press on the panels to activate them first.
Then Select the Well you want to have a
cross plot from in the well list.
Then select the feature that you want to
cross-plot by selecting from the attribute
list. Press CTRL and mouse click to choose
between two attributes.
To plot ratios click first the plot/map ratio
button and then select up to 4 features
from the attribute list.
Saudi Aramco: Company General Use
18.
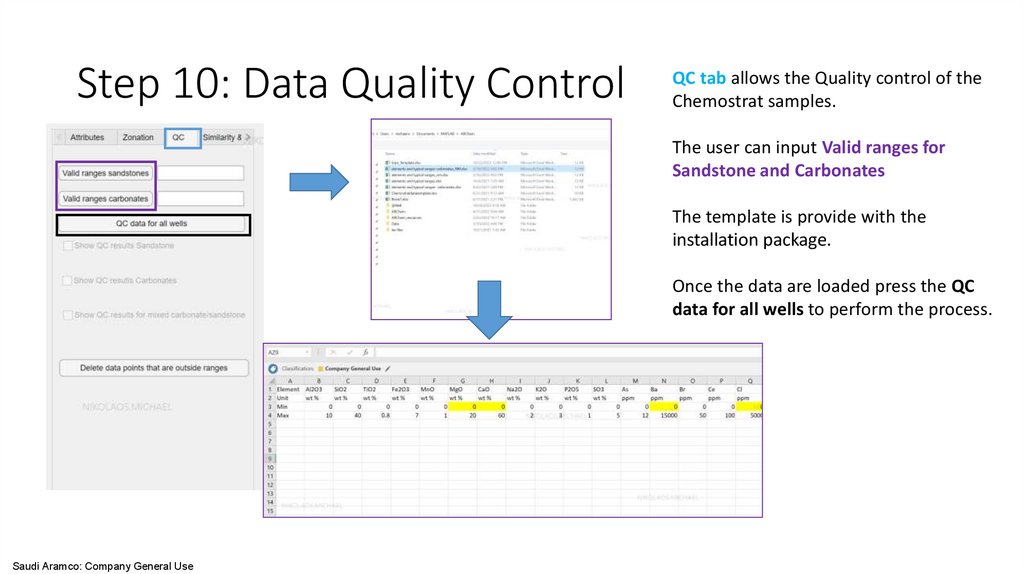
Step 10: Data Quality ControlQC tab allows the Quality control of the
Chemostrat samples.
The user can input Valid ranges for
Sandstone and Carbonates
The template is provide with the
installation package.
Once the data are loaded press the QC
data for all wells to perform the process.
Saudi Aramco: Company General Use
19.
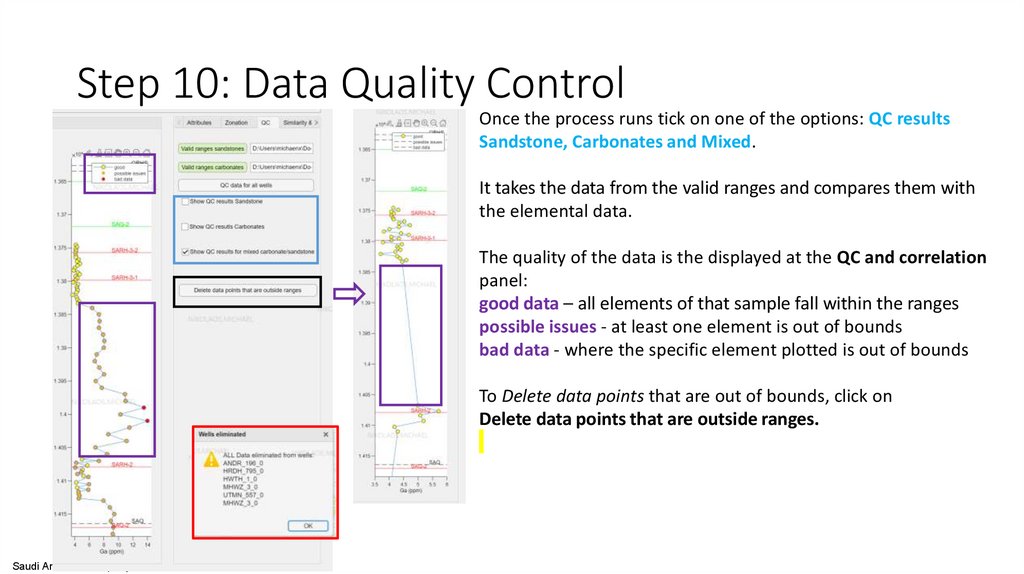
Step 10: Data Quality ControlOnce the process runs tick on one of the options: QC results
Sandstone, Carbonates and Mixed.
It takes the data from the valid ranges and compares them with
the elemental data.
The quality of the data is the displayed at the QC and correlation
panel:
good data – all elements of that sample fall within the ranges
possible issues - at least one element is out of bounds
bad data - where the specific element plotted is out of bounds
To Delete data points that are out of bounds, click on
Delete data points that are outside ranges.
Saudi Aramco: Company General Use
20.
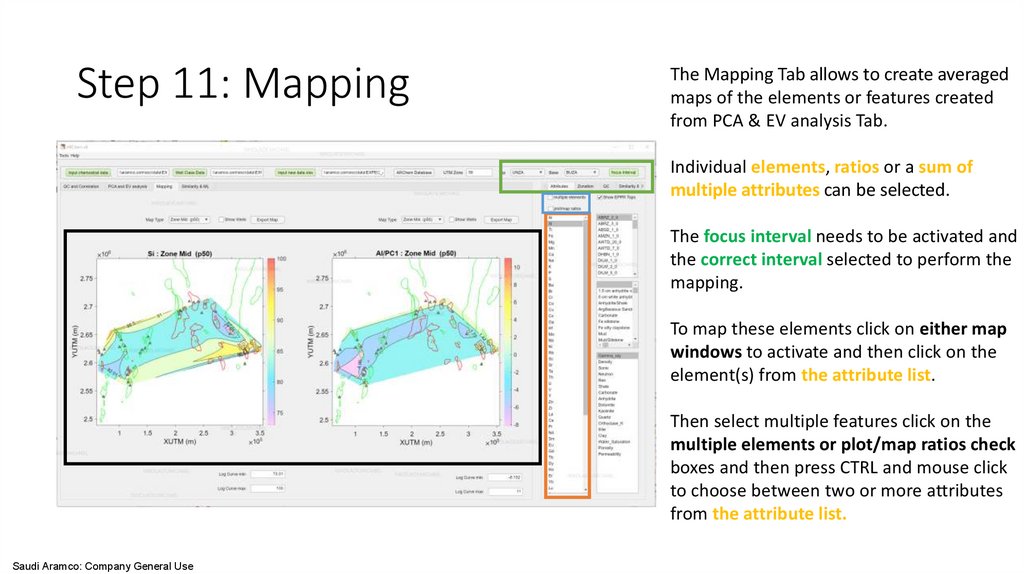
Step 11: MappingThe Mapping Tab allows to create averaged
maps of the elements or features created
from PCA & EV analysis Tab.
Individual elements, ratios or a sum of
multiple attributes can be selected.
The focus interval needs to be activated and
the correct interval selected to perform the
mapping.
To map these elements click on either map
windows to activate and then click on the
element(s) from the attribute list.
Then select multiple features click on the
multiple elements or plot/map ratios check
boxes and then press CTRL and mouse click
to choose between two or more attributes
from the attribute list.
Saudi Aramco: Company General Use
21.
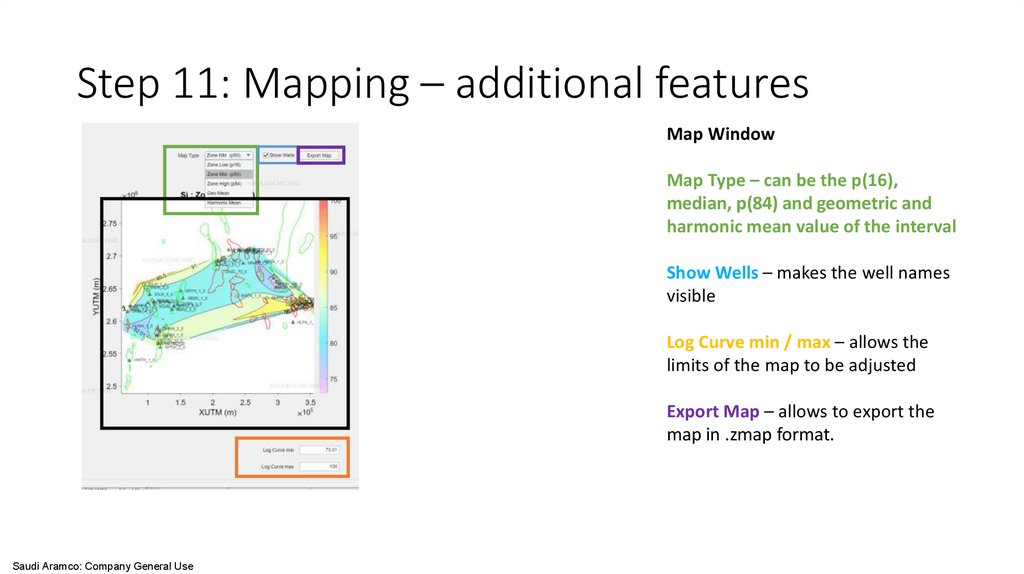
Step 11: Mapping – additional featuresMap Window
Map Type – can be the p(16),
median, p(84) and geometric and
harmonic mean value of the interval
Show Wells – makes the well names
visible
Log Curve min / max – allows the
limits of the map to be adjusted
Export Map – allows to export the
map in .zmap format.
Saudi Aramco: Company General Use
22.
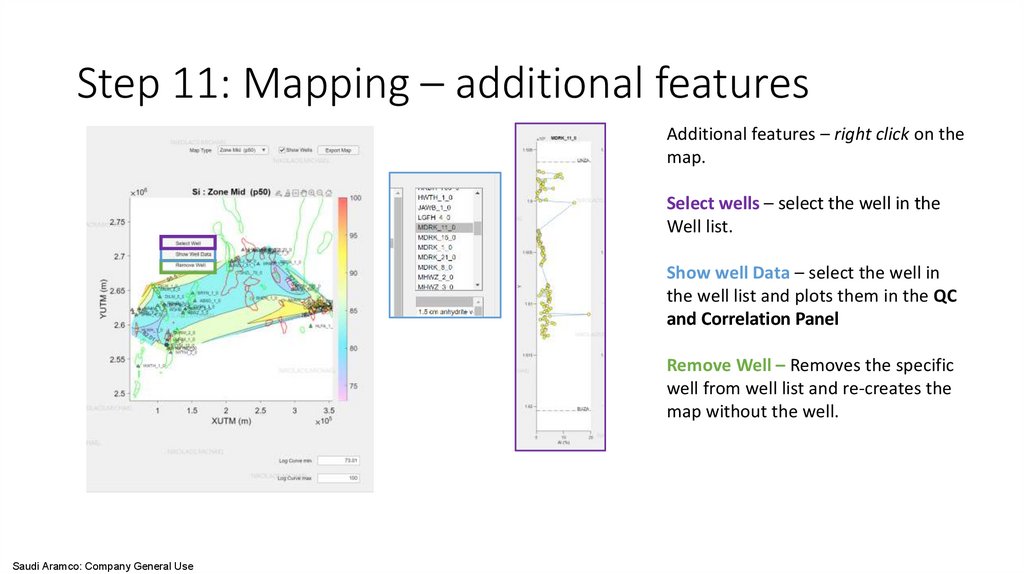
Step 11: Mapping – additional featuresAdditional features – right click on the
map.
Select wells – select the well in the
Well list.
Show well Data – select the well in
the well list and plots them in the QC
and Correlation Panel
Remove Well – Removes the specific
well from well list and re-creates the
map without the well.
Saudi Aramco: Company General Use
23.
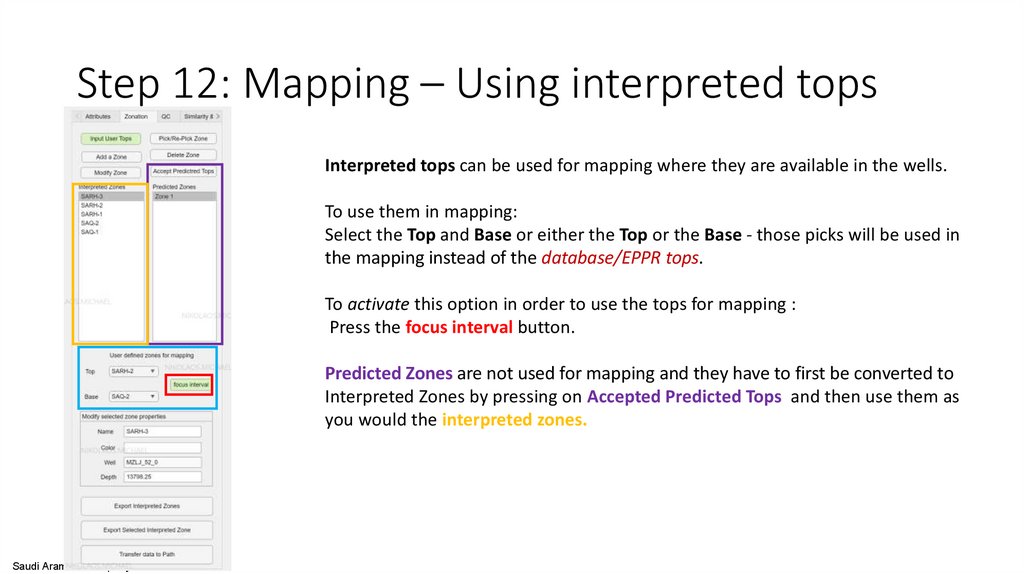
Step 12: Mapping – Using interpreted topsInterpreted tops can be used for mapping where they are available in the wells.
To use them in mapping:
Select the Top and Base or either the Top or the Base - those picks will be used in
the mapping instead of the database/EPPR tops.
To activate this option in order to use the tops for mapping :
Press the focus interval button.
Predicted Zones are not used for mapping and they have to first be converted to
Interpreted Zones by pressing on Accepted Predicted Tops and then use them as
you would the interpreted zones.
Saudi Aramco: Company General Use
24.
Step 13: Similarity & ML4
5
6
7
8
1
9
10
11
2
12
3
13
Saudi Aramco: Company General Use
Key:
1 – Map plot
2 – Target well selection window
3 – Panel for the element/well logs
plotting
4 – Dropdown window for the well
name selection
5 – Settings for the data loading
6 – Button to convert data in python
format
7 – Button that is calling dialog window
with similarity analysis
8 – Button that is calling dialog window
with ML
9 – The result of the well tops
prediction
10 – Check box for displaying predicted
tops on panels
11 – Button for updating the position of
the predicted tops after dragging on
the graphs
12 – Settings of the target
interval for a target
well, numerical and manual
selection of intervals for prediction.
13 - Selection window for selecting
the number of plots to display on
the panel.
25.
Step 13: Similarity & ML (functionality activation)Prerequisites
1. Chemostratigraphic data and well data are loaded
After the prerequisites are
completed the button “Convert data
to Python format” will be activated.
2. Target interwall is specified
Select which tops to use and press
“Convert data to Python format”
button.
3. Wells list is aligned with selected interval
Press “apply” and “ok”
Saudi Aramco: Company General Use
This will launch the data conversion
process.
Note: Do not close this window and
do not press additional buttons until
this window disappear
26.
Step 14: Similarity & ML (target well selection and visualization)2
5
3
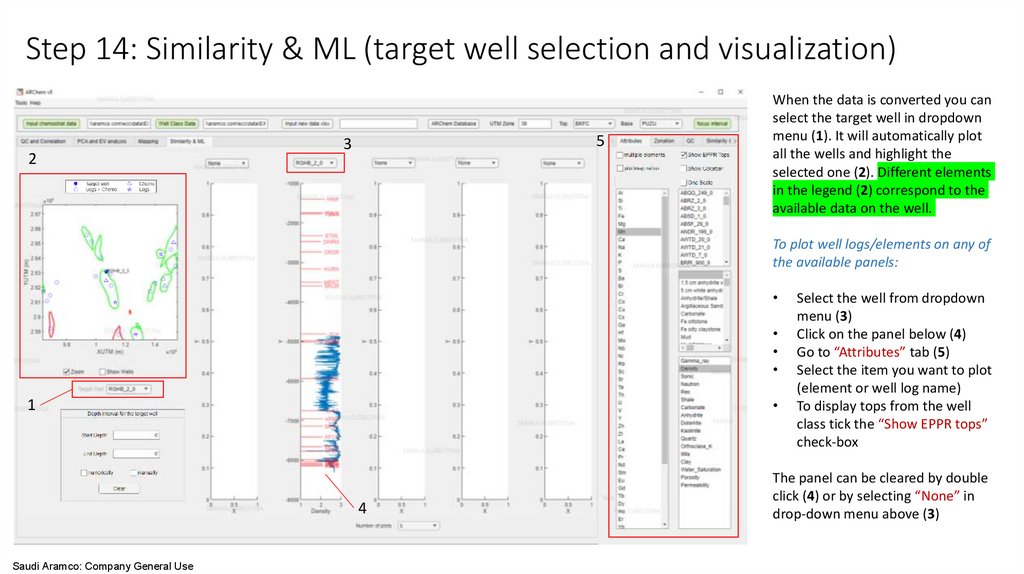
When the data is converted you can
select the target well in dropdown
menu (1). It will automatically plot
all the wells and highlight the
selected one (2). Different elements
in the legend (2) correspond to the
available data on the well.
To plot well logs/elements on any of
the available panels:
1
4
Saudi Aramco: Company General Use
Select the well from dropdown
menu (3)
Click on the panel below (4)
Go to “Attributes” tab (5)
Select the item you want to plot
(element or well log name)
To display tops from the well
class tick the “Show EPPR tops”
check-box
The panel can be cleared by double
click (4) or by selecting “None” in
drop-down menu above (3)
27.
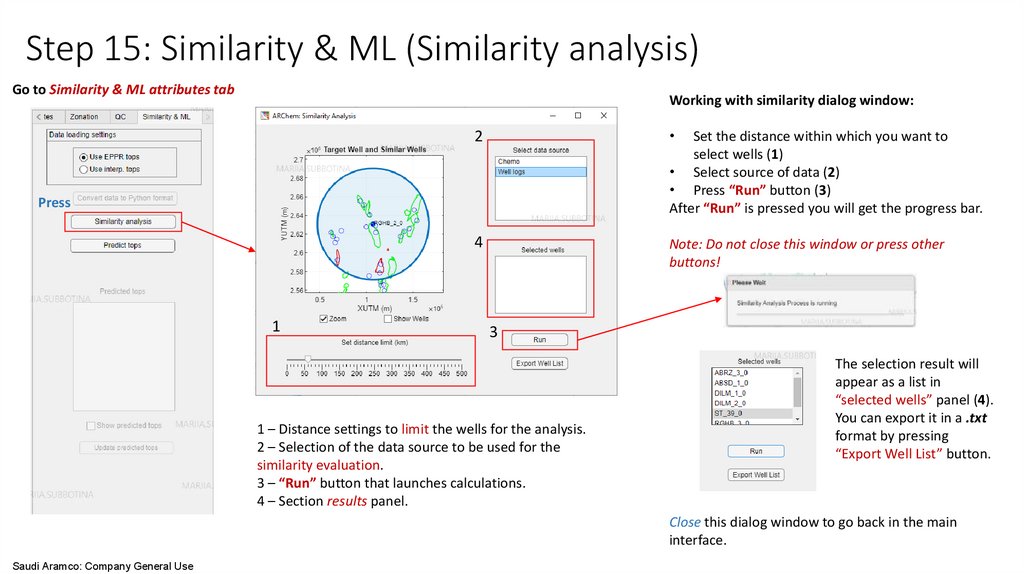
Step 15: Similarity & ML (Similarity analysis)Go to Similarity & ML attributes tab
Working with similarity dialog window:
2
4
Note: Do not close this window or press other
buttons!
Set the distance within which you want to
select wells (1)
• Select source of data (2)
• Press “Run” button (3)
After “Run” is pressed you will get the progress bar.
Press
1
3
1 – Distance settings to limit the wells for the analysis.
2 – Selection of the data source to be used for the
similarity evaluation.
3 – “Run” button that launches calculations.
4 – Section results panel.
The selection result will
appear as a list in
“selected wells” panel (4).
You can export it in a .txt
format by pressing
“Export Well List” button.
Close this dialog window to go back in the main
interface.
Saudi Aramco: Company General Use
28.
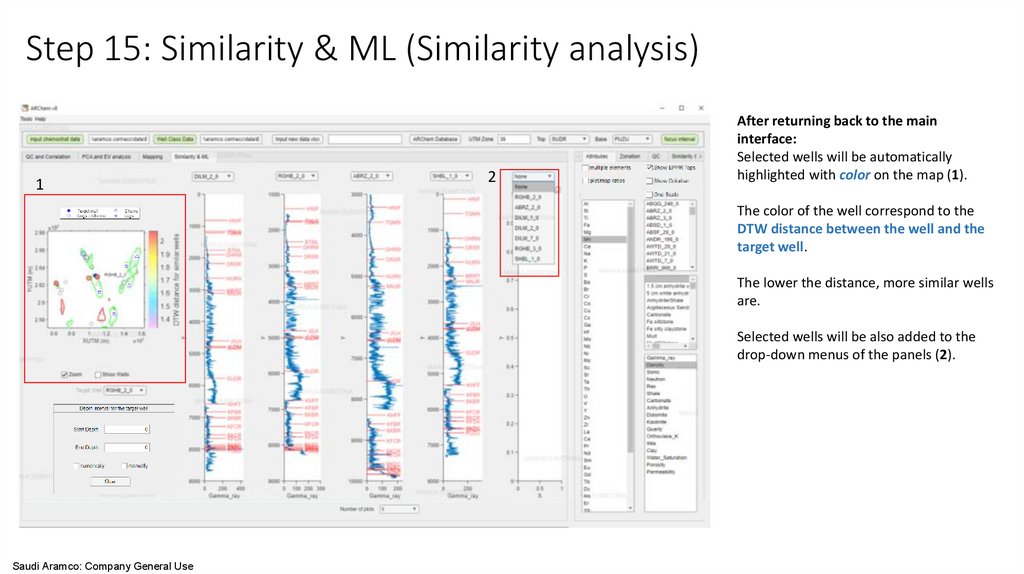
Step 15: Similarity & ML (Similarity analysis)1
2
After returning back to the main
interface:
Selected wells will be automatically
highlighted with color on the map (1).
The color of the well correspond to the
DTW distance between the well and the
target well.
The lower the distance, more similar wells
are.
Selected wells will be also added to the
drop-down menus of the panels (2).
Saudi Aramco: Company General Use
29.
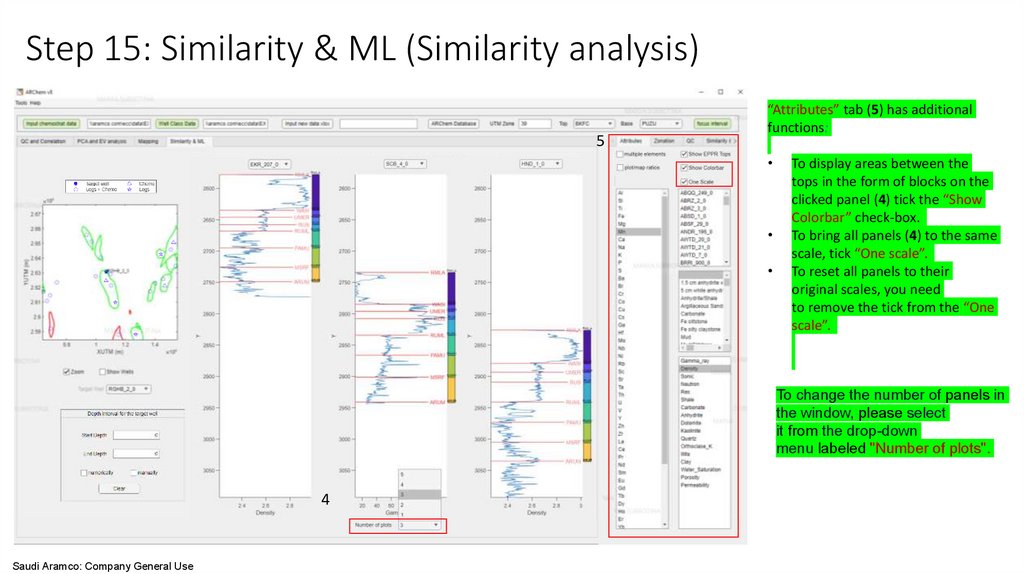
Step 15: Similarity & ML (Similarity analysis)5
“Attributes” tab (5) has additional
functions:
To display areas between the
tops in the form of blocks on the
clicked panel (4) tick the “Show
Colorbar” check-box.
To bring all panels (4) to the same
scale, tick “One scale”.
To reset all panels to their
original scales, you need
to remove the tick from the “One
scale”.
To change the number of panels in
the window, please select
it from the drop-down
menu labeled "Number of plots".
4
Saudi Aramco: Company General Use
30.
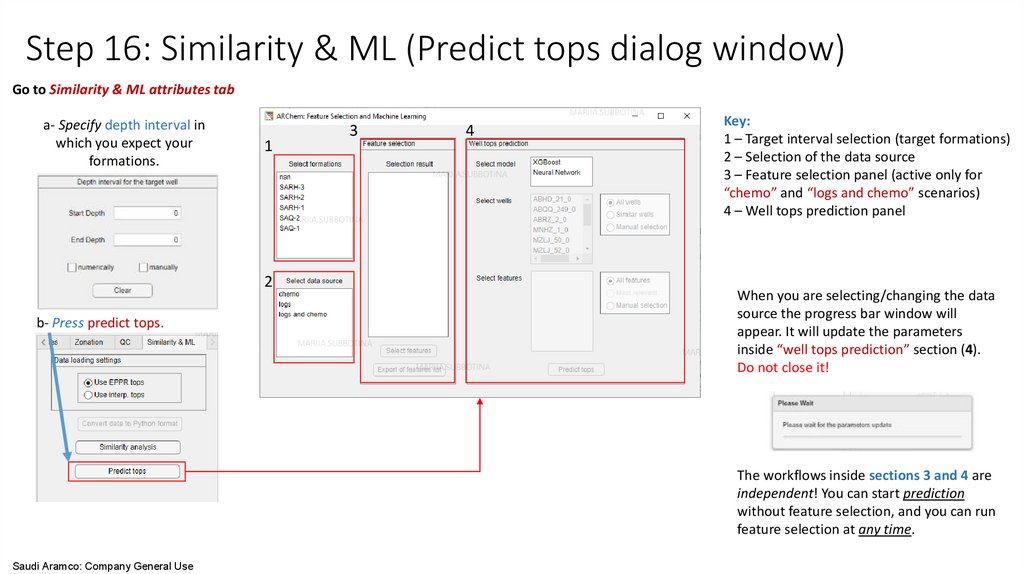
Step 16: Similarity & ML (Predict tops dialog window)Go to Similarity & ML attributes tab
a- Specify depth interval in
which you expect your
formations.
1
2
b- Press predict tops.
3
4
Key:
1 – Target interval selection (target formations)
2 – Selection of the data source
3 – Feature selection panel (active only for
“chemo” and “logs and chemo” scenarios)
4 – Well tops prediction panel
When you are selecting/changing the data
source the progress bar window will
appear. It will update the parameters
inside “well tops prediction” section (4).
Do not close it!
The workflows inside sections 3 and 4 are
independent! You can start prediction
without feature selection, and you can run
feature selection at any time.
Saudi Aramco: Company General Use
31.
Step 16: Similarity & ML (Feature selection)1
3
2
To run feature selection:
Select “chemo” or “logs and chemo” in data source selection (panel 2). This will activate
“select features” button in the panel 3.
Press “select features” button. The progress bar window will appear. Do not close it!
The selection result will be displayed in panel 3 after completion.
Saudi Aramco: Company General Use
The example of feature list export.
32.
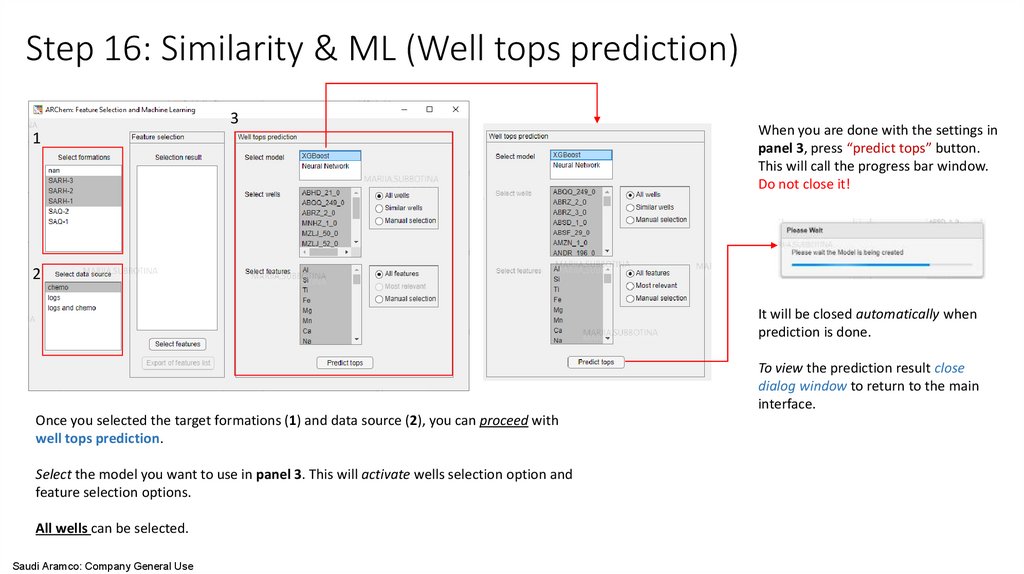
Step 16: Similarity & ML (Well tops prediction)3
1
When you are done with the settings in
panel 3, press “predict tops” button.
This will call the progress bar window.
Do not close it!
2
It will be closed automatically when
prediction is done.
To view the prediction result close
dialog window to return to the main
interface.
Once you selected the target formations (1) and data source (2), you can proceed with
well tops prediction.
Select the model you want to use in panel 3. This will activate wells selection option and
feature selection options.
All wells can be selected.
Saudi Aramco: Company General Use
33.
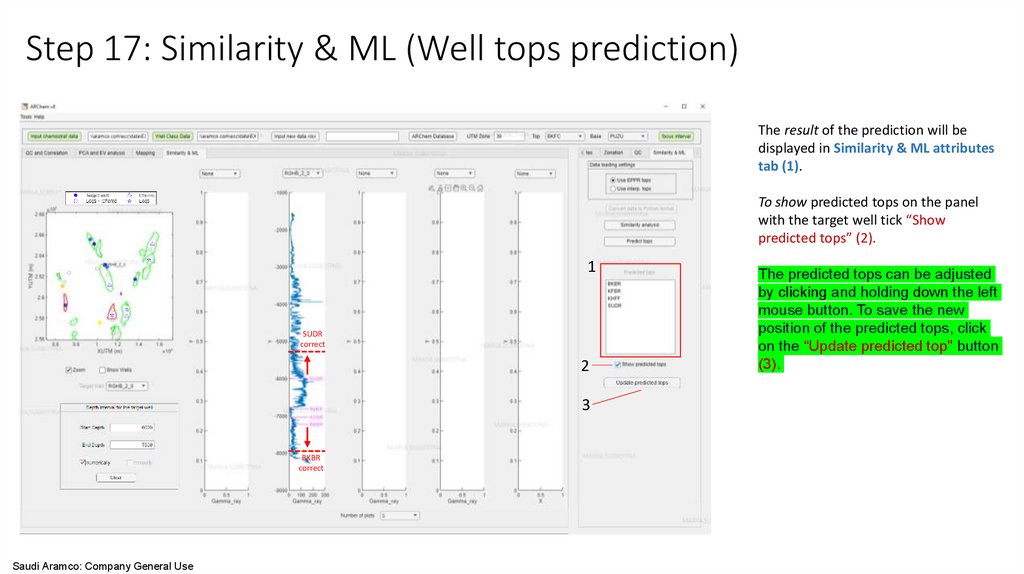
Step 17: Similarity & ML (Well tops prediction)The result of the prediction will be
displayed in Similarity & ML attributes
tab (1).
To show predicted tops on the panel
with the target well tick “Show
predicted tops” (2).
1
SUDR
correct
2
3
BKBR
correct
Saudi Aramco: Company General Use
The predicted tops can be adjusted
by clicking and holding down the left
mouse button. To save the new
position of the predicted tops, click
on the “Update predicted top" button
(3).
34.
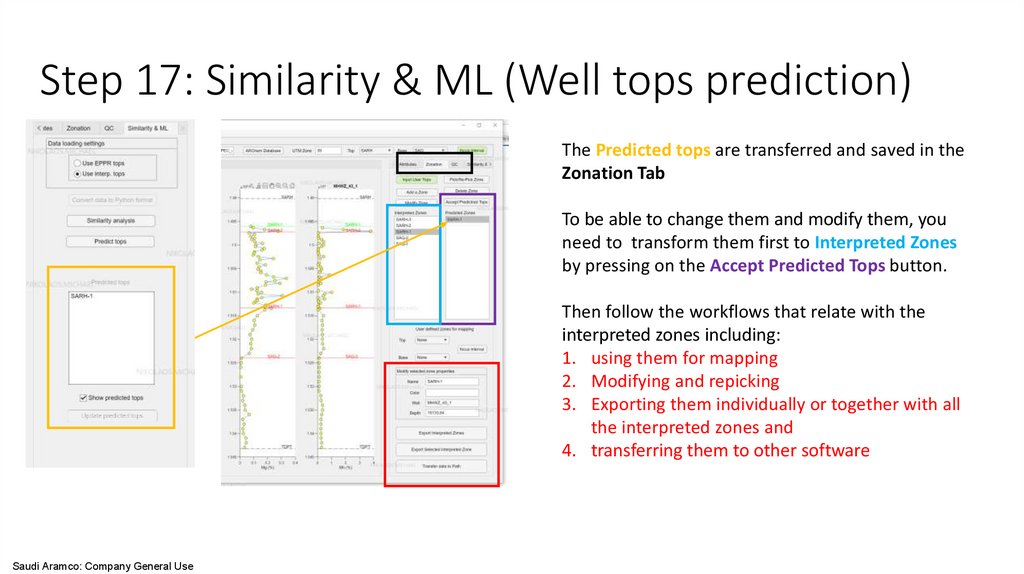
Step 17: Similarity & ML (Well tops prediction)The Predicted tops are transferred and saved in the
Zonation Tab
To be able to change them and modify them, you
need to transform them first to Interpreted Zones
by pressing on the Accept Predicted Tops button.
Then follow the workflows that relate with the
interpreted zones including:
1. using them for mapping
2. Modifying and repicking
3. Exporting them individually or together with all
the interpreted zones and
4. transferring them to other software
Saudi Aramco: Company General Use