


 geography
Similar presentations:


")


Measurement of Democracy. Lecture 7-8
1.
Lecture 7-8:Measuring democracyProf. Smorgunov L., SPbSU
2.
Topics:Empirical theory of democracy
The logic of the development of
democracy indexes
Indexes of democracy
Comparison of the indexes of
democracy
Generalized index of democracy
3.
1. Empirical theory ofdemocracy
4.
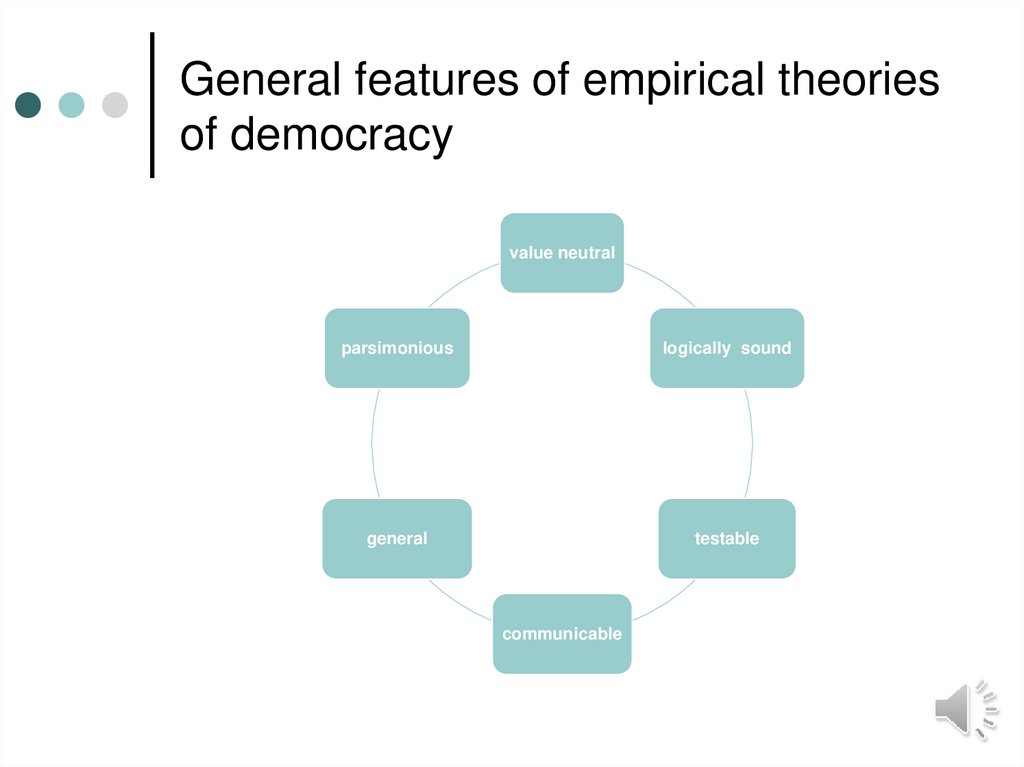
General features of empirical theoriesof democracy
value neutral
parsimonious
logically sound
general
testable
communicable
5.
Empirical theory ofdemocracy
is causal;
requires defining the boundaries of
empirical observation;
allows the measurement of qualities;
should concern not only the form, but
also the content of democracy;
be systematically verified;
combine empiricism and theory.
6.
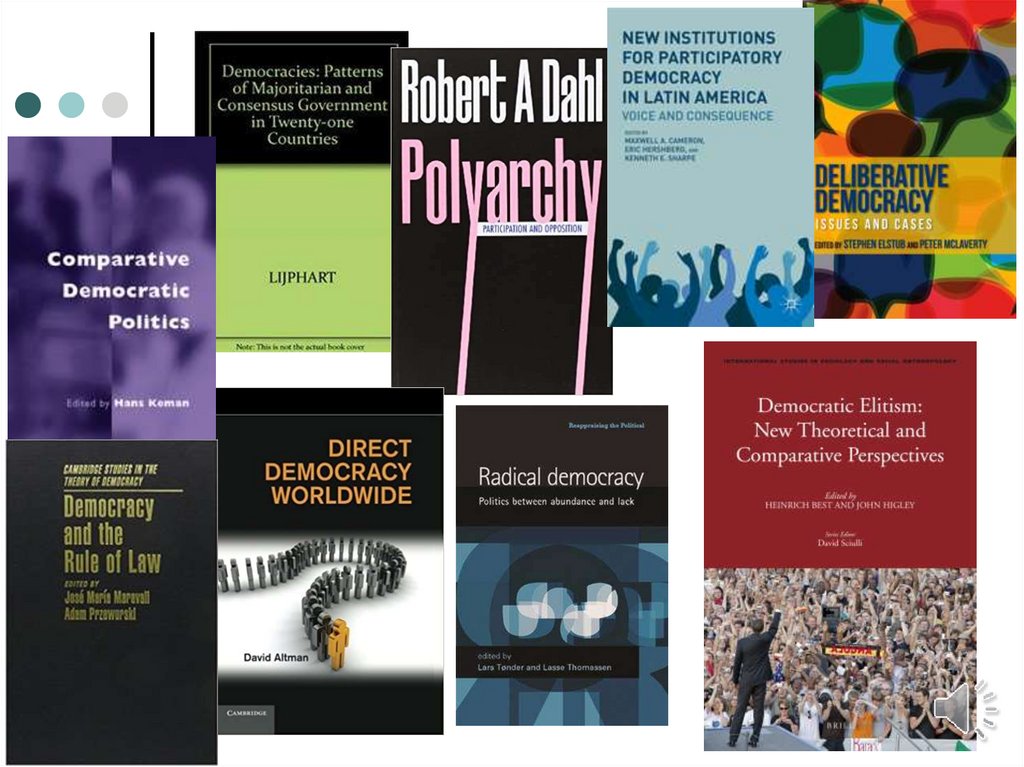
Types of democratic theoriesaccording to D. Held (D. Held. Models
of Democracy. Stanford, 1987):
Classical democracy
Security Democracy
A radical model of developing democracy
Direct democracy
Competitive Elitist Democracy
Plural democracy
Legal democracy
Democracy of participation
Democratic autonomy
7.
8.
2. The logic of thedevelopment of
democracy indexes
9.
History of measuring democracyResearcher
(year)
Index name
Period of study
N of countries
Method of
analysis
Cutright,
Philipps (1963)
Political
development
1940-1960
77
Correlation and
regression
Neubauer,
Deane (1967)
Democratic
performance
1940-1960
23
Correlation
Jackman (1973)
Democratic
development
1960
60
Multiple
regression
Bollenn (1979,
1983)
Political
democracy
1960, 1975
113
Factor analysis
«Freedom
House»
(annually)
Political
freedom
Annually,
beginning 1973
195 (2020)
Classification
Vanhanen, Tatu
(1979, 1988,
1997)
Democratization
1850-1979
1980-1988
119
147
Correlation and
regression
Gaggers-Garr
(1995)
Polity III
1946-1994
151
Correlation
Arat (1991)
Democracy
1948-1982
152
Correlation
Coppige-Reinike
(1990)
Poliarchy
1985
170
Correlation and
regression
10.
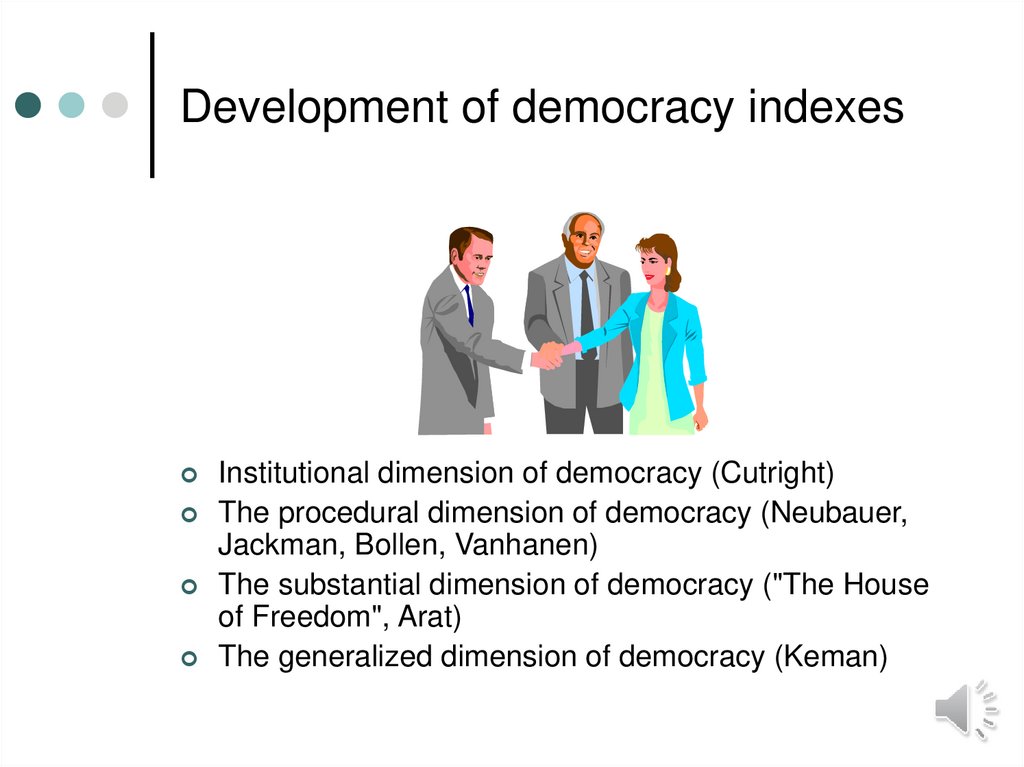
Development of democracy indexesInstitutional dimension of democracy (Cutright)
The procedural dimension of democracy (Neubauer,
Jackman, Bollen, Vanhanen)
The substantial dimension of democracy ("The House
of Freedom", Arat)
The generalized dimension of democracy (Keman)
11.
3. Indexes of democracy12.
Institutional indexes ofdemocracy
13.
Cutright’s political development indexCutright Ph. National Political
Development: Measurement and
Analysis. In: American Sociological
Review. Vol. 28. № 1. Pp. 253-264.
N=77; 1940-1960; scale: 0-3.
Method of analysis of empirical material:
correlation and regression analysis.
14.
The concept that guidedconstruction of the index:
A politically developed nation has more complex
and specialized national political institutions than a
less politically developed nation.
Degree of political development can be measured
and each nation can be placed on a continuum of
development, which will allow it to be compared
with any other nation in the world.
Operationally we bank heavily on the role played
by political parties in national political life in
measuring political development.
15.
Index of political developmentLegislative Branch of
Government:
Executive Branch of
Government:
2 points for each year – A
parliament existed in which the
lower or the only chamber
contained representative of two or
more political parties and the
minority party or parties had at
least 30 % of all seats;
1 point for each year – A
parliament existed whose
members were the
representatives of one or more
political parties, but where the “30
% rule” was violated;
0 point – No parliament existed or
for years when either of the above
types of parliaments was
abolished or discarded by
executive power. Parliaments
whose members are not members
of political parties. Parliaments
that are not self-governing bodies.
1 point for each year – The nation
was ruled by a chief executive
who was in office by virtue of
direct vote in an open election
where he faced competition or
was selected by a political party in
multi-party system, as defined by
the conditions necessary to get 2
points on the legislative branch
indicator above.
0,5 points for each year – The
chief executive was not selected
by virtue of his hereditary status
but was selected by criteria other
than those necessary to attain 1
point as given above; colonial
governments also receive this
point.
0 points – If the parliament ceased
being a multi-party parliament
because of executive action; the
nation was governed by a
hereditary ruler.
16.
Matrix of correlations between political development andlevels of communication, urbanization, education and
employment in agriculture
Y = 3.7 + 0.172X1 + 0.232X2 + 0.003X3 + - 0.014X4
Ry1,2,3,4 = 0.82
1. Communication
2. Urbanization
3. Education
4. Employment in
agriculture
5. Political
development
4
5
Means
Standard
deviation
2
3
.74
.88
-.86
.81
.77
-.75
.69
-.78
.74
105.8 16.7
-.72
53.1 10.5
204.5 36.4
49.9
49.9
8.2
9.7
17.
Processual indexes ofdemocracy
18.
Index of democratic performance ( D.Neubauer)
Neubauer D. Some Conditions of
Democracy. In: American Political
Science Review. 1967. Vol. 61. № 4.
Pp. 1002-1009.
N = 23; 1940-1960.
Correlational analysis
19.
Dependent variables of democracyThe most characteristic feature of democratic regime is
the election of key governmental personnel.
The form of elections alone does not guarantee their
democratic substance.
Two key indicators of a country’s tolerance of electoral
opposition groups are the existence of actual electoral
competition and the existence of multiple sources of
public information.
Democracy = Electoral Equality + Competition
How can we measure these two variables?
20.
The indicators of electoral equalityElectoral equality:
(1) Per cent of the adult population eligible to vote;
(2) Equality of representation: “mean range of
distortion”: most over-represented party seats +
most under-represented party seats and mean for all
elections;
(3) Information equality: the number of newspapers
with different owners multiplied by the average
circulation and divided by the population of the
capital.
21.
Indicators of electoral competitionElectoral competitions:
(1) Per cent of the time period in which
the dominant party held office;
(2) Mean percentage of the vote
received by the winning party (parties).
22.
Matrix of correlations of the index of democratic actionwith levels of education, communication, urbanization
and employment in agriculture (D. Neubauer)
1
1. Communication
2. Urbanization
3. Education
4. Employment in
agriculture
5. Democratic
performance
2
3
4
5
.314
.732
-.698
.424
.578
-.612
-.008
-.712
.055
.016
23.
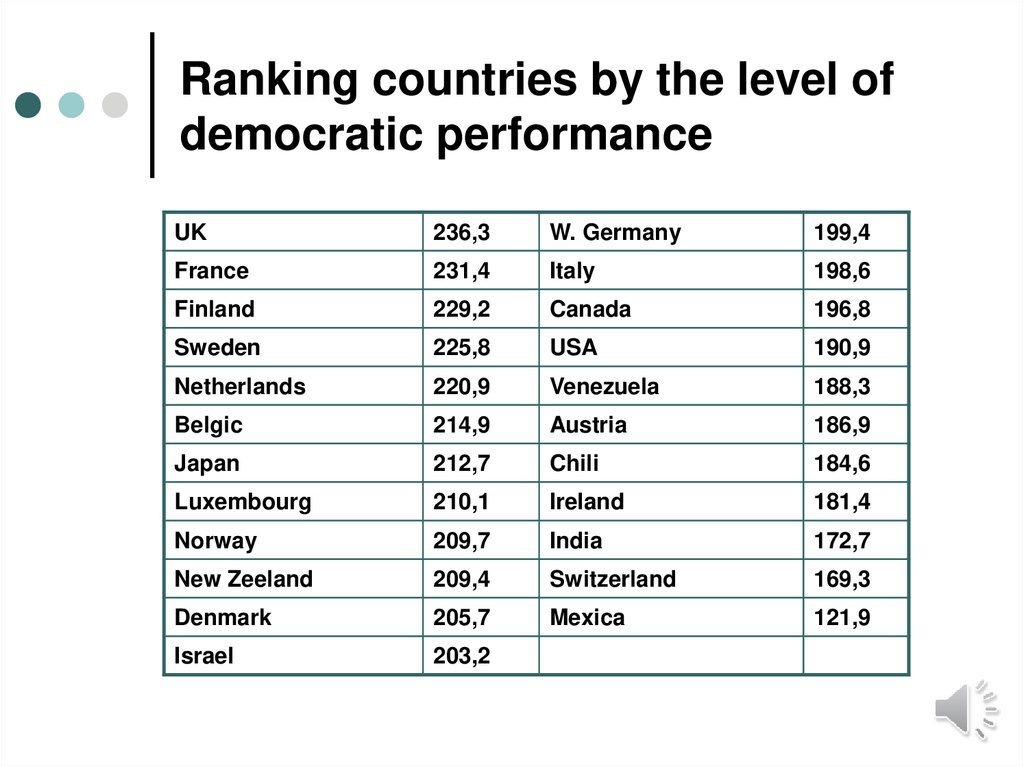
Ranking countries by the level ofdemocratic performance
UK
236,3
W. Germany
199,4
France
231,4
Italy
198,6
Finland
229,2
Canada
196,8
Sweden
225,8
USA
190,9
Netherlands
220,9
Venezuela
188,3
Belgic
214,9
Austria
186,9
Japan
212,7
Chili
184,6
Luxembourg
210,1
Ireland
181,4
Norway
209,7
India
172,7
New Zeeland
209,4
Switzerland
169,3
Denmark
205,7
Mexica
121,9
Israel
203,2
24.
Conclusions from the study of D.Neubauer:
Using the new index allows you to rank democratic
countries in terms of the level of democracy.
For countries with a high level of development, a high
correlation between socio-economic indicators and
indicators of democracy is not confirmed.
Apparently, there is a threshold in the level of socioeconomic development, beyond which there is not a high
correlation between political and socio-economic
variables.
25.
Vanhanen’s index of democratizationVanhanen T. The Emergence of
Democracy. A Comparative Study of 147
States, 1850-1979. Helsinki, 1984.
N=147; 1850-1979.
Correlation and regression.
Classification.
26.
Vanhanen’ hypothesis“The relative distribution of economic, intellectual, and other
power resources between various sections of the population
is the fundamental factor which is assumed to account for
the variation of political systems from the aspect of
democratization.
The adaptation of political systems to environmental
conditions means that power structures become adapted to
resource structures.
It can be hypothesized that democratization takes place
under conditions in which power resources have
become so widely distributed that no group is any
longer able to suppress its competitors or to maintain
its hegemony”.
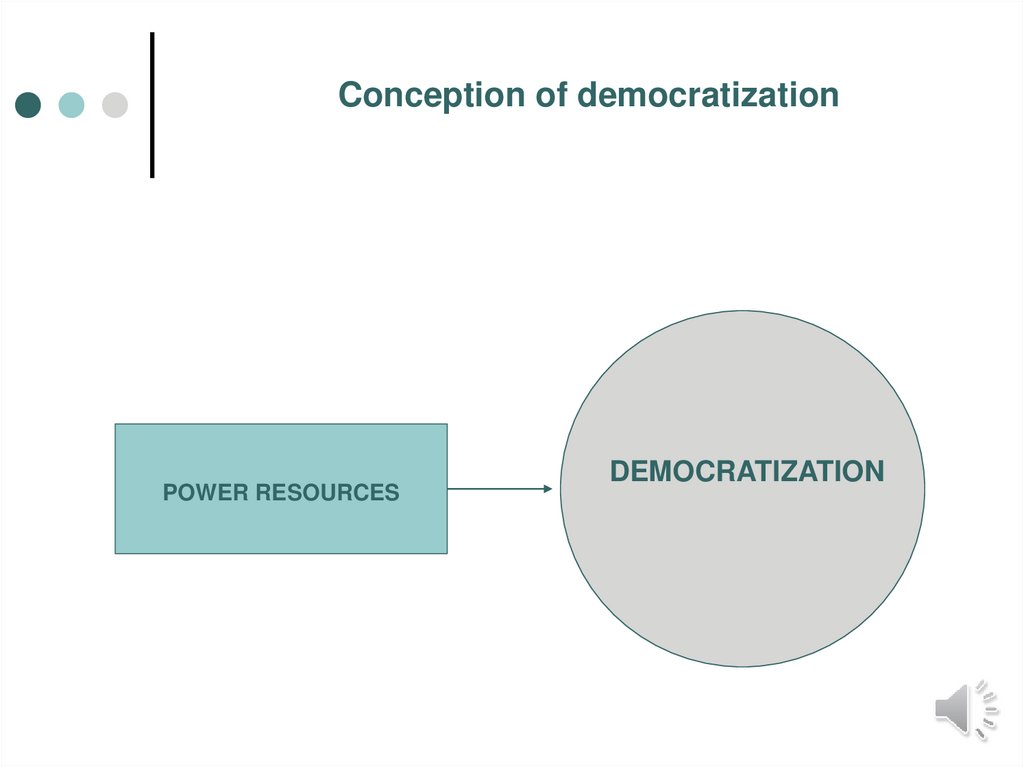
27.
Conception of democratizationPOWER RESOURCES
DEMOCRATIZATION
28.
Core variables of power resources anddemocratization
Social-professional
status
competition
Education
participation
Family farms
29.
Operationalization of democraticvaraibles
Competition (C):the percentage of votes
received by opposition (small) parties in
elections (by subtracting the votes received by
the government party (s) from 100%).
Participation (P):percentage of the population
who participated in the voting.
Index of democratization: ID = C х P/ 100.
30.
Classification of political systemsDemocratic
systems
Semi-democratic
systems
Nondemocratic
systems
Competition
30 % and
more
20-30 %
less 20 %
Participation
15 % and
more
10-15 %
less 10%
ID
5 and more
2-5
less 2
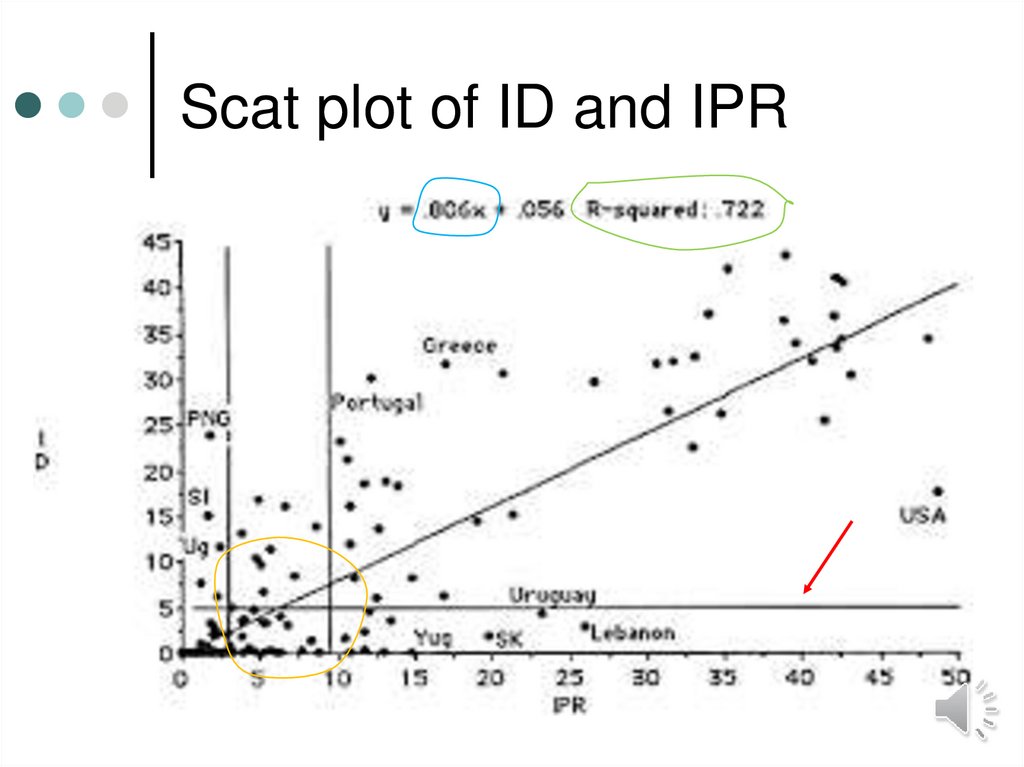
31.
Empirical hyposesis1. Average values of the index of power
resources for decades are greater for
democracies than for non-democracies.
2. The index of power resources has a positive
correlation with the democratization index for
decades.
3. The country will cross the threshold of
democratization if the index of power resources
is within 3-10 points.
32.
Scat plot of ID and IPR33.
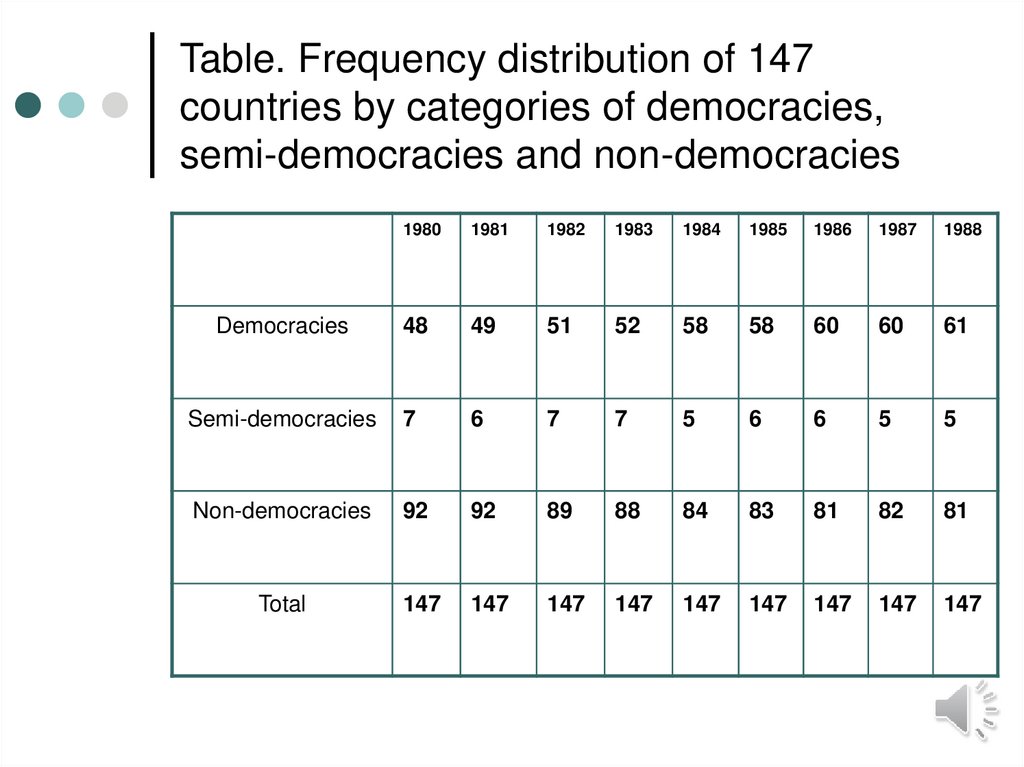
Table. Frequency distribution of 147countries by categories of democracies,
semi-democracies and non-democracies
1980
1981
1982
1983
1984
1985
1986
1987
1988
Democracies
48
49
51
52
58
58
60
60
61
Semi-democracies
7
6
7
7
5
6
6
5
5
Non-democracies
92
92
89
88
84
83
81
82
81
Total
147
147
147
147
147
147
147
147
147
34.
Substantial indexes ofdemocracy
35.
Freedom House indexGastil, Raymond. The
new criteria of freedom.
In: Freedom at Issue.
Vol. 17. 1973.
Freedom in the World.
Ed. by R. Gastil.
Boston: G.K.Hall, 1978.
Freedom in the World //
Сервер “Freedom
House”
(www.freedomhouse.or
g/research/freeworld/20
03)
36.
Measurement of freedomСВОБОДА
Перечень
политических прав
Перечень
гражданских свобод
А. Электоральный
процесс
А. Свобода выражения
мнений
В. Плюрализм и
участие
В. Права на формирование
организаций и ассоциаций
С. Функционирование
правительства
С. Господство права
D. Личная автономия
и индивидуальные права
37.
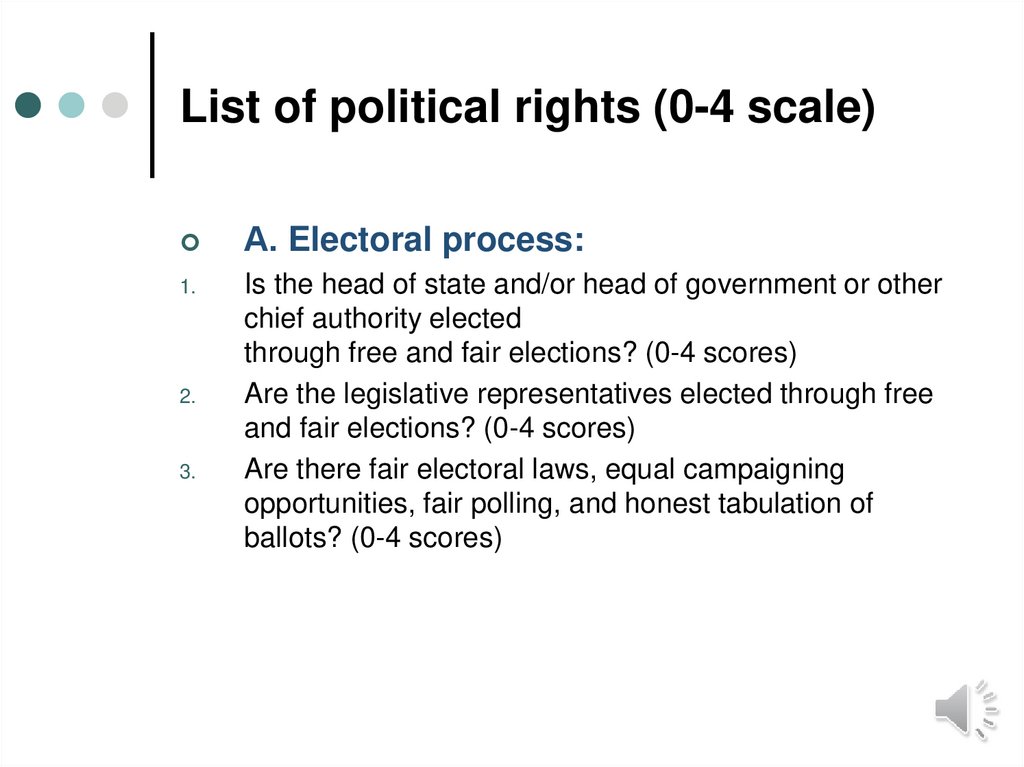
List of political rights (0-4 scale)А. Electoral process:
1.
Is the head of state and/or head of government or other
chief authority elected
through free and fair elections? (0-4 scores)
Are the legislative representatives elected through free
and fair elections? (0-4 scores)
Are there fair electoral laws, equal campaigning
opportunities, fair polling, and honest tabulation of
ballots? (0-4 scores)
2.
3.
38.
List of political rights1.
2.
3.
4.
В. Political pluralism and participation:
Do the people have the right to organize in different political
parties or other competitive political groupings of their choice,
and is the system open to the rise and fall of these competing
parties or groupings?
Is there a significant opposition vote, de facto opposition power,
and a realistic possibility for the opposition to increase its
support or gain power through elections?
Are the people’s political choices free from domination by the
military, foreign powers, totalitarian parties, religious
hierarchies, economic oligarchies, or any other powerful group?
Do cultural, ethnic, religious, and other minority groups have
reasonable self-determination, self-government, autonomy, or
participation through informal consensus in the decisionmaking process?
39.
List of political rights1.
2.
3.
С. Governmental functioning:
Do freely elected representatives determine
the policies of the government?
Is the government free from pervasive
corruption?
Is the government accountable to the
electorate between elections, and does it
operate with openness and transparency?
40.
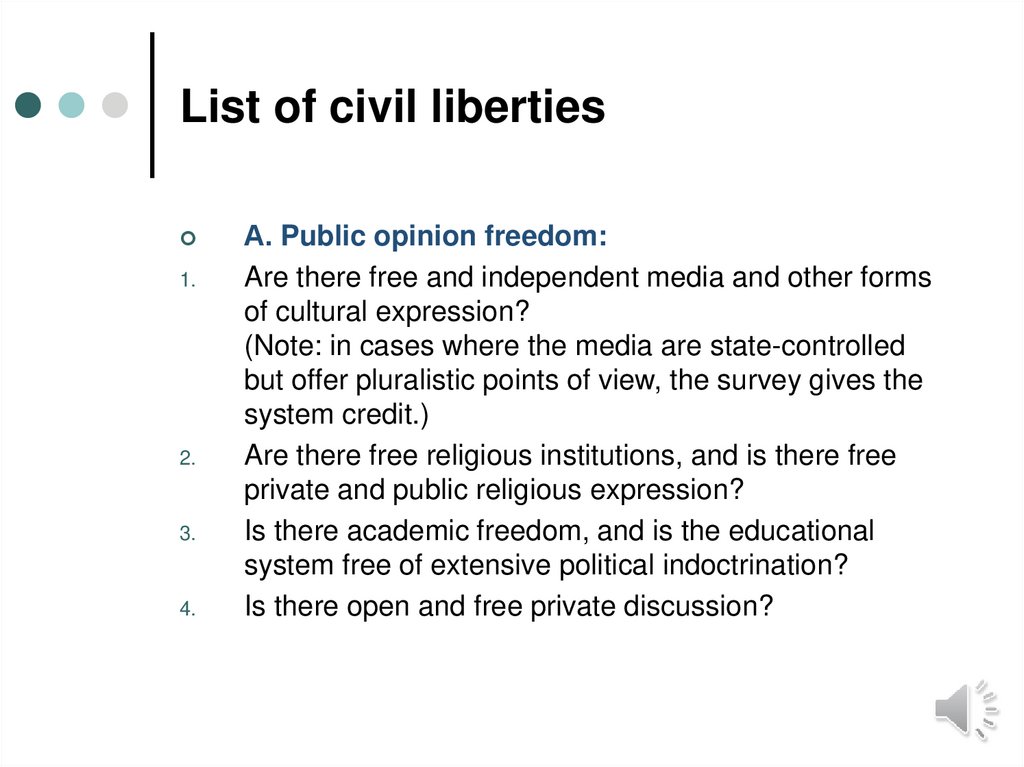
List of civil liberties1.
2.
3.
4.
А. Public opinion freedom:
Are there free and independent media and other forms
of cultural expression?
(Note: in cases where the media are state-controlled
but offer pluralistic points of view, the survey gives the
system credit.)
Are there free religious institutions, and is there free
private and public religious expression?
Is there academic freedom, and is the educational
system free of extensive political indoctrination?
Is there open and free private discussion?
41.
List of civil libertiesВ. Right to form organizations:
1.
Is there freedom of assembly, demonstration, and
open public discussion?
Is there freedom of political or quasi-political
organization? (Note: this includes political parties,
civic organizations, ad hoc issue groups, etc.)
Are there free trade unions and peasant
organizations or equivalents, and is there effective
collective bargaining? Are there free professional
and other private organizations?
2.
3.
42.
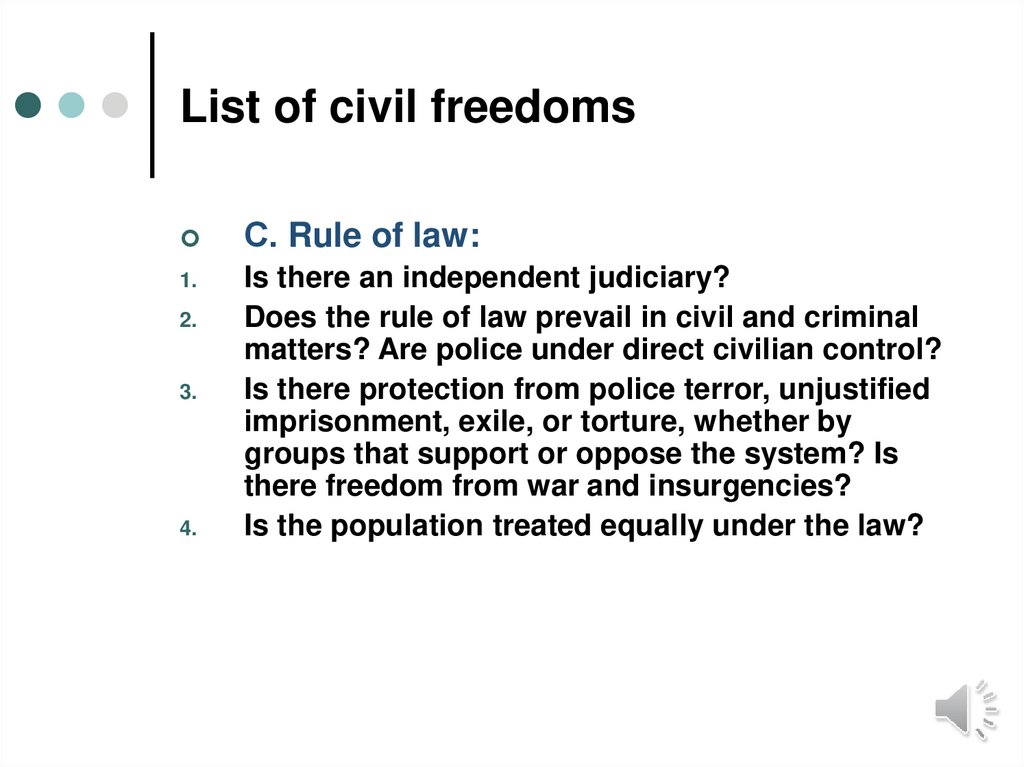
List of civil freedomsС. Rule of law:
1.
Is there an independent judiciary?
Does the rule of law prevail in civil and criminal
matters? Are police under direct civilian control?
Is there protection from police terror, unjustified
imprisonment, exile, or torture, whether by
groups that support or oppose the system? Is
there freedom from war and insurgencies?
Is the population treated equally under the law?
2.
3.
4.
43.
List of civil libertiesD. Personal autonomy and individual
rights:
1.
Is there personal autonomy? Does the state control
travel, choice of residence, or choice of employment?
Is there freedom from indoctrination and excessive
dependency on the state?
Do citizens have the right to own property and
establish private businesses? Is private business
activity unduly influenced by government officials, the
security forces, or organized crime?
Are there personal social freedoms, including gender
equality, choice of marriage partners, and size of
family?
Is there equality of opportunity and the absence of
economic exploitation
2.
3.
4.
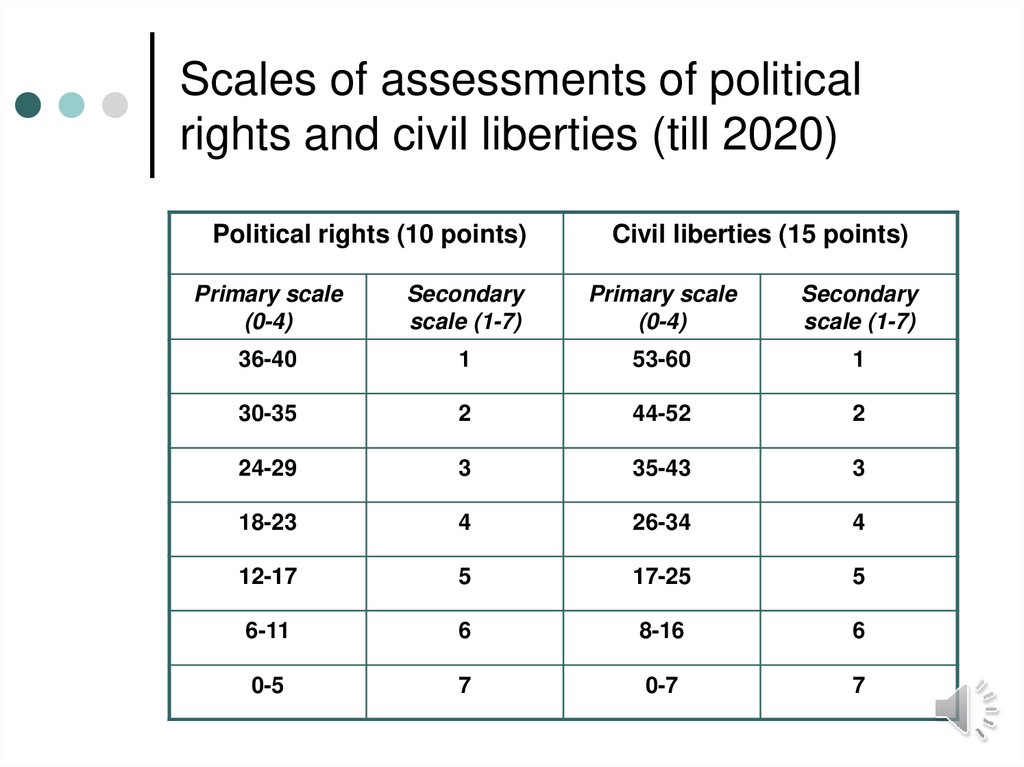
44.
Scales of assessments of politicalrights and civil liberties (till 2020)
Political rights (10 points)
Civil liberties (15 points)
Primary scale
(0-4)
Secondary
scale (1-7)
Primary scale
(0-4)
Secondary
scale (1-7)
36-40
1
53-60
1
30-35
2
44-52
2
24-29
3
35-43
3
18-23
4
26-34
4
12-17
5
17-25
5
6-11
6
8-16
6
0-5
7
0-7
7
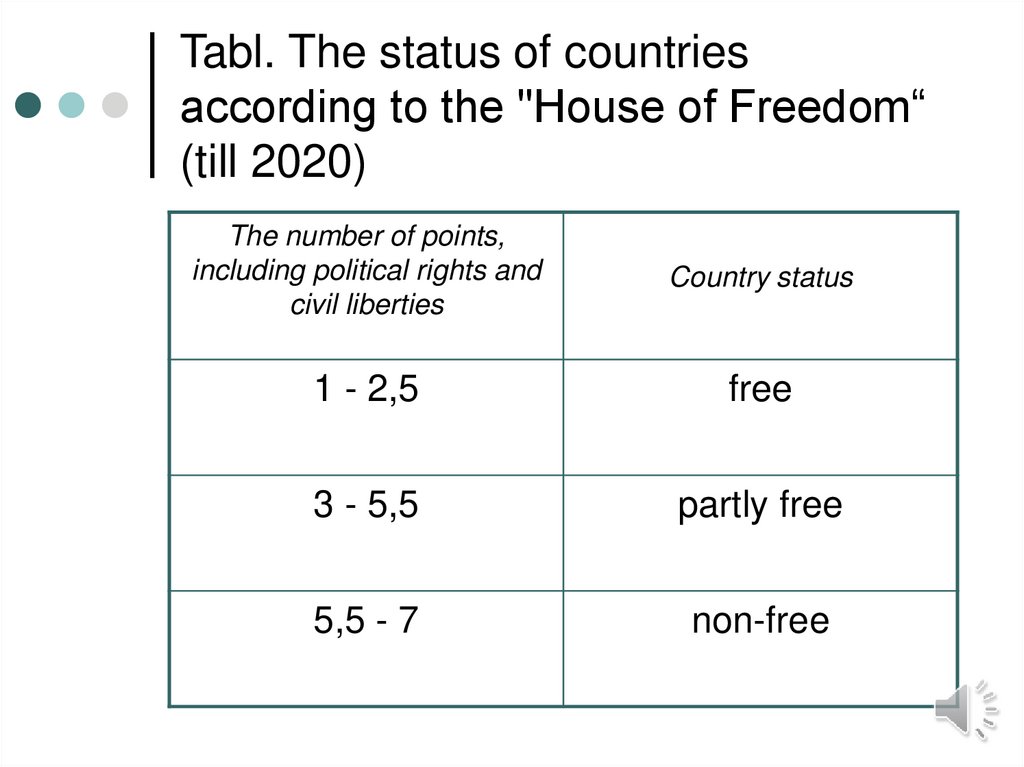
45.
Tabl. The status of countriesaccording to the "House of Freedom“
(till 2020)
The number of points,
including political rights and
civil liberties
Country status
1 - 2,5
free
3 - 5,5
partly free
5,5 - 7
non-free
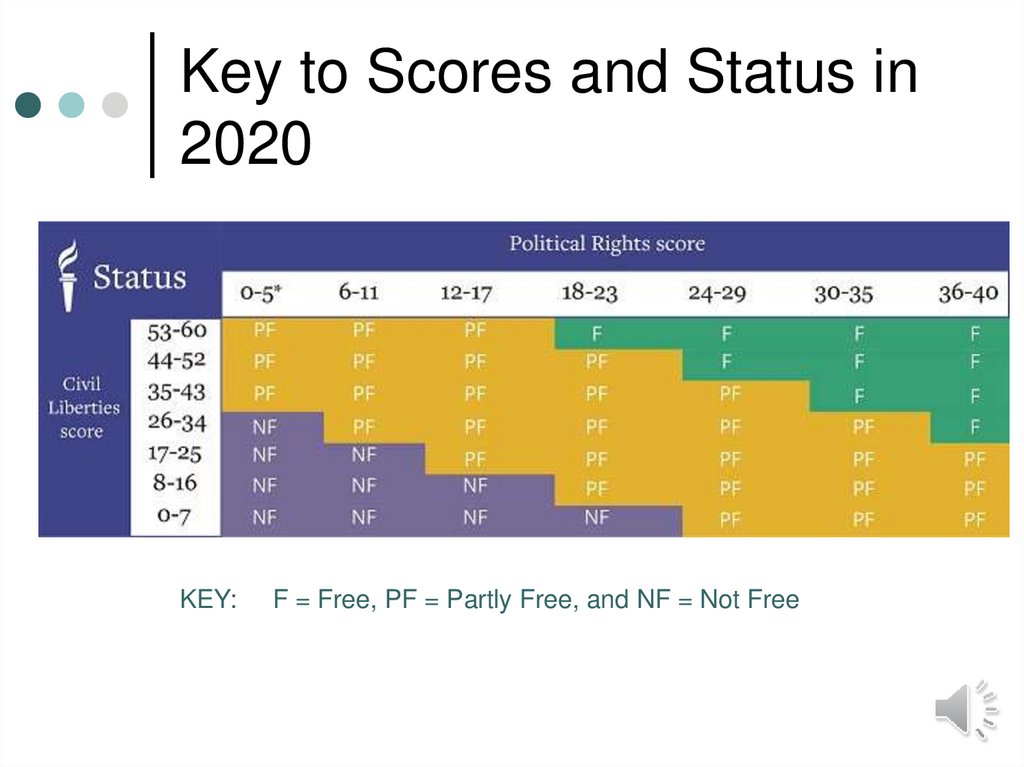
46.
Key to Scores and Status in2020
KEY:
F = Free, PF = Partly Free, and NF = Not Free
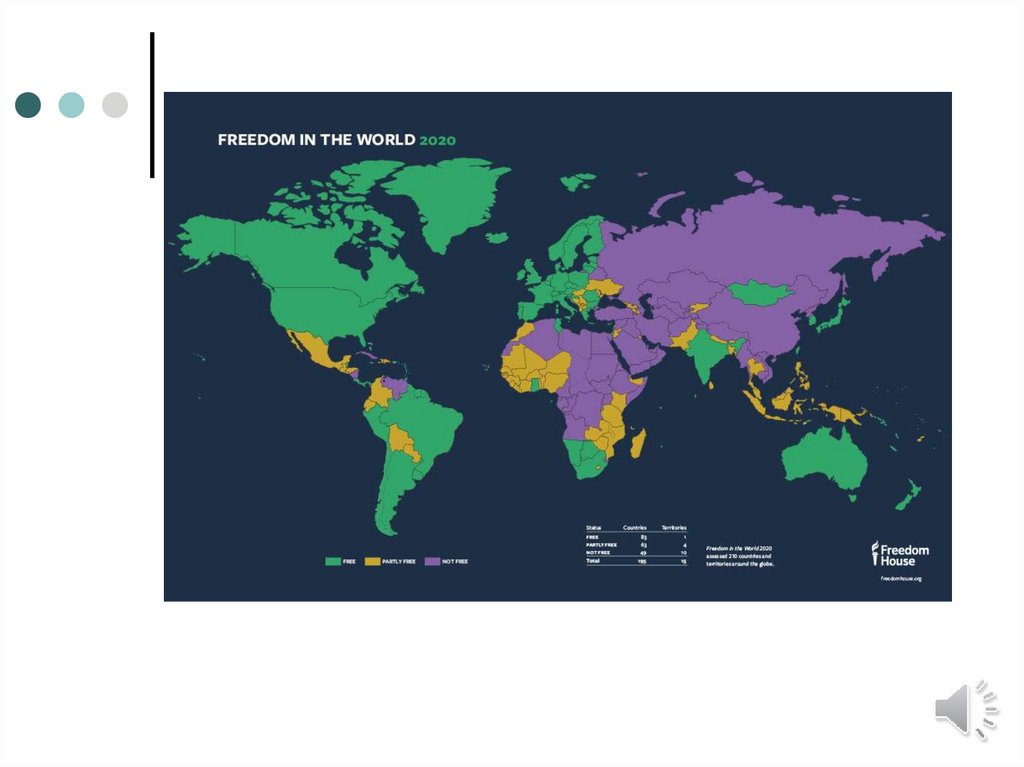
47.
Table. The global trend of freedom development inthe world (classification of countries by the level of
freedom)
Groups of countries
Year
free
partly free
non-free
total
1986
56
(33,5%)
56
(33,5%)
55
(32,9%)
167
1993
75
73
38
186
1995
76
61
54
191
1996
76
62
53
191
2000
86
58
48
192
2002
89
55
48
192
2019
83
(42,6%)
63
(32,3%)
49
(25,1%)
195
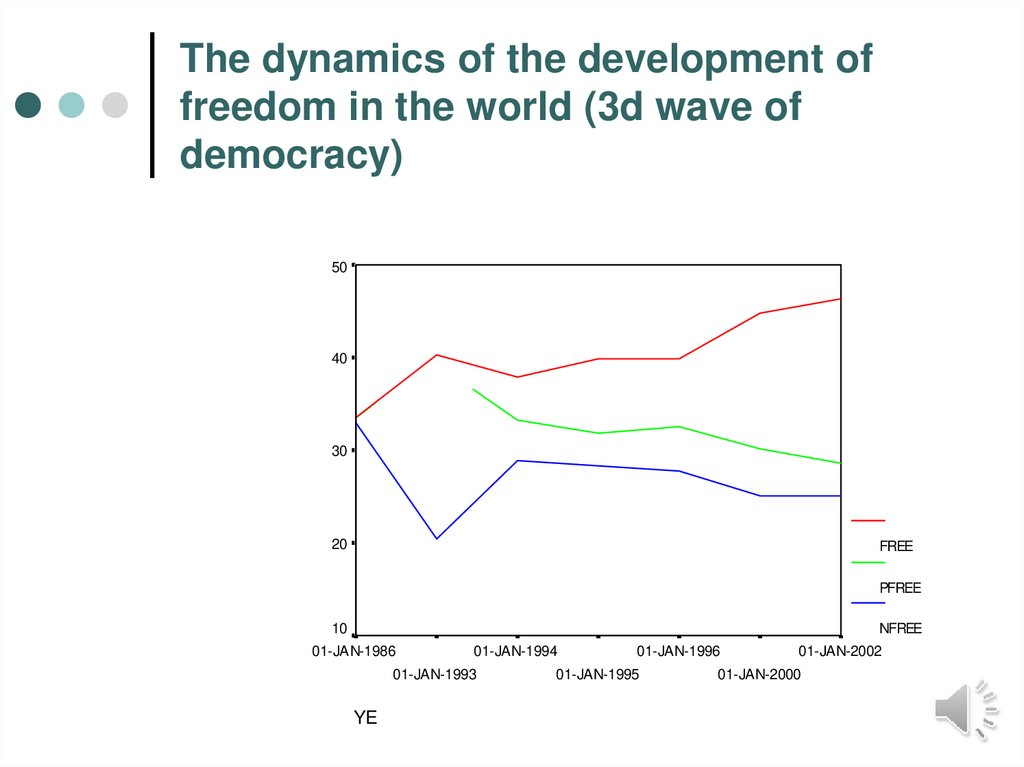
48.
The dynamics of the development offreedom in the world (3d wave of
democracy)
50
40
30
20
FREE
PFREE
10
NFREE
01-JAN-1986
01-JAN-1994
01-JAN-1993
YE
01-JAN-1996
01-JAN-1995
01-JAN-2002
01-JAN-2000
49.
50.
Tabl. Formal and liberal democracies, 19902000.Year
N of formal
democracies
N of free states
(liberal
democracies)
Shear of free
states in formal
democracies
Total states
1990
76 (46,1%)
65 (39,4%)
85,5%
165
1991
91 (49,7%)
76 (41,5)
83,5%
183
1992
99 (53,9%)
75 (40,3%)
75,8%
186
1993
108 (56,8%)
72 (37,9%)
66,7%
190
1994
114 (59,7%)
76 (39,8%)
66,7%
191
1995
117 (61,3%)
76 (39,8%)
65,0%
191
2000
120 (62,5%)
86 (44,8%)
71,7%
192
51.
Dynamics of formal and liberaldemocracies in the 1990s
90
80
70
60
50
FD
40
LD
30
DLD
01-JAN-1990
01-JAN-1992
01-JAN-1991
YE
01-JAN-1994
01-JAN-1993
01-JAN-2000
01-JAN-1995
52.
53.
Conclusions:The freedom index of the "House of Freedom" is a
complex indicator of liberal democracy, not just
freedom in the world.
It contains in itself much of the positive, available in
other indexes.
It has been used for global annual studies of
democracy since 1972.
The index of freedom makes it possible to trace the
dynamics of the development of liberal democracy in
the world.
The index of freedom is actively used by
comparativist researchers.
54.
4. Comparison of theindexes of democracy
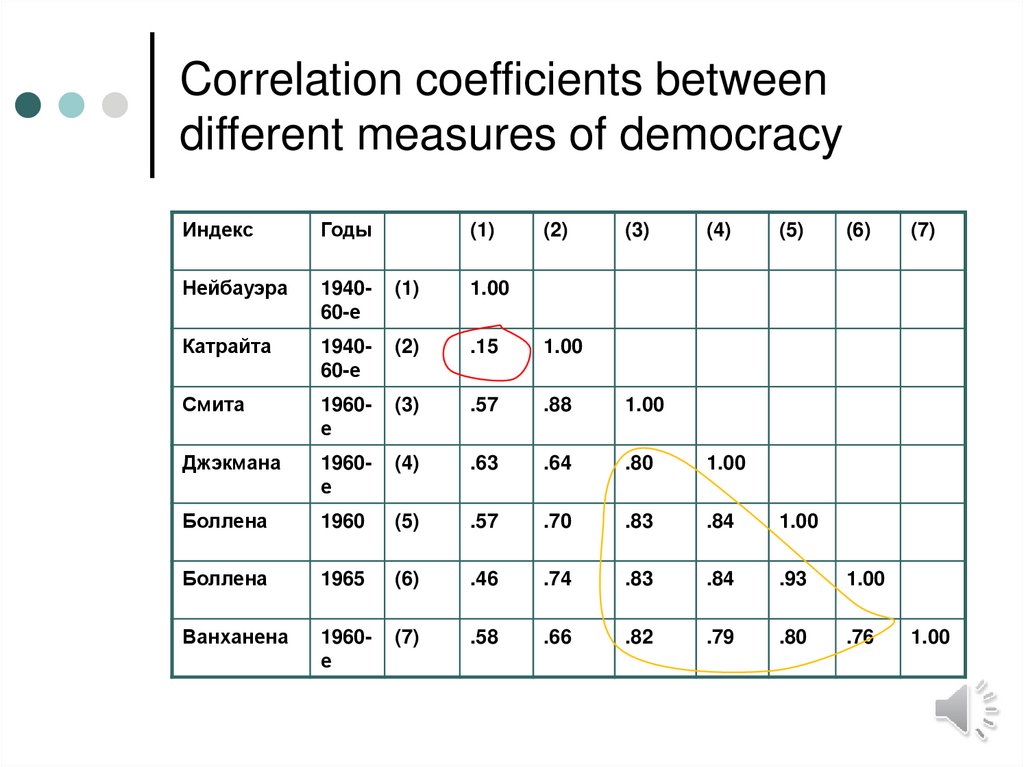
55.
Correlation coefficients betweendifferent measures of democracy
Индекс
Годы
Нейбауэра
194060-е
(1)
1.00
Катрайта
194060-е
(2)
.15
1.00
Смита
1960е
(3)
.57
.88
1.00
Джэкмана
1960е
(4)
.63
.64
.80
1.00
Боллена
1960
(5)
.57
.70
.83
.84
1.00
Боллена
1965
(6)
.46
.74
.83
.84
.93
1.00
Ванханена
1960е
(7)
.58
.66
.82
.79
.80
.76
(1)
(2)
(3)
(4)
(5)
(6)
(7)
1.00
56.
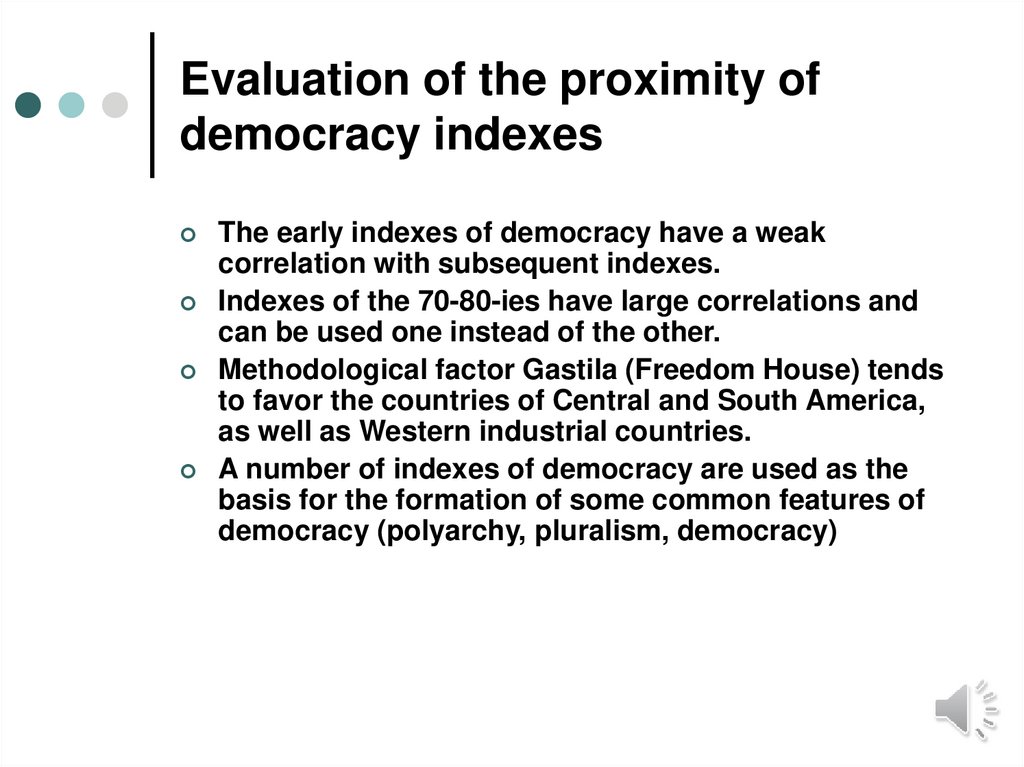
Evaluation of the proximity ofdemocracy indexes
The early indexes of democracy have a weak
correlation with subsequent indexes.
Indexes of the 70-80-ies have large correlations and
can be used one instead of the other.
Methodological factor Gastila (Freedom House) tends
to favor the countries of Central and South America,
as well as Western industrial countries.
A number of indexes of democracy are used as the
basis for the formation of some common features of
democracy (polyarchy, pluralism, democracy)
57.
5. Generalized index ofdemocracy
58.
Generalization of democracy in Kemanindex of democraticness (Keman H. (ed.).
Comparative Democratic Politics. L. et all: Sage, 2002)
The variables of democracy:
(1) Pluralism – representing the possibilities of
organizing as a group on the societal level
free from the state.
(2) Polyarchy – indicating the positive
conditions for the population to participate in
national decision-making.
(3) Democraticness – a combined measure of
both these variables and thus presenting the
degree of democraticness in a society from a
comparative perspective.
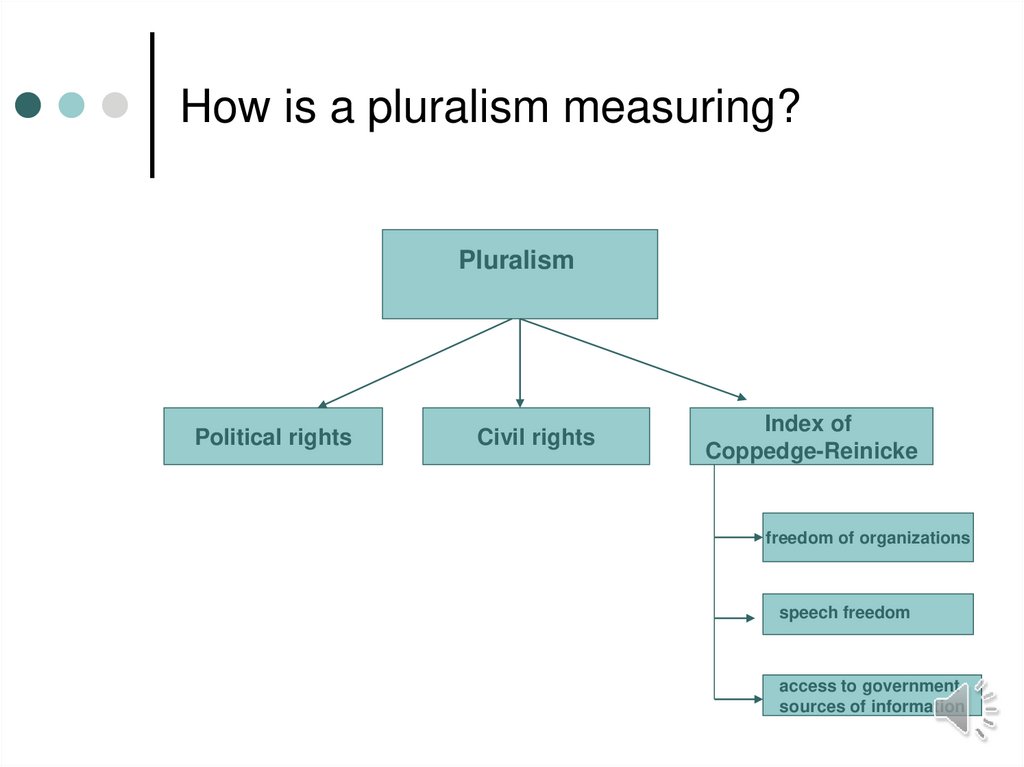
59.
How is a pluralism measuring?Pluralism
Political rights
Civil rights
Index of
Coppedge-Reinicke
freedom of organizations
speech freedom
access to government
sources of information
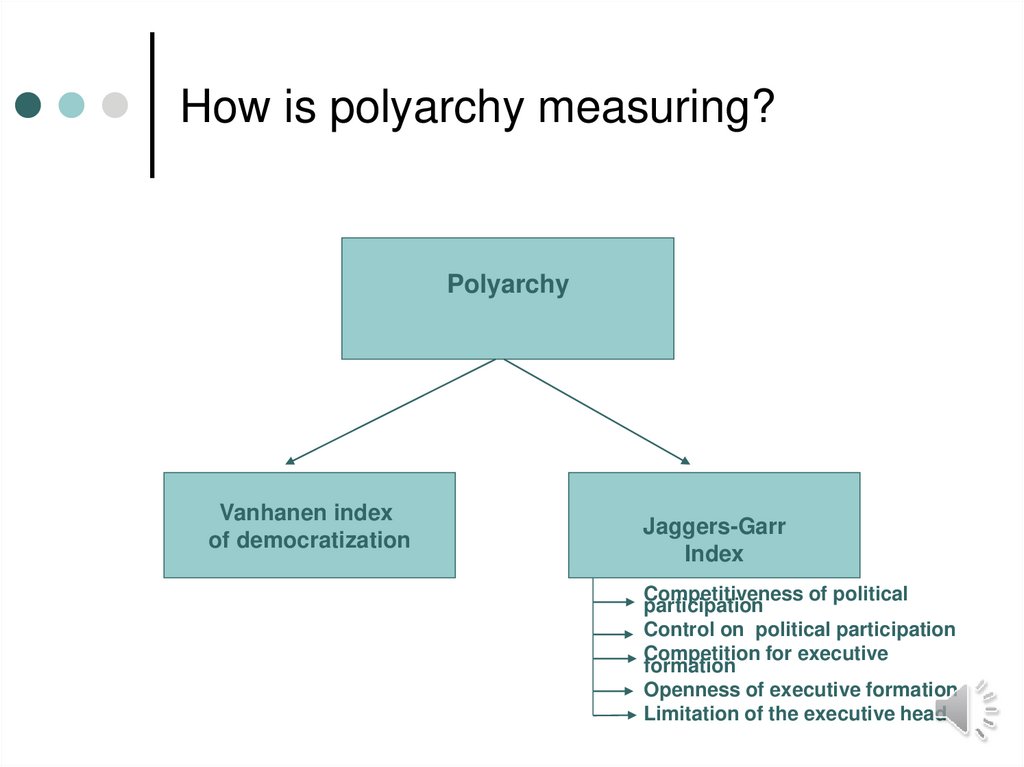
60.
How is polyarchy measuring?Polyarchy
Vanhanen index
of democratization
Jaggers-Garr
Index
Competitiveness of political
participation
Control on political participation
Competition for executive
formation
Openness of executive formation
Limitation of the executive head
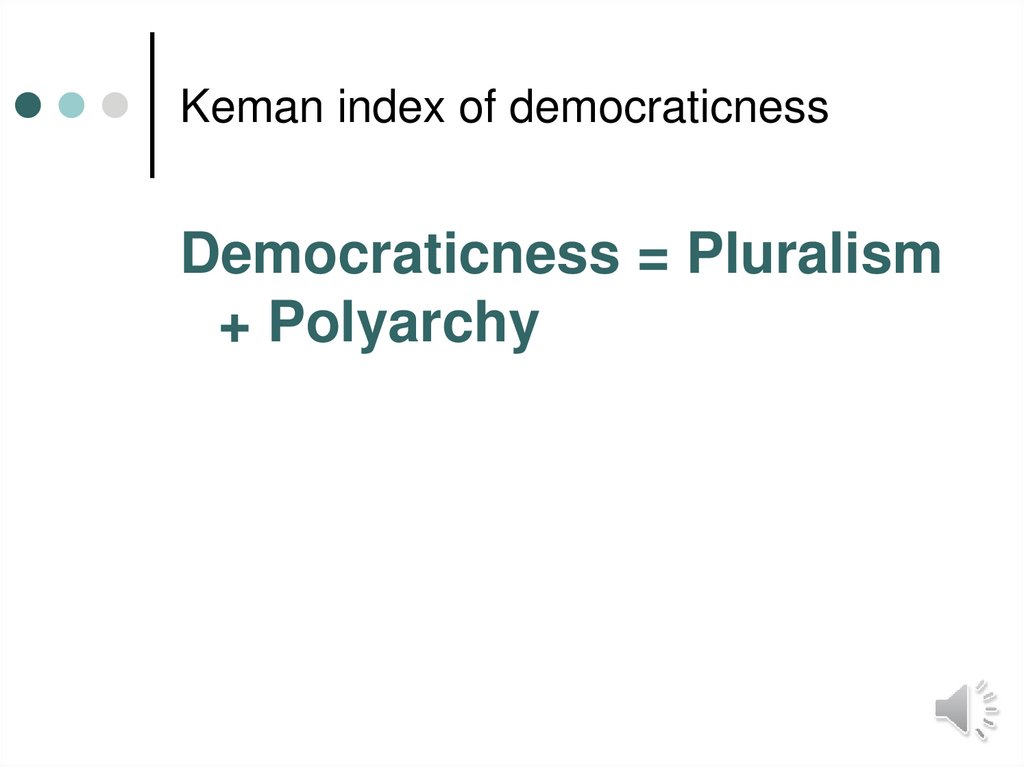
61.
Keman index of democraticnessDemocraticness = Pluralism
+ Polyarchy
62.
Table. Average scores of indicators of the level ofdemocracy for type of countries
Type of countries
Pluralism
(N=161)
Polyarchy
(N=145)
Democraticness
(N=127)
OECD -members 1.06 (17.4%)
1.25 (20.0%)
2.29 (22.0%)
Post-communist
-0.67 (3.7%)
0.04 (15.9%)
-0.55 (4.7%)
Latin-American
0.59 (19.9%)
0.32 (15.2%)
0.73 (17.3%)
Other countries
-0.48 (59.6%)
-0.62 (49.7%)
-1.19 (56.7%)
Duration:
Old
1.23 (19.2%)
1.40 (18.6%)
2.66 (21.3%)
Recent
0.81 (46.5%)
0.75 (37.2%)
1.48 (42.7%)
New
-0.11 (34.3%)
0.20 (44.2%)
-0.04 (36%)