


 economics
 industry
Similar presentations:


")


")

Global material flows and resource productivity
1.
GLOBAL MATERIALFLOWS AND RESOURCE
PRODUCTIVITY
Summary for Policymakers
U N I T E D N AT I O N S
ENVIRONMENT
PROGRAMME
2.
AcknowledgementsSUMMARY FOR POLICYMAKERS
Authors: Heinz Schandl, Marina Fischer-Kowalski,
James West, Stefan Giljum, Monika Dittrich, Nina
Eisenmenger, Arne Geschke, Mirko Lieber, Hanspeter
Wieland, Anke Schaffartzik, Fridolin Krausmann, Sylvia
Gierlinger, Karin Hosking, Manfred Lenzen, Hiroki
Tanikawa, Alessio Miatto, and Tomer Fishman
Copy Editor: Karin Hosking
Contributing Organisations: Commonwealth Scientific
and Industrial Research Organisation (CSIRO);
Institute for Ecological Economics, Vienna University
of Economics and Business (WU), Austria; Institute
of Social Ecology, Alpen Adria University Klagenfurt,
Austria; Institute for Energy and Environmental
Research Heidelberg (ifeu), Germany; University of
Sydney, Australia; and Nagoya University, Japan.
This publication may be reproduced in whole or in part and
in any form for educational or non-profit purposes without
special permission from the copyright holder, provided
acknowledgement of the source is made. UNEP would
appreciate receiving a copy of any publication that uses this
publication as a source.
Design and layout: Valeta Designs
Printed by: UNESCO
Photos: istock
Copyright © United Nations Environment Programme, 2016
No use of this publication may be made for resale or for
any other commercial purpose whatsoever without prior
permission in writing from the United Nations Environment
Programme.
We wish to thank all participants of the global material
flows and resource productivity working group meeting
in Tokyo, Japan on 24-25 September 2014: Chika
Aoki-Suzuki, Souvik Bhattacharjya, Christelle Beyers,
Shaofeng Chen, Anthony Chiu, Nicklas Forsell, Seiji
Hashimoto, Yuri Hayashi, Yasuhiko Hotta, Masatoshi
Kaneta, Satoshi Kojima, Shaoyi Li, Choudhury Rudra
Charan Mohanty, Yuichi Moriguchi, Keisuke Nansai,
Kazunobu Onogawa, Nobuhiko Shimizu, Sangwon
Suh, Tomohiro Tasaki, Steven Textoris, Ryuji Tomisaka,
Arnold Tukker, Maria Cristina Vallejo, Zhou Xin, and Koji
Yamada. We are grateful to the Japanese Ministry of
Environment and the Institute of Global Environmental
Strategies (IGES) for hosting the working group meeting.
Disclaimer:
The designations employed and the presentation of the
material in this publication do not imply the expression of
any opinion whatsoever on the part of the United Nations
Environment Programme concerning the legal status of
any country, territory, city or area or of its authorities,
or concerning delimitation of its frontiers or boundaries.
Moreover, the views expressed do not necessarily represent
the decision or the stated policy of the United Nations
Environment Programme, nor does citing of trade names or
commercial processes constitute endorsement.
We thank all members of the regional reference
group established for this report: Adel AbdelKader, Alicia Bárcena, Charles Davis, Ananda
Dias, Stefanos Fotiou, Stephan Moll, Hitomi
Rankine, Anna Stabrawa and Ron Witt.
The full report should be referenced as UNEP (2016).
Global Material Flows and Resource Productivity. An
Assessment Study of the UNEP International Resource
Panel. H. Schandl, M. Fischer-Kowalski, J. West, S. Giljum,
M. Dittrich, N. Eisenmenger, A. Geschke, M. Lieber,
H. P. Wieland, A. Schaffartzik, F. Krausmann, S. Gierlinger,
K. Hosking, M. Lenzen, H. Tanikawa, A. Miatto, and
T. Fishman. Paris, United Nations Environment Programme.
We are very grateful to the peer-review coordinator A.
Erinç Yeldan, reviewers Christelle Beyers, Shaofeng Chen,
Anthony Chiu, Roland Clift, Satoshi Kojima, Simron Singh,
Fatma Taskin and Tommy Wiedmann, and Minpeng Chen.
We thank Shaoyi Li, Tomas Marques and Vera Günther
of the Secretariat of the International Resource Panel.
Job Number: DTI/1974/PA
ISBN: 978-92-807-3554-3
2
3.
Produced by the International Resource PanelThis document highlights key findings from the report, and should be
read in conjunction with the full report. References to research and
reviews on which this report is based are listed in the full report.
The full report can be downloaded at http://www.unep.
org/resourcepanel/Publications. Additional copies can be
ordered via email: resourcepanel@unep.org, or via post:
United Nations Environment Programme (UNEP)
1 rue Miollis
Building VII
75015 Paris, France
3
GLOBAL MATERIAL FLOWS AND RESOURCE PRODUCTIVIT Y
Summary for Policymakers
SUMMARY REPORT FOR THE UNEP INTERNATIONAL RESOURCE PANEL
Global material
flows and resource
productivity
4.
PrefaceSUMMARY FOR POLICYMAKERS
in 2015, decided to champion ambitious
actions to improve resource efficiency as
a core element of a broader strategy in
pursuit of sustainable development.
Janez Potočnik
All around the world, strategies and
programmes that are mainstreaming
sustainable natural resource management
into national development plans are being
designed and implemented. A growing
number of countries are promulgating laws
and regulations and implementing effective
policy frameworks that support resource
efficiency and guide investments into green
and greening sectors of the economy.
Alicia Bárcena
In recent years, interest in resource efficiency
and sustainable management of natural
resources has increased considerably,
standing out as one of the top priorities
on the international political agenda.
With the historic adoption of the 2030 Agenda
for Sustainable Development in September
2015 in New York, the international community
committed itself to 17 Sustainable Development
Goals to transform our world into a better place
for current and future generations. It has been
widely acknowledged that such a world can
only be achieved and sustained if we better
take care of, conserve and use natural resources
and significantly improve resource efficiency in
both consumption and production in the years
to come. The SDGs emphasize the pressing
need to decouple economic growth and human
well-being from ever-increasing use of natural
resources and related environmental impact.
As part of this historic recognition, the
leaders of the G7, at their summit in Germany
4
Accurate, reliable data and scientific information
are essential to economic planning and
policymaking. Robust indicators are needed to
measure progress with decoupling and resource
efficiency and identify areas for improvement.
The International Resource Panel has
produced several scientific assessment
reports on resource efficiency and decoupling
and is therefore in the perfect position
to provide precisely such scientifically
profound, policy-relevant information.
With this report, the Working Group on
Global Material Flows of the International
Resource Panel provides, for the first time,
a comprehensive and harmonized data set
of material use and movement in the global
5.
Hence, decoupling material use and relatedenvironmental impacts from economic growth is
essential for ensuring the prosperity of human
society and a healthy natural environment.
But in order to be successful, decoupling
efforts need to go beyond simple efficiency
gains that arise from maturing economies.
The findings of this report have the potential
to contribute significantly to many national
and regional natural resource management
and resource efficiency efforts and are
particularly relevant for the implementation and
monitoring of all decoupling-related Sustainable
Development Goals over the next 14 years.
The International Resource Panel is committed
to continuing to provide cutting-edge scientific
knowledge on sustainable resource management
and resource efficiency. We are very grateful to
Heinz Schandl and Marina Fischer-Kowalski and
their co-authors for their important contribution
to the understanding of global material flows
and resource productivity, and we are very
much looking forward to the response of policymakers and business leaders to the tremendous
challenges, opportunities and implications
highlighted in this report and data set.
5
GLOBAL MATERIAL FLOWS AND RESOURCE PRODUCTIVIT Y
The report also provides a new material
footprint indicator, reporting the amount
of materials that are required for final
consumption, which sheds light on the true
impact of economies. By relating global
supply chains to final demand for resources,
the indicator is a good proxy for the average
material standard of living in a country. It
indicates that the level of development and
well-being in wealthy industrial countries
has been achieved largely through highly
resource-intensive patterns of consumption
and production, which are not sustainable, even
less replicable to other parts of the world.
This report also shows that consumption is the
main driver of increased material use, more
important than population growth in recent
decades. With millions of people lifted out
of poverty and a rapidly expanding middle
class in the coming decades, a prosperous and
equitable world calls for transformative changes
in lifestyles and consumption behaviour.
SUMMARY REPORT FOR THE UNEP INTERNATIONAL RESOURCE PANEL
economy for the past 40 years. Based on
this solid data set, it analyses status, trends,
structure and dynamics of resource use,
including extraction, trade and consumption
of biomass, fossil fuels, metal ores and nonmetallic minerals. The report finds that global
material use has tripled over the past four
decades, with annual global extraction of
materials growing from 22 billion tonnes
(1970) to 70 billion tonnes (2010).
6.
ForewordSUMMARY FOR POLICYMAKERS
Natural resources provide the foundation of
our lives on Earth. Water, soil, energy, minerals
and metals underpin our standards of living.
They feed and shelter us, and provide for
our material needs throughout our lives.
Yet pressures on these natural resources are
mounting. A growing population and heightened
world economic demand in the past half century
are rapidly depleting these vital resources,
inflicting great harm on the natural environment
and human health. In our ever-more globalized
economy, sustainable management of natural
resources will become increasingly important.
When the world’s nations approved the
Sustainable Development Goals in 2015, they
set out a path towards solving some of these
great challenges. These ambitious goals aim
to eradicate poverty and sustain economic
growth, while maintaining the natural resource
base and planetary ecosystems for future
generations. Turning the goals into reality will
require concerted action by the entire world,
developed and developing countries alike. For
these reasons, we must better understand
where and how natural resources are used.
Ibrahim Thiaw
6
7.
Global material use has been accelerating.Material extraction per capita increased from
7 to 10 tonnes from 1970 to 2010, indicating
improvements in the material standard of
living in many parts of the world. Domestic
extraction of materials has grown everywhere
to meet increased demand for materials.
However, Europe and the Asia-Pacific region
have not met all of their material demand from
domestic extraction and have increasingly
relied on large imports. Trade in materials is
thus booming, driven mainly by consumption.
It is my sincere hope that the findings
of this important assessment will inspire
political and business leaders to take the
action needed to achieve the SDGs.
The report also lays bare the large gaps in
material standards of living that exist between
North America and Europe and all other
world regions. Annual per capita material
footprint for the Asia-Pacific, Latin America
I would like to express my gratitude to the
International Resource Panel, under the
leadership of Janez Potočnik and Alicia Bárcena,
for developing this substantial report.
Ibrahim Thiaw
United Nations Assistant-Secretary-General
and UNEP Deputy Executive Director
7
GLOBAL MATERIAL FLOWS AND RESOURCE PRODUCTIVIT Y
and the Caribbean, and West Asia is between
9 and 10 tonnes, or half that of Europe and
North America, which is about 20 to 25
tonnes per person. In contrast, Africa has an
average material footprint of below 3 tonnes
per capita. Such a distribution of materials
supports unequal standards of living and
highlights how much work will be needed to
achieve sustainable development for all.
SUMMARY REPORT FOR THE UNEP INTERNATIONAL RESOURCE PANEL
This latest report from the International
Resource Panel, Global Material Flows
and Resource Productivity, provides a
comprehensive, scientific overview of this
important issue. It shows a great disparity
of material consumption per capita between
developing and developed countries.
This has tremendous implications for
achieving the SDGs in the next 14 years.
8.
SUMMARY FOR POLICYMAKERS8
9.
ContentsResource efficiency has taken centre stage in the international policy debate
12
Decoupling is the imperative of modern environmental policy
14
Global material use has accelerated
17
Trade in materials has grown dramatically and mobilizes much greater amounts of
materials than direct traded flows indicate
20
Consumption has been the main driver of growing global material use
24
Production has shifted from very material-efficient countries to countries that have
lower material efficiency, which has resulted in an overall decline in material efficiency
26
The level of well-being achieved in wealthy industrial countries cannot be generalized
globally based on the same system of production and consumption
29
The richest countries consume on average 10 times as many materials as the poorest countries
31
A new comprehensive database for global material flows
30
Indicators from material flow accounts
36
Providing information on the sustainable development goals
39
Next steps
41
References
43
9
GLOBAL MATERIAL FLOWS AND RESOURCE PRODUCTIVIT Y
10
SUMMARY REPORT FOR THE UNEP INTERNATIONAL RESOURCE PANEL
Introduction
10.
SUMMARY FOR POLICYMAKERSIntroduction
Measuring economic activity at aggregate and
detailed levels through the System of National
Accounts is a standard activity undertaken
by every country. A new study by the United
Nations Environment Programme (UNEP)
International Resource Panel provides, for the
first time, a coherent account of material use
in the global economy and for every nation,
which is complementary to the System of
National Accounts. The study reports material
extraction and trade of materials to provide an
authoritative database and indicators that can
be used by the policy and business communities
to monitor the supply and demand of materials.
The study is supported by an extensive
database covering 40 years of the extraction,
trade and consumption of biomass, fossil
10
fuels, metal ores and non-metallic minerals.
The database and related indicators can also
support the implementation of the Sustainable
Development Goals global indicator framework,
particularly by helping to measure SDG targets
8.4 (resource efficiency in consumption and
production), 12.2 (sustainable management
and efficient use of natural resources), and
12.5 (waste reduction). The data are made
available through the UNEP online data portal
UNEP Live http://uneplive.unep.org/ and on
the International Resource Panel (IRP) website
http://www.unep.org/resourcepanel/.
Most economic activity depends, to a varying
extent, on the supply of materials and other
natural resources such as energy, water and
11.
11GLOBAL MATERIAL FLOWS AND RESOURCE PRODUCTIVIT Y
Trends and improvements in material
productivity show the combined effect of
innovation and technological change and
policy for resource efficiency and sustainable
consumption and production. It is now
commonly understood that fuelling the
aspirations of a growing global population –
the provision of housing, mobility and food,
electricity and water and modern consumer
goods – will not be possible without very
large improvements in the material and
energy efficiency of the global economy.
The new information provided in this study
will help identify opportunities, risks and
vulnerabilities related to the global supply
of raw materials and show the potential
for efficiency gains and reductions in
material use in the global economy.
SUMMARY REPORT FOR THE UNEP INTERNATIONAL RESOURCE PANEL
land. A growing world economy requires more
materials for production and consumption,
which results in a variety of environmental
impacts including natural resource depletion,
waste and emissions, and climate change. In a
global context of growing population and per
capita consumption, economic planning and
policymaking require additional information on
material extraction and trade to accompany
standard national accounting. Such information
allows assessment of material productivity
at global, regional and country levels.
12.
SUMMARY FOR POLICYMAKERSResource efficiency has taken centre stage
in the international policy debate
The notion of resource efficiency and the need
to improve the value economies generate per
unit of material use has truly been embraced
by the international policy community.
in the Agenda as stand-alone goals or
targets. The compelling need to decouple
economic growth and human well-being
from ever-increasing consumption of natural
resources is therefore now very evident in
policy discussion and many countries have
initiated policies to facilitate decoupling of
material use from economic well-being.
The United Nations 2030 Agenda for
Sustainable Development and its 17 SDGs,
which were agreed universally by all United
Nations member countries in September 2015,
state that sustainable natural resource use
and management are a necessary condition
to achieve a better future for current and
future generations. Sustainable Consumption
and Production (SCP), decoupling, resource
efficiency and waste minimization (the
3Rs – reduce, reuse, recycle) are featured
In addition, the leaders of the Group of 7 (G7)
met in Germany in June 2015 and decided
on ambitious action to improve resource
efficiency as a main element of a broader
strategy to promote sustainable materials
management and the circular economy.
12
13.
GLOBAL MATERIAL FLOWS AND RESOURCE PRODUCTIVIT YSUMMARY REPORT FOR THE UNEP INTERNATIONAL RESOURCE PANEL
A number of countries have spearheaded the
need for greater resource productivity and
reduced material use per unit of economic
growth as part of their economic development
strategies and plans. Most notably Japan, the
European Union and China have instituted
high-level policy agendas for reducing material
extraction and use and increasing the circular
behaviour of their economies through
remanufacturing, recycling and reuse. Japan’s
Sound Material Cycle policy objective, the
European Strategy for Sustainable Natural
Resource Management and the Chinese circular
economy promotion law are key examples of
the growing interest in resource efficiency
and sustainable materials management.
13
14.
SUMMARY FOR POLICYMAKERSDecoupling is the imperative of modern
environmental policy
Decoupling material use and environmental
impacts from economic growth is a strategy
that will be essential for ensuring future human
well-being based on much lower material
throughput. Many regions and countries have
embarked on strategies to substantially increase
the material efficiency of their economies and
to reduce overall levels of material use. The
European Union, Japan and China, among
others, now have high-level policy frameworks
and laws that support resource efficiency and
guide investments into green sectors of the
economy supported by sustainable consumption
and production practices. Increasingly,
developing countries are mainstreaming SCP
and green economy policies into their national
development plans acknowledging the need to
decouple their human development efforts from
ever-increasing natural resource use, emissions
14
and waste. UNEP and the IRP are providing
independent, coherent and authoritative
scientific assessments of policy relevance on
the sustainable use of natural resources and,
in particular, their environmental impacts
over the full life cycle; and contributing to
a better understanding of how to decouple
economic growth from environmental
degradation. This information allows countries
to inter alia monitor progress of their efforts
to reduce material throughput and improve
the material efficiency of their economies.
A degree of success in decoupling economic
activity from material use occurs spontaneously
as economies mature and move to economic
activities that have a lower material intensity
and provide higher salaries and revenues.
Decoupling needs to go beyond efficiency gains
15.
GLOBAL MATERIAL FLOWS AND RESOURCE PRODUCTIVIT YSUMMARY REPORT FOR THE UNEP INTERNATIONAL RESOURCE PANEL
which come as a free dividend of structural
change. In doing so it will be possible to
service the needs and aspirations of a growing
global population and fast-increasing world
economy within the limits of available natural
resources and ecosystems. The technological
potential for decoupling is large and the
economic benefits are substantial. There are
many cost-effective ways for decoupling in
the short and medium terms and in the long
term decoupling will generate much higher
economic returns than business as usual.
In this report we measure resource productivity
in two ways. Firstly through the material
intensity of national economies as territorial
material use per unit of GDP, and secondly
through material consumption per unit of GDP.
15
16.
17.
Global material use has acceleratedAnnual global extraction of materials grew
from 22 billion tonnes in 1970 to around
70 billion tonnes in 2010 and non-metallic
minerals used in construction was the
fastest growing group of materials.
80,000
70,000
million tonnes
60,000
50,000
40,000
30,000
20,000
10,000
0
1970
1975
Non-metallic minerals
1980
1985
Metal ores
1990
Fossil fuels
1995
2000
2005
2010
Biomass
Figure 1. Global material extraction (DE) by four material categories, 1970–2010, million tonnes
17
GLOBAL MATERIAL FLOWS AND RESOURCE PRODUCTIVIT Y
of iron and steel, cement, energy and
construction materials. Growth in material
demand in Asian emerging economies since
the year 2000 has reverberated across
the world economy, especially in primary
material exporting regions and countries
such as Latin America, Africa and Australia.
SUMMARY REPORT FOR THE UNEP INTERNATIONAL RESOURCE PANEL
Global material use has grown strongly over the
past four decades, and has accelerated since
the year 2000 at a time when economic growth
and population growth have been slowing.
Overall, the global economy expanded more
than threefold over the four decades from
1970 to 2010, population almost doubled and
global material extraction tripled. The world
economy has experienced a great acceleration
in material use since 2000, strongly related
to the industrial and urban transformation in
China and many other emerging economies,
which has required unprecedented amounts
18.
SUMMARY FOR POLICYMAKERSThere has been a close relationship between
economic trends and natural resource use
over the past four decades. Global material
demand slowed in 2008 and 2009 due to
the global financial crisis, with trade flows
sharply contracting in 2009, but is again on
a growth trajectory. Sustained reductions
in material use depend on changes in the
structural asset base of an economy. Buildings,
transport and communication infrastructure,
energy generation capacity and water supply
systems as well as manufacturing infrastructure
require a certain level of material use to fuel
current systems. This means that there is
considerable inertia built into the global system
of material use, making it difficult to reduce
material use rapidly and on a sustained basis.
18
Growth in global material extraction was such
that per capita global material use increased
from 7 tonnes per capita in 1970 to 10 tonnes
per capita in 2010, a result of improvements
in the material standard of living in many parts
of the world. Domestic extraction of materials
has grown in all world regions to meet the
increased demand for materials. On a per
capita level, material use has declined in some
regions, including Europe and North America,
especially since 2008. Asia and the Pacific has
experienced the fastest growth, increasing its
global share of material use from around 25% in
1970 to above 50% in 2010. Asia and the Pacific
was the only region which did not experience a
decline in material use during the financial crisis.
19.
80,000million tonnes
50,000
40,000
30,000
20,000
10,000
0
1970
1980
1990
2000
Africa
Asia + Pacific
EECCA
Europe
La n America + Caribbean
North America
2010
West Asia
Figure 2. Domestic extraction (DE) by seven subregions, 1970–2010, million tonnes
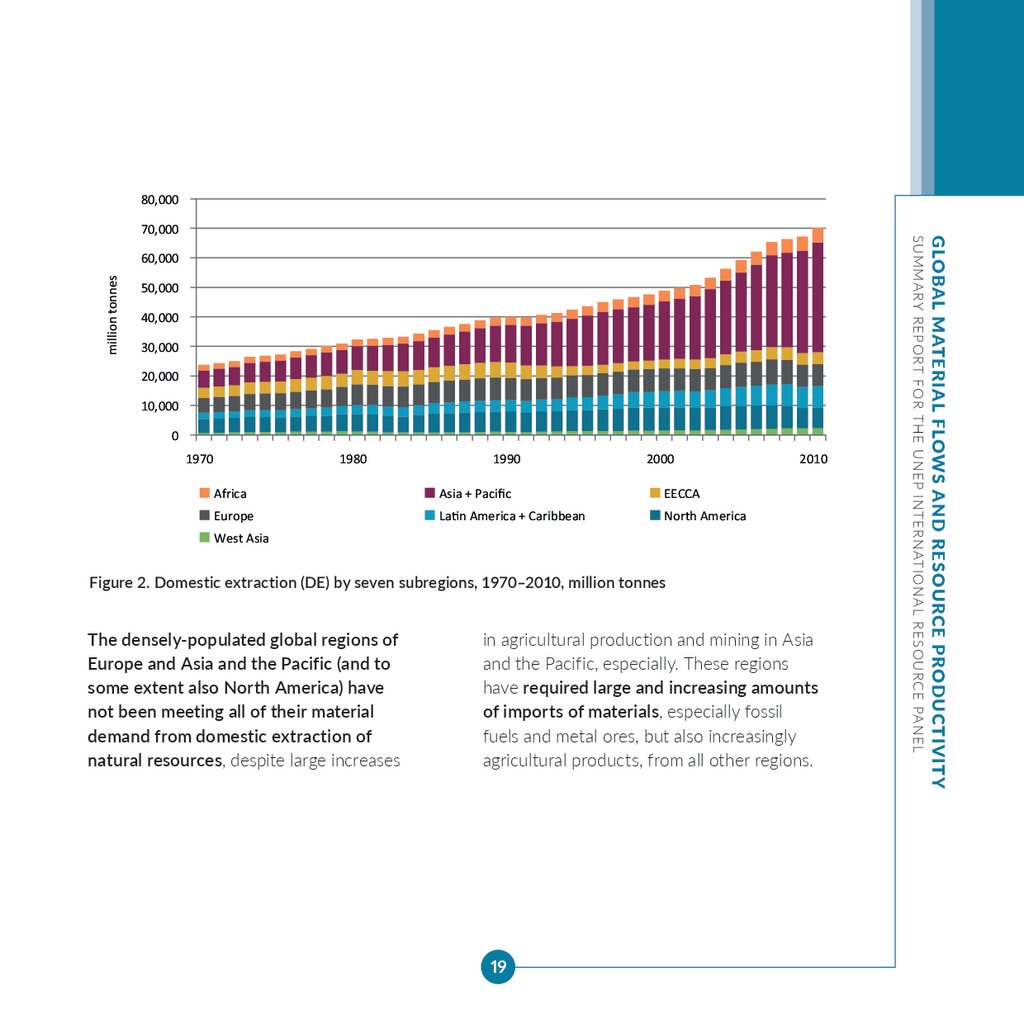
The densely-populated global regions of
Europe and Asia and the Pacific (and to
some extent also North America) have
not been meeting all of their material
demand from domestic extraction of
natural resources, despite large increases
in agricultural production and mining in Asia
and the Pacific, especially. These regions
have required large and increasing amounts
of imports of materials, especially fossil
fuels and metal ores, but also increasingly
agricultural products, from all other regions.
19
GLOBAL MATERIAL FLOWS AND RESOURCE PRODUCTIVIT Y
60,000
SUMMARY REPORT FOR THE UNEP INTERNATIONAL RESOURCE PANEL
70,000
20.
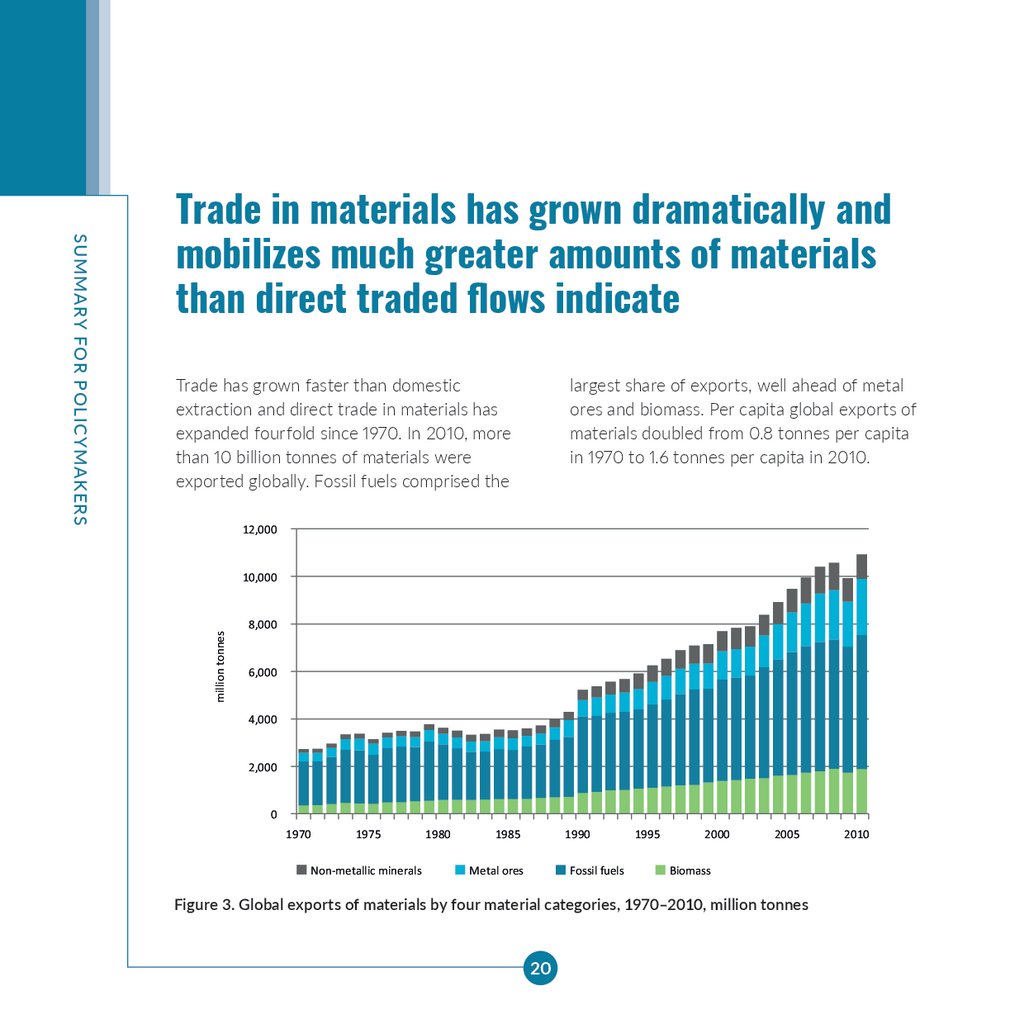
Trade has grown faster than domesticextraction and direct trade in materials has
expanded fourfold since 1970. In 2010, more
than 10 billion tonnes of materials were
exported globally. Fossil fuels comprised the
largest share of exports, well ahead of metal
ores and biomass. Per capita global exports of
materials doubled from 0.8 tonnes per capita
in 1970 to 1.6 tonnes per capita in 2010.
12,000
10,000
million tonnes
SUMMARY FOR POLICYMAKERS
Trade in materials has grown dramatically and
mobilizes much greater amounts of materials
than direct traded flows indicate
8,000
6,000
4,000
2,000
0
1970
1975
Non-metallic minerals
1980
1985
1990
Metal ores
Fossil fuels
1995
2000
2005
Biomass
Figure 3. Global exports of materials by four material categories, 1970–2010, million tonnes
20
2010
21.
10,0008,000
6,000
million tonnes
4,000
2,000
0
-2,000
-4,000
-6,000
-8,000
-10,000
1990
1995
2000
2005
Africa
Asia + Pacific
EECCA
Europe
Lan America + Caribbean
North America
West Asia
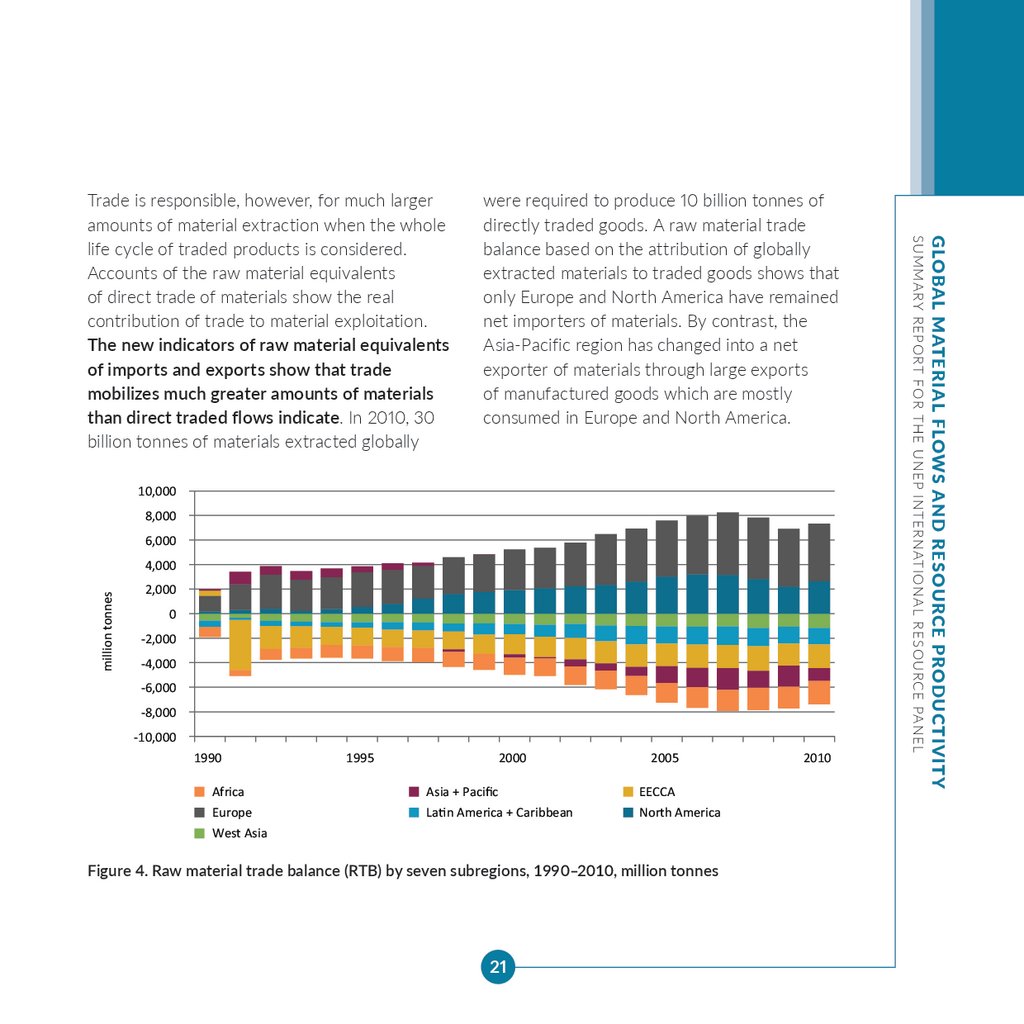
Figure 4. Raw material trade balance (RTB) by seven subregions, 1990–2010, million tonnes
21
2010
GLOBAL MATERIAL FLOWS AND RESOURCE PRODUCTIVIT Y
were required to produce 10 billion tonnes of
directly traded goods. A raw material trade
balance based on the attribution of globally
extracted materials to traded goods shows that
only Europe and North America have remained
net importers of materials. By contrast, the
Asia-Pacific region has changed into a net
exporter of materials through large exports
of manufactured goods which are mostly
consumed in Europe and North America.
SUMMARY REPORT FOR THE UNEP INTERNATIONAL RESOURCE PANEL
Trade is responsible, however, for much larger
amounts of material extraction when the whole
life cycle of traded products is considered.
Accounts of the raw material equivalents
of direct trade of materials show the real
contribution of trade to material exploitation.
The new indicators of raw material equivalents
of imports and exports show that trade
mobilizes much greater amounts of materials
than direct traded flows indicate. In 2010, 30
billion tonnes of materials extracted globally
22.
SUMMARY FOR POLICYMAKERSOver the four decades an increasing
specialization of countries with regard to
natural resource extraction for trade emerged,
especially for fossil fuels and metal ores but
to some extent also for agricultural products.
This is especially visible at the country level
where countries such as Australia, Brazil, Chile,
Indonesia and Kazakhstan, among others, have
increased their net exports of materials over
time while other countries such as South Korea
and the United States (until 2005) increased
their net imports of materials, or depended
(such as Germany, France and Japan) on a high
level of net imports over the four decades.
China, India and Pakistan show an interesting
pattern of fast-increasing import dependency
for the direct trade of materials which coincides
with the status of a net exporter when adjusting
trade flows for upstream and downstream
indirect material flows associated with trade, i.e.
looking at the raw material equivalents of trade.
This increasing specialization has created
very different environmental and social
issues in countries which are net exporters
22
or net importers of materials. It also creates
a different policy context for sustainable
natural resource use and decoupling of
economic growth from material use. Importing
countries have strong incentives to invest
in material efficiency strategies and policies
to increase their economic resilience. Such
policy efforts are not matched by exporting
countries. Both types of countries are affected
by global resource price changes but in very
different ways. Countries relying on material
imports profit from low world market prices
and their economic performance is harmed by
high prices. Material exporters make windfall
gains when natural resource prices are high
but experience a hit to their balance of trade
when prices fall and production contracts;
these effects have been experienced since
about 2014 in commodity-exporting regions
including Latin America, Africa and Australia.
23.
24.
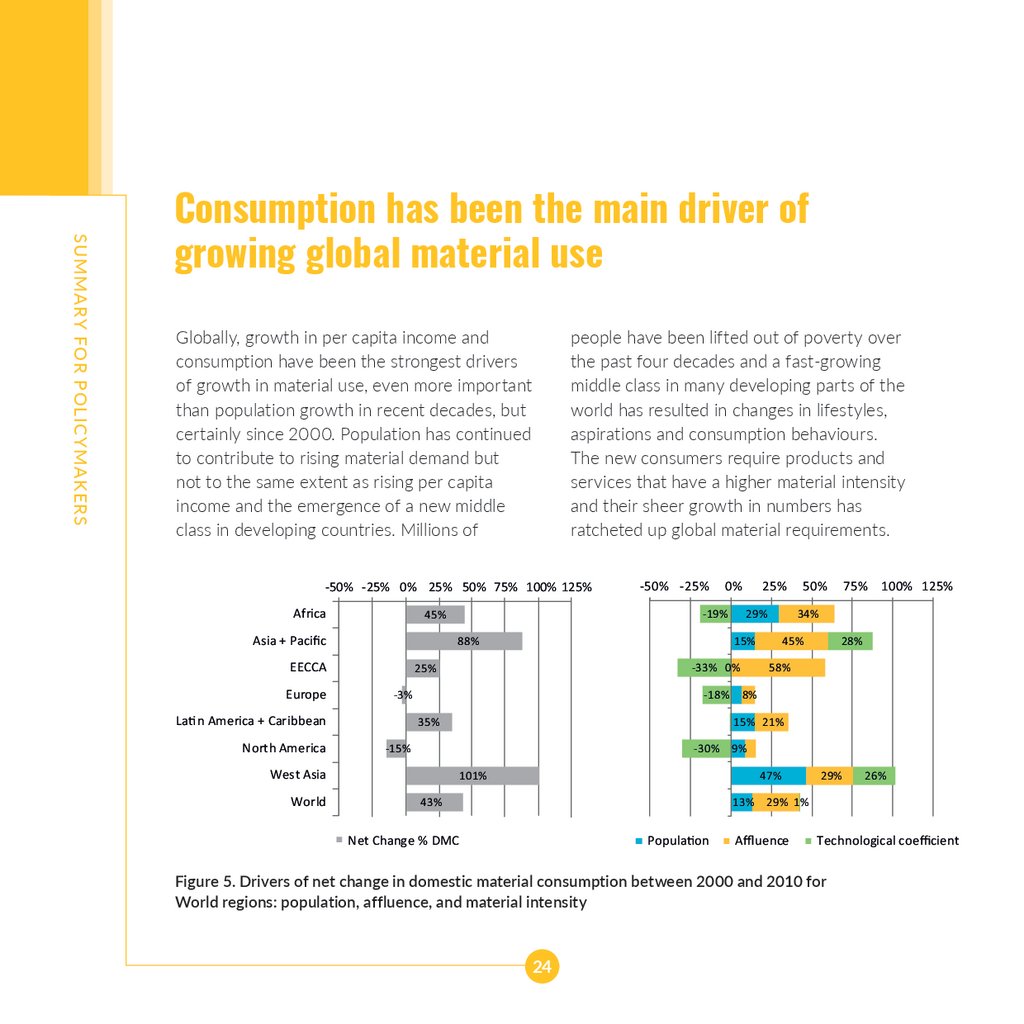
SUMMARY FOR POLICYMAKERSConsumption has been the main driver of
growing global material use
Globally, growth in per capita income and
consumption have been the strongest drivers
of growth in material use, even more important
than population growth in recent decades, but
certainly since 2000. Population has continued
to contribute to rising material demand but
not to the same extent as rising per capita
income and the emergence of a new middle
class in developing countries. Millions of
people have been lifted out of poverty over
the past four decades and a fast-growing
middle class in many developing parts of the
world has resulted in changes in lifestyles,
aspirations and consumption behaviours.
The new consumers require products and
services that have a higher material intensity
and their sheer growth in numbers has
ratcheted up global material requirements.
-50% -25% 0% 25% 50% 75% 100% 125%
Africa
North America
-18%
-3%
World
75% 100% 125%
28%
45%
58%
8%
15% 21%
35%
-30%
-15%
West Asia
50%
34%
29%
-33% 0%
25%
La n America + Caribbean
25%
15%
88%
EECCA
Europe
0%
-19%
45%
Asia + Pacific
-50% -25%
9%
47%
101%
43%
13%
Net Change % DMC
Popula on
29%
29% 1%
Affluence
Technological coefficient
Figure 5. Drivers of net change in domestic material consumption between 2000 and 2010 for
World regions: population, affluence, and material intensity
24
26%
25.
GLOBAL MATERIAL FLOWS AND RESOURCE PRODUCTIVIT YSUMMARY REPORT FOR THE UNEP INTERNATIONAL RESOURCE PANEL
Material efficiency mitigated some of the
growth of material use driven by growing
population and consumption between
1970 and 1990. Since 1990, there has
not been much improvement in global
material efficiency, which actually started
to decline around the year 2000.
25
26.
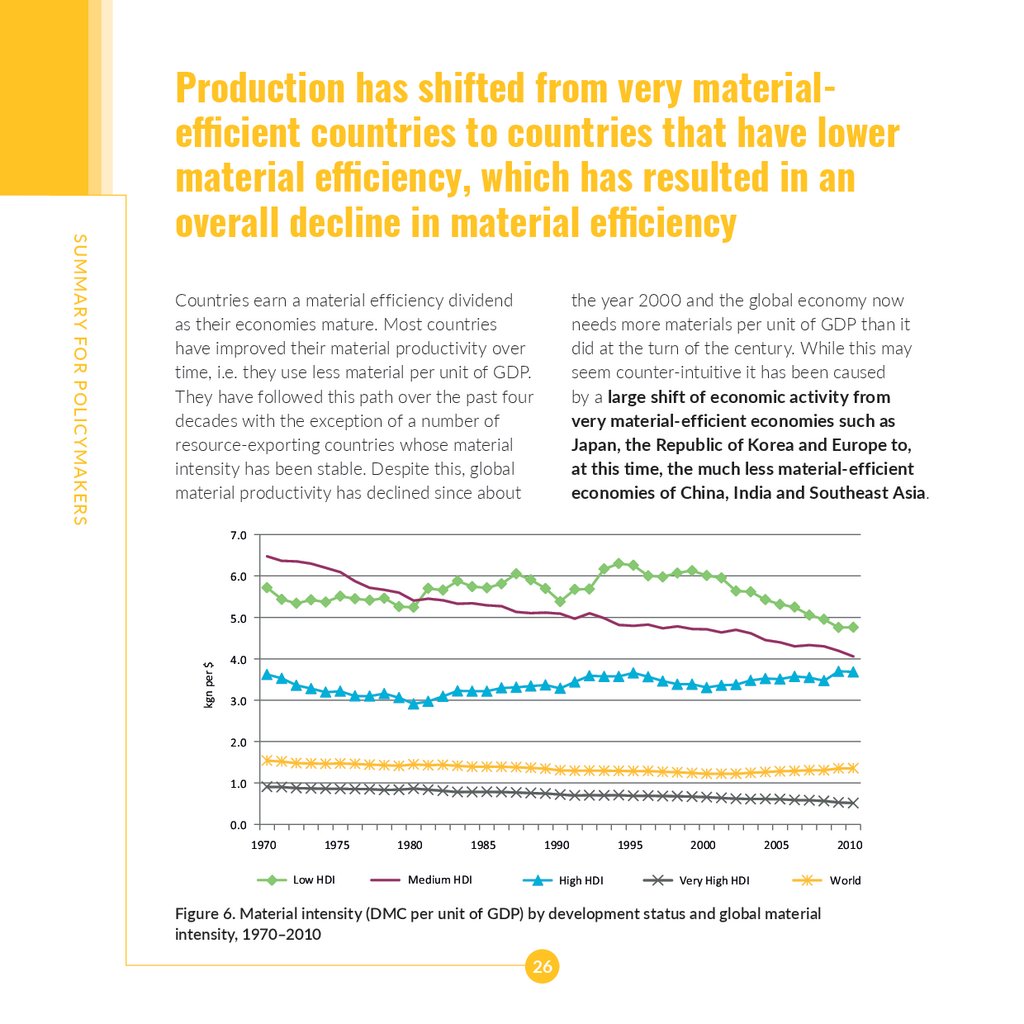
Countries earn a material efficiency dividendas their economies mature. Most countries
have improved their material productivity over
time, i.e. they use less material per unit of GDP.
They have followed this path over the past four
decades with the exception of a number of
resource-exporting countries whose material
intensity has been stable. Despite this, global
material productivity has declined since about
the year 2000 and the global economy now
needs more materials per unit of GDP than it
did at the turn of the century. While this may
seem counter-intuitive it has been caused
by a large shift of economic activity from
very material-efficient economies such as
Japan, the Republic of Korea and Europe to,
at this time, the much less material-efficient
economies of China, India and Southeast Asia.
7.0
6.0
5.0
kgn per $
SUMMARY FOR POLICYMAKERS
Production has shifted from very materialefficient countries to countries that have lower
material efficiency, which has resulted in an
overall decline in material efficiency
4.0
3.0
2.0
1.0
0.0
1970
1975
Low HDI
1980
1985
1990
Medium HDI
High HDI
1995
2000
2005
Very High HDI
Figure 6. Material intensity (DMC per unit of GDP) by development status and global material
intensity, 1970–2010
26
2010
World
27.
Large investment into research anddevelopment would enable fast-increasing
material efficiency in many sectors of the
27
GLOBAL MATERIAL FLOWS AND RESOURCE PRODUCTIVIT Y
Increasing the efficiency of material use in the
global economy will not happen spontaneously
but will require well-designed policies that
change incentives for businesses and for
corporate and government consumers. The high
level of well-being in many industrial countries
has been achieved by policy settings that
allowed labour productivity to grow often at
the cost of growing material use and waste. To
allow general well-being for a large number of
people by 2030 requires substantial changes.
economy. A rise in the efficiency of material use
will, however, lead to lower costs for producers
and consumers and the money saved on primary
materials will be invested and spent elsewhere
in the economy. This will cause a rebound effect
where efficiency will allow for higher economic
growth and perhaps contradict efforts to
reduce overall material demand. Achieving
human development and improved well-being
at lower levels of material consumption will
require a complex policy mix of resource
efficiency investments and incentives, a
price on primary material at extraction
and a shift to shorter working hours, i.e.
compensating productivity gains with more
free time to offset rebound spending.
SUMMARY REPORT FOR THE UNEP INTERNATIONAL RESOURCE PANEL
This results in overall growing environmental
pressure per unit of economic activity
and shows that additional effort around
public policy and financing is required
to improve material use efficiency
substantially in the coming decades.
28.
29.
The current global system of production, basedon particular supply chains and technologies,
results in a material footprint of Europe’s
consumption of around 20 tonnes per capita
and a material footprint of North America’s
consumption of around 25 tonnes per capita.
Both regions have experienced a decline
in material footprint since 2008 caused by
the economic downturn during the global
financial crisis (GFC). Before the GFC, North
America had a per capita material footprint
of well above 30 tonnes and Europe of well
above 20 tonnes, and both regions were on
an upward trajectory. It remains to be seen
whether the economic recovery in North
America and Europe has put material footprint
on a growth trajectory again. If the material
footprint were to return to pre-GFC levels
in the wealthiest parts of the world it would
suggest that there is no level of income
yet at which material use has stabilized.
The material footprint indicator allows,
differently from measures of material extraction
and direct material use, the establishment of
29
GLOBAL MATERIAL FLOWS AND RESOURCE PRODUCTIVIT Y
The IRP has adopted a new indicator, the
material footprint of consumption (Wiedmann
et al. 2015). Material footprint reports the
amount of materials that are required for
final demand (household and government
consumption and capital investment) in a
country or region. By relating global supply
chains of materials to final demand this indicator
is a good proxy for the average material
standard of living achieved in a country.
SUMMARY REPORT FOR THE UNEP INTERNATIONAL RESOURCE PANEL
The level of well-being achieved in wealthy
industrial countries cannot be generalized
globally based on the same system of production
and consumption
30.
SUMMARY FOR POLICYMAKERSa landing point for industrial material use. The
available data suggest that industrial metabolism
of modern industrial economies stabilizes at
between 20 and 30 tonnes per capita for the
current ways in which we build houses and
transport infrastructure, how we organize
mobility, and how we deliver manufactured
goods, food and energy. Given the fact that
the global economy, at today’s level of resource
use, is already surpassing some environmental
thresholds (planetary boundaries), this
shows that the level of well-being achieved
in wealthy industrial countries cannot be
generalized globally based on the same
system of production and consumption. Large
improvements in decoupling are required
to service the needs and aspirations of a
growing global population in an inclusive way.
30
To reduce environmental pressures and impacts
of consumption and production, high-income
countries will need to substantially decrease
their current per capita material footprint.
Many developing countries, on the other
hand, will see their material footprint rise as
living standards improve. Policy settings in
countries that grow their infrastructure and
consumption substantially need to be tailored
towards achieving rapid and short-term gains
in resource efficiency to offset some of the
growth and to build cities and infrastructure in
way in which natural resource requirements,
waste and emissions can be minimized.
There is a large window of opportunity for
policy settings that support investment in
high-quality and long-lasting infrastructure
to support sustainable development.
31.
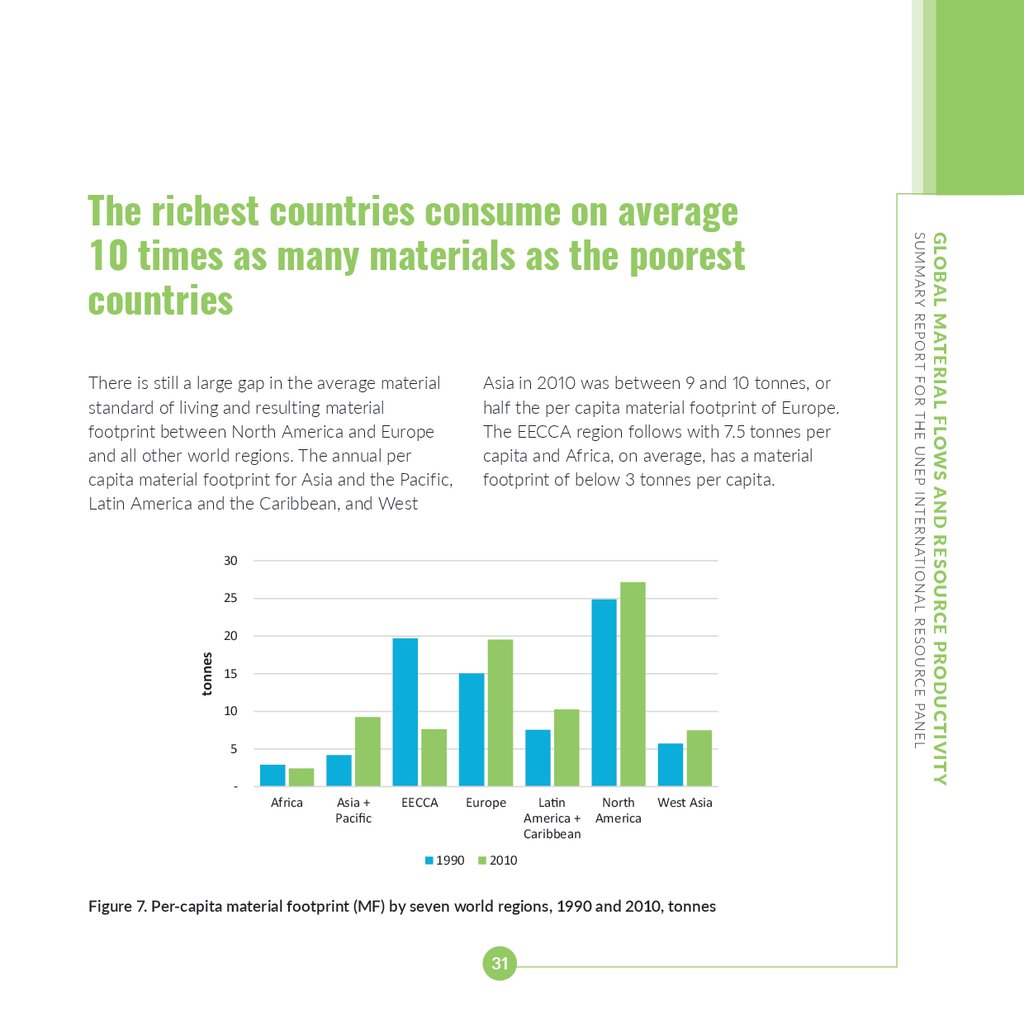
Asia in 2010 was between 9 and 10 tonnes, orhalf the per capita material footprint of Europe.
The EECCA region follows with 7.5 tonnes per
capita and Africa, on average, has a material
footprint of below 3 tonnes per capita.
30
25
tonnes
20
15
10
5
Africa
Asia +
Paci c
EECCA
1990
Europe
Latin
America +
Caribbean
North
America
West Asia
2010
Figure 7. Per-capita material footprint (MF) by seven world regions, 1990 and 2010, tonnes
31
GLOBAL MATERIAL FLOWS AND RESOURCE PRODUCTIVIT Y
There is still a large gap in the average material
standard of living and resulting material
footprint between North America and Europe
and all other world regions. The annual per
capita material footprint for Asia and the Pacific,
Latin America and the Caribbean, and West
SUMMARY REPORT FOR THE UNEP INTERNATIONAL RESOURCE PANEL
The richest countries consume on average
10 times as many materials as the poorest
countries
32.
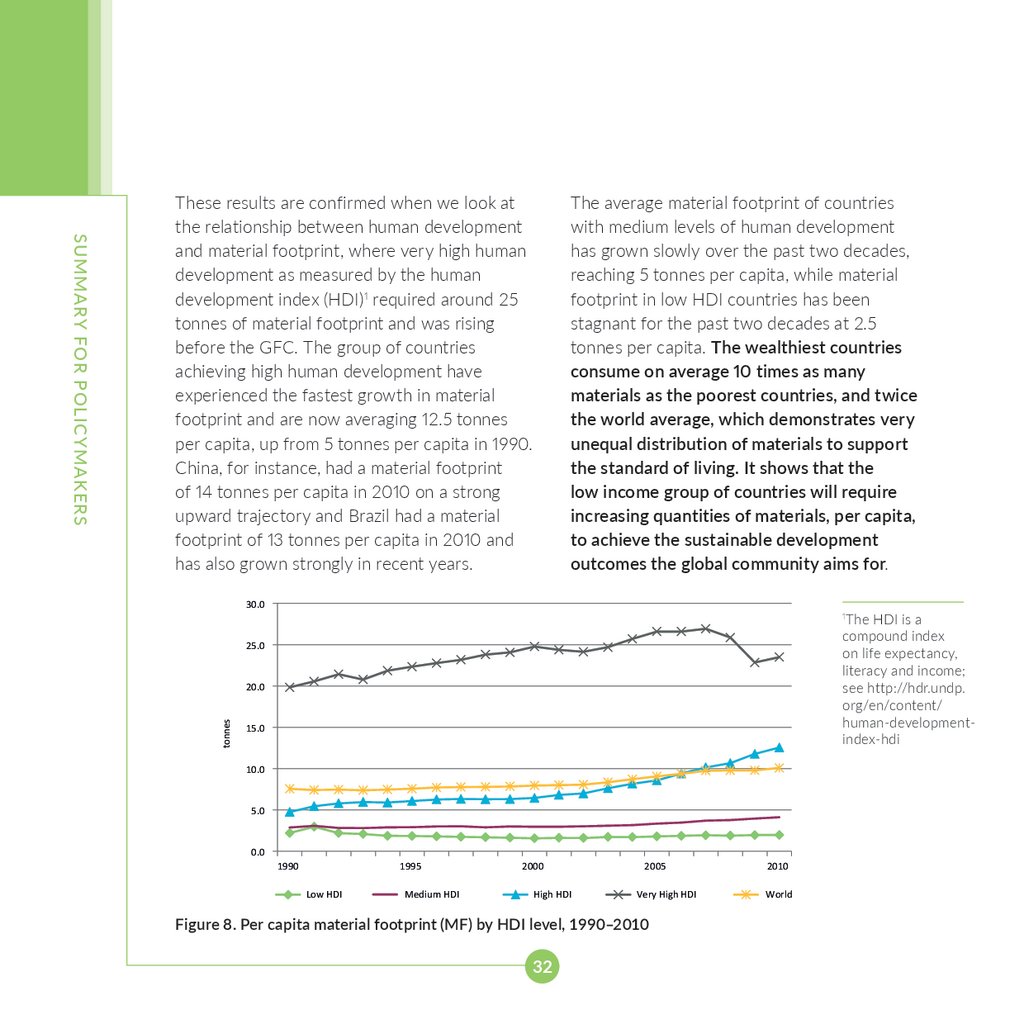
The average material footprint of countrieswith medium levels of human development
has grown slowly over the past two decades,
reaching 5 tonnes per capita, while material
footprint in low HDI countries has been
stagnant for the past two decades at 2.5
tonnes per capita. The wealthiest countries
consume on average 10 times as many
materials as the poorest countries, and twice
the world average, which demonstrates very
unequal distribution of materials to support
the standard of living. It shows that the
low income group of countries will require
increasing quantities of materials, per capita,
to achieve the sustainable development
outcomes the global community aims for.
30.0
The HDI is a
compound index
on life expectancy,
literacy and income;
see http://hdr.undp.
org/en/content/
human-developmentindex-hdi
1
25.0
20.0
tonnes
SUMMARY FOR POLICYMAKERS
These results are confirmed when we look at
the relationship between human development
and material footprint, where very high human
development as measured by the human
development index (HDI)1 required around 25
tonnes of material footprint and was rising
before the GFC. The group of countries
achieving high human development have
experienced the fastest growth in material
footprint and are now averaging 12.5 tonnes
per capita, up from 5 tonnes per capita in 1990.
China, for instance, had a material footprint
of 14 tonnes per capita in 2010 on a strong
upward trajectory and Brazil had a material
footprint of 13 tonnes per capita in 2010 and
has also grown strongly in recent years.
15.0
10.0
5.0
0.0
1990
1995
Low HDI
Medium HDI
2000
High HDI
2005
Very High HDI
Figure 8. Per capita material footprint (MF) by HDI level, 1990–2010
32
2010
World
33.
34.
SUMMARY FOR POLICYMAKERSA new comprehensive database for global
material flows is available
The IRP provides a comprehensive
understanding of linkages between the world
economy, population and material use for over
four decades (1970–2010) based on a new
and authoritative database of global material
extraction and a revised database for materials
trade. It uses a standard set of material flow
accounting indicators as well as new indicators.
The data and indicators presented by the IRP
will allow countries and regions to monitor their
progress in achieving greater material efficiency
through well-designed national policies and
regional initiatives. A large data set covering 40
years (1970–2010) and most countries of the
world has been established. It presents direct
and consumption-based material flow indicators
for seven world regions and for individual
countries, covering total usage, per capita use
and material use per US$. It also provides details
34
for different groups of materials and relates
indicators to human development outcomes.
It provides similar information for each of
seven world regions and about 180 countries
to support informed decision-making by policy
and business communities. The outlook is for
further growth in material use if countries
successfully improve economic and human
development and are able to raise living
standards and combat poverty. Assuming that
the world will implement similar systems
of production and provision for major
services – housing, mobility, food, energy
and water supply – nine billion people will
require about 180 billion tonnes of materials
annually by 2050 (Schandl et al. 2016), almost
three times today’s amounts. This will result
in faster exploitation of natural resource
endowments and increased environmental
impacts related to material extraction and use.
35.
While many resources will still be abundantlyavailable over the medium and long terms,
pollution and ecosystem degradation and a
changing climate will dominate political debate
around using materials more effectively
and efficiently. Fast-expanding demand for
materials will, however, require very large
investments into new extraction and supply
infrastructure and will possibly contribute to
local conflict over alternative uses of land,
water, energy and materials. Such conflict
is already pronounced in the energy sector
where mining competes with agriculture
and urban development in many places.
35
GLOBAL MATERIAL FLOWS AND RESOURCE PRODUCTIVIT Y
also have negative impacts on human health
and quality of life. It will ultimately lead to
the depletion of certain natural resources
and will cause supply shortages of critical
materials in the short and medium terms.
SUMMARY REPORT FOR THE UNEP INTERNATIONAL RESOURCE PANEL
In this report, the use of materials – society’s
metabolism – is interpreted as an environmental
pressure. The larger the material use the bigger
the pressure. Material use is also closely related
to other pressure indicators including waste
flows, energy use and carbon emissions, land
use and water use. When material use grows,
ceteris paribus, other pressure indicators will
increase. Material use is also used as a proxy
for environmental impacts that occur across the
whole life cycle of material use from extraction,
transformation and consumption to disposal.
When material use increases, the environmental,
social and economic impacts of material use
also see a commensurate rise. Rising material
use will result in climate change, higher levels
of acidification and eutrophication of soils
and water bodies, increased biodiversity
loss, more soil erosion and increasing
amounts of waste and air pollution. It will
36.
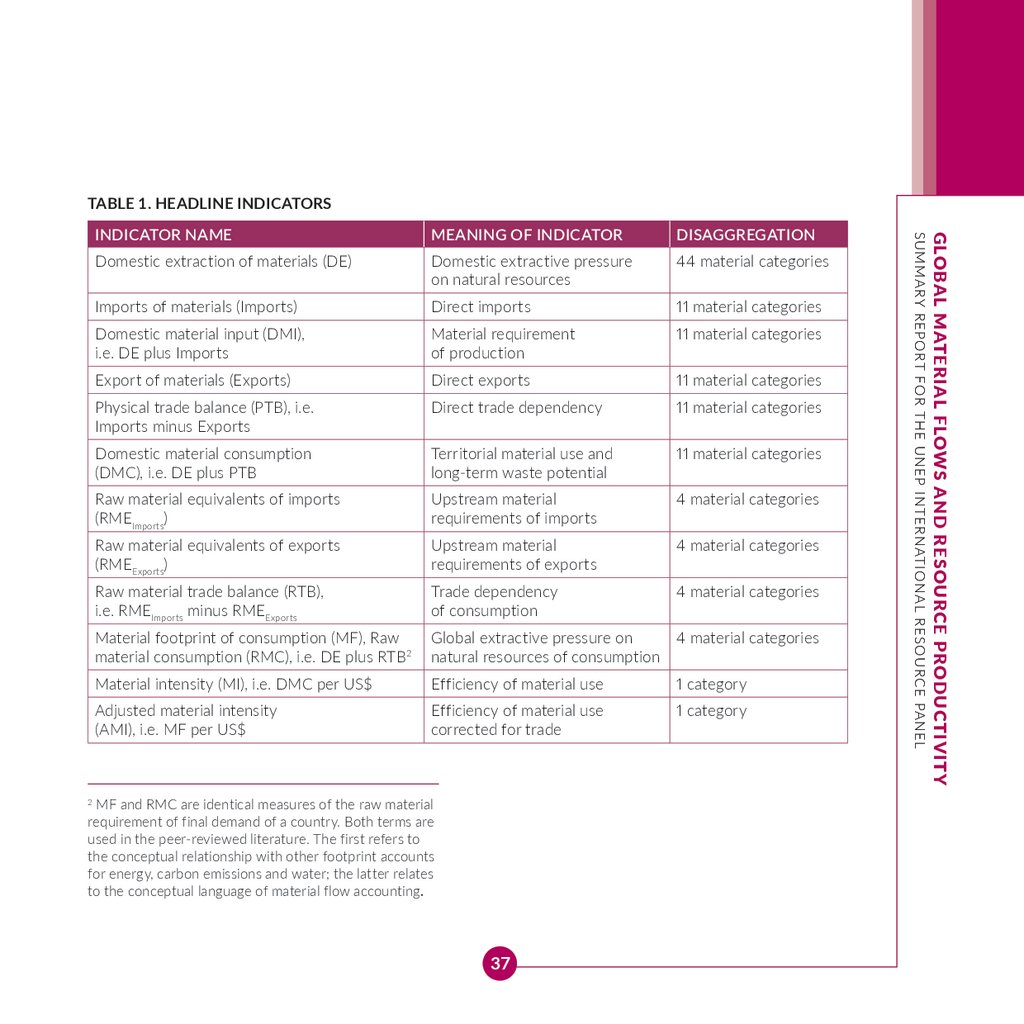
SUMMARY FOR POLICYMAKERSIndicators can be created from material
flow accounts
The data set presented by the IRP is based on
international agreements and methodological
standardization arrived at over the last two
decades (Fischer-Kowalski et al. 2011). Based on
the material flow data and additional empirical
analysis, indicators for direct material use and
for whole of life cycle material requirements
of trade have been established. The headline
indicators describe different aspects of the
physical economy and are summarized in Table 1.
36
Different headline indicators, as well as the
more detailed information available for each
headline indicator, provide information for
different policy domains and cover all aspects
of the environmental pressure of material
use. They include natural resource depletion
locally and in the global economy, resource
efficiency, and waste management and waste
minimization. They track the performance
of a national economy with regard to their
success in sustainable materials management,
resource efficiency and waste minimization.
37.
TABLE 1. HEADLINE INDICATORSDISAGGREGATION
Domestic extraction of materials (DE)
Domestic extractive pressure
on natural resources
44 material categories
Imports of materials (Imports)
Direct imports
11 material categories
Domestic material input (DMI),
i.e. DE plus Imports
Material requirement
of production
11 material categories
Export of materials (Exports)
Direct exports
11 material categories
Physical trade balance (PTB), i.e.
Imports minus Exports
Direct trade dependency
11 material categories
Domestic material consumption
(DMC), i.e. DE plus PTB
Territorial material use and
long-term waste potential
11 material categories
Raw material equivalents of imports
(RMEImports)
Upstream material
requirements of imports
4 material categories
Raw material equivalents of exports
(RMEExports)
Upstream material
requirements of exports
4 material categories
Raw material trade balance (RTB),
i.e. RMEImports minus RMEExports
Trade dependency
of consumption
4 material categories
Material footprint of consumption (MF), Raw
material consumption (RMC), i.e. DE plus RTB2
Global extractive pressure on
natural resources of consumption
4 material categories
Material intensity (MI), i.e. DMC per US$
Efficiency of material use
1 category
Adjusted material intensity
(AMI), i.e. MF per US$
Efficiency of material use
corrected for trade
1 category
MF and RMC are identical measures of the raw material
requirement of final demand of a country. Both terms are
used in the peer-reviewed literature. The first refers to
the conceptual relationship with other footprint accounts
for energy, carbon emissions and water; the latter relates
to the conceptual language of material flow accounting.
2
37
GLOBAL MATERIAL FLOWS AND RESOURCE PRODUCTIVIT Y
MEANING OF INDICATOR
SUMMARY REPORT FOR THE UNEP INTERNATIONAL RESOURCE PANEL
INDICATOR NAME
38.
39.
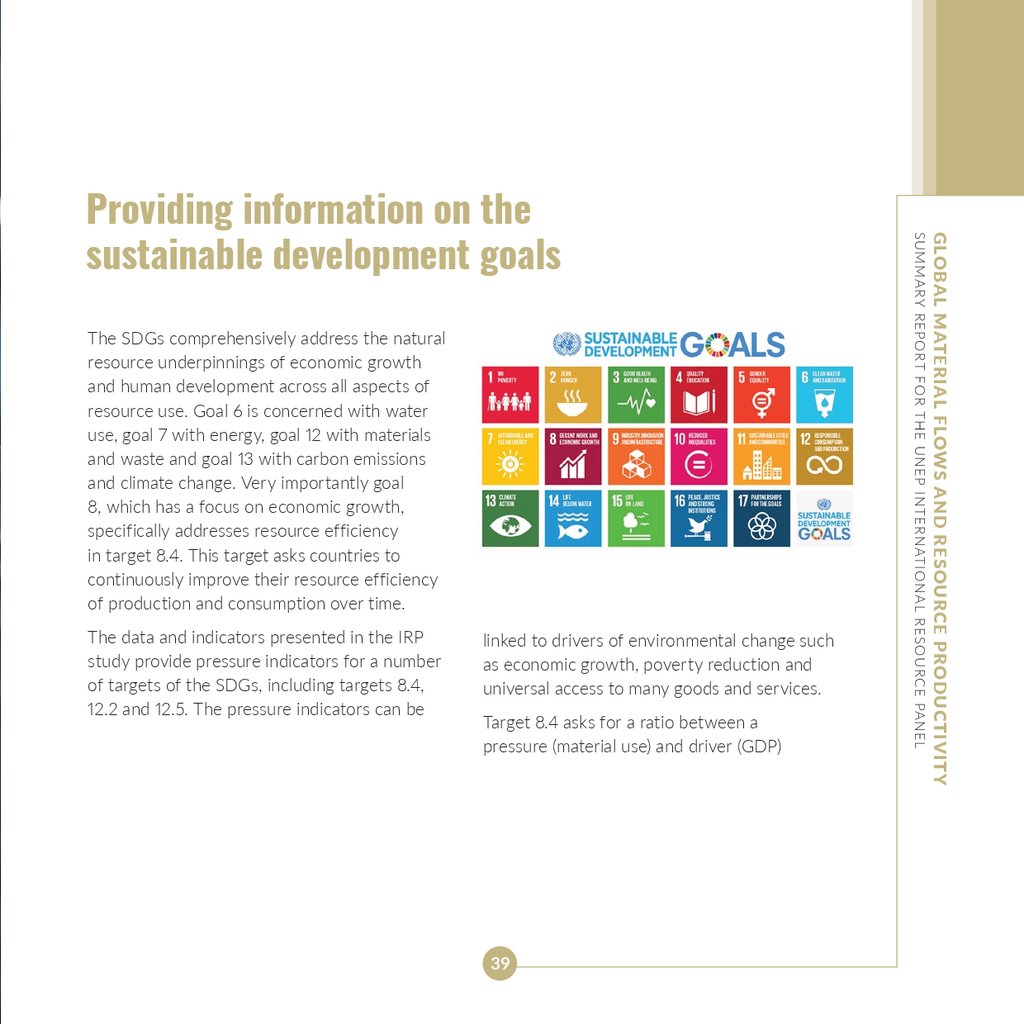
The data and indicators presented in the IRPstudy provide pressure indicators for a number
of targets of the SDGs, including targets 8.4,
12.2 and 12.5. The pressure indicators can be
linked to drivers of environmental change such
as economic growth, poverty reduction and
universal access to many goods and services.
Target 8.4 asks for a ratio between a
pressure (material use) and driver (GDP)
39
GLOBAL MATERIAL FLOWS AND RESOURCE PRODUCTIVIT Y
The SDGs comprehensively address the natural
resource underpinnings of economic growth
and human development across all aspects of
resource use. Goal 6 is concerned with water
use, goal 7 with energy, goal 12 with materials
and waste and goal 13 with carbon emissions
and climate change. Very importantly goal
8, which has a focus on economic growth,
specifically addresses resource efficiency
in target 8.4. This target asks countries to
continuously improve their resource efficiency
of production and consumption over time.
SUMMARY REPORT FOR THE UNEP INTERNATIONAL RESOURCE PANEL
Providing information on the
sustainable development goals
40.
SUMMARY FOR POLICYMAKERSfor production and consumption. The first
can be expressed as domestic material
consumption (DMC) per unit of GDP, the latter
as material footprint (MF) per unit of GDP.
in a country. This also provides information
on future material requirements of a global
economy that will service 9 billion people,
including a fast-growing urban and middle class
population, and will allow governments to set
targets for material use and material efficiency.
Target 12.2 asks for a measure of metabolic
performance at the national economy
level and can be expressed as DMC per
capita and MF per capita, reflecting both
production and consumption perspectives.
Target 12.5 is about waste reduction and can be
expressed as domestic material consumption
(DMC) per unit of land area to demonstrate
the ecological pressure of waste disposal.
Because the data are available for most
countries globally they can readily be used
to report against these very relevant targets
of the SDGs to demonstrate the extent to
which material use and material footprint have
contributed to the economic development
of countries and to monitor improvements
in the material intensity of economic activity
40
For many developing countries achieving the
SDGs will require increases in natural resource
use, waste and emissions. This may ultimately
overstretch natural resource supply systems
and the absorptive capacity of ecosystems
for waste and emissions. To make space for
human development needs, governments and
businesses need to work together to achieve
sustainable consumption and production. This
will allow high-income countries to reduce their
currently very high material use and developing
countries to increase their material use so
that they converge at a sustainable level.
41.
Extending and furtherdeveloping the accounts
The IRP has successfully cohered the existing
global knowledge base on material flows
and provided time series for four decades
(1970–2010) on material inputs and trade of
materials. The data set needs to be extended
in scale by providing periodic and timely
updates to the existing time series. The
assessment needs to be extended at the back
end of the material cycle to report outflows
to different environmental media – air, soil
and water – and to close the material balance
of national economies and at the global
scale. This will allow better understanding
of the material stock that services the global
economy, the relationship between existing
assets and flows and the long-term waste and
emission potential of the global economy.
Focusing on economic sectors
Material flow data sets are structured by
material characteristics but lack sufficient
sectoral detail to inform decision-making at
the level of economic sectors and specific
industries. While the information provides
important headline indicators, it is often not
specific enough to guide sectoral policies in
the domains of primary industries, cities and
trade. A first step of sectoral disaggregation into
production and consumption was introduced
through the adoption of the material footprint
indicator. More analysis is required, however,
to establish material input information for at
least broad economic sectors to move towards
a true satellite account for material flows. Such
analysis could be used in informing sectoral
policies and to monitor progress of such policy
initiatives. This is important to strengthen
the value of the information provided beyond
the policy community by increasing its
usefulness for business decision-making.
41
GLOBAL MATERIAL FLOWS AND RESOURCE PRODUCTIVIT Y
The work of the IRP in the domain of material
use and resource productivity is a first step
towards harmonizing global data sets and
establishing material flow satellite data at
national and global levels. Because of the
increasing natural resource, waste, and emission
pressures of global economic development
the knowledge base needs to grow further.
SUMMARY REPORT FOR THE UNEP INTERNATIONAL RESOURCE PANEL
Next steps
42.
Policy supportSUMMARY FOR POLICYMAKERS
Linking pressures, impacts
and global limits
The data sets and indicators presented by
the IRP are pressure indicators for material
flows. The pressures have been linked to the
main drivers of material demand – population,
consumption and economic growth. These
indicators allow for early diagnosis of economic
and environmental issues and can be used
to guide policy intervention. Pressures are
related to environmental impacts through
well-known processes and pathways. These
environmental impacts include diverse issues
such as climate change, resource depletion,
waste and pollution, toxicity and human
health. In many cases it is possible to establish
global limits for environmental pressures and
impacts such as, for example, the amount of
additional greenhouse gas emissions that would
keep the global climate below two degrees of
warming. More research is needed, however,
to increase the knowledge base around
these important linkages and explore how
they play out in different regional settings.
42
Data sets and indicators are used by the
policy community at different stages of
the policy cycle. They help in identifying
issues, establishing objectives, goals and
targets, and monitoring progress of policy
initiatives. There will need to be a greater
focus on the information needs of the policy
and business communities to tailor the data
and information to specific policy domains
to better assist the formulation of regional,
national and sectoral policy frameworks, to
identify policy tools and measures and to
improve the monitoring capacity of regions and
nations. Aligning the knowledge base to the
technical assistance to countries provided by
different United Nations agencies, especially
in the context of monitoring the SDGs and
with a strong regional focus, will support a
process by which well-designed policies can
guide global sustainable development.
43.
Schandl, H., S. Hatfield-Dodds, T. O.Wiedmann, A. Geschke, Y. Cai, J. West, D.
Newth, T. Baynes, M. Lenzen & A. Owen
(2016) Decoupling global environmental
pressure and economic growth: scenarios
for energy use, materials use and carbon
emissions. Journal of Cleaner Production.
FOR MORE INFORMATION,
CONTACT:
Secretariat of International Resource
Panel (IRP)
Division of Technology,
Industry, and Economics
United Nations Environment
Programme (UNEP)
Wiedmann, T. O., H. Schandl, M.
Lenzen, D. Moran, S. Suh, J. West & K.
Kanemoto (2015) The material footprint
of nations. Proceedings of the National
Academy of Sciences, 112, 6271–6276.
1 rue Miollis
Building VII
75015 Paris, France
T: +33 1 4437 1450
F: +33 1 4437 1474
E: resourcepanel@unep.org
www.unep.org/resourcepanel
43
GLOBAL MATERIAL FLOWS AND RESOURCE PRODUCTIVIT Y
Fischer-Kowalski, M., F. Krausmann, S.
Giljum, S. Lutter, A. Mayer, S. Bringezu,
Y. Moriguchi, H. Schutz, H. Schandl & H.
Weisz (2011) Methodology and Indicators of
Economy-wide Material Flow Accounting.
Journal of Industrial Ecology 15, 855–876.
SUMMARY REPORT FOR THE UNEP INTERNATIONAL RESOURCE PANEL
References
44.
Growing concern about assuring affordable, equitableand environmentally sustainable access to natural
resources is well founded. Global use of natural
resources has accelerated during the past decade
and emissions and waste have grown in line with
growing extraction of natural resources. Monitoring
natural resource use and decoupling economic growth
from natural resource use will be instrumental in
meeting the United Nations Sustainable Development
Goals. In this new report we show global natural
resource use trends over four decades and propose
indicators for evidence-based policy formulation.
w w w . unep. or g
www.unep.org
United Nations Environment Programme
United
Nations
Environment
P.O.
Box 30552
Nairobi,
00100 Kenya
Tel: (254 20) 7621234
Programme
Fax: (254 20) 7623927
POE-mail:
Box
30552,
00100
uneppub@unep.org
Nairobi,
Kenya
web:
www.unep.org
T: (254-20) 7621234
E: uneppubs@unep.org
The data and indicators presented address resource
requirements of production and consumption for
the globe, for seven world regions and for every
country. The indicators are good proxies for global
environmental impact and material standard of
living. They vary immensely between countries and
regions and show vast challenges and opportunities
ahead as we transition to a prosperous, equitable
and environmentally-friendly global society.
ISBN: 978-92-807-355 4-3
DTI/1974/PA
16-0027 1