


 economics
Similar presentations:


")

")
(ge) and World Economic Relations (WER)")


Globalization and its Representation in the World Economy
1.
Globalization and itsRepresentation in the World
Economy
2.
Planand the
1. The essence
basic aspects of
globalization.
2. The driving forces of globalization and its stages.
3. The impact of еconomic globalization on the
development of national economies.
4. Current international economic problems.
5. The process of international economic
integration as a representation of economic
globalization
6. Advantages and disadvantages of globalization
in the World Economy.
3.
Definitions of globalization:• "the compression of the world and the
intensification of the consciousness of the world
as a whole” ( Roland Robertson);
• …all those processes by which the peoples of the
world are incorporated into a single world society
(Martin Albrow and Elizabeth King);
• the increasing integration of economies around
the world, particularly through trade and
financial flows, but also the movement of ideas
and people, facilitated by the revolution in
telecommunications and transportation
4.
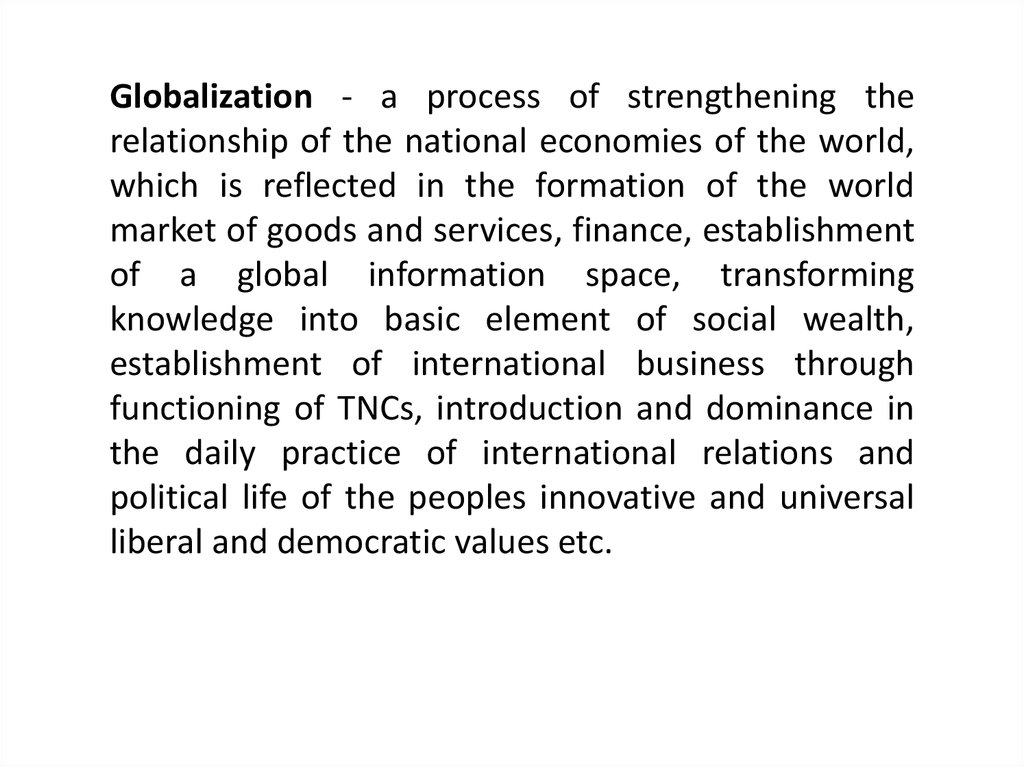
Globalization - a process of strengthening therelationship of the national economies of the world,
which is reflected in the formation of the world
market of goods and services, finance, establishment
of a global information space, transforming
knowledge into basic element of social wealth,
establishment of international business through
functioning of TNCs, introduction and dominance in
the daily practice of international relations and
political life of the peoples innovative and universal
liberal and democratic values etc.
5.
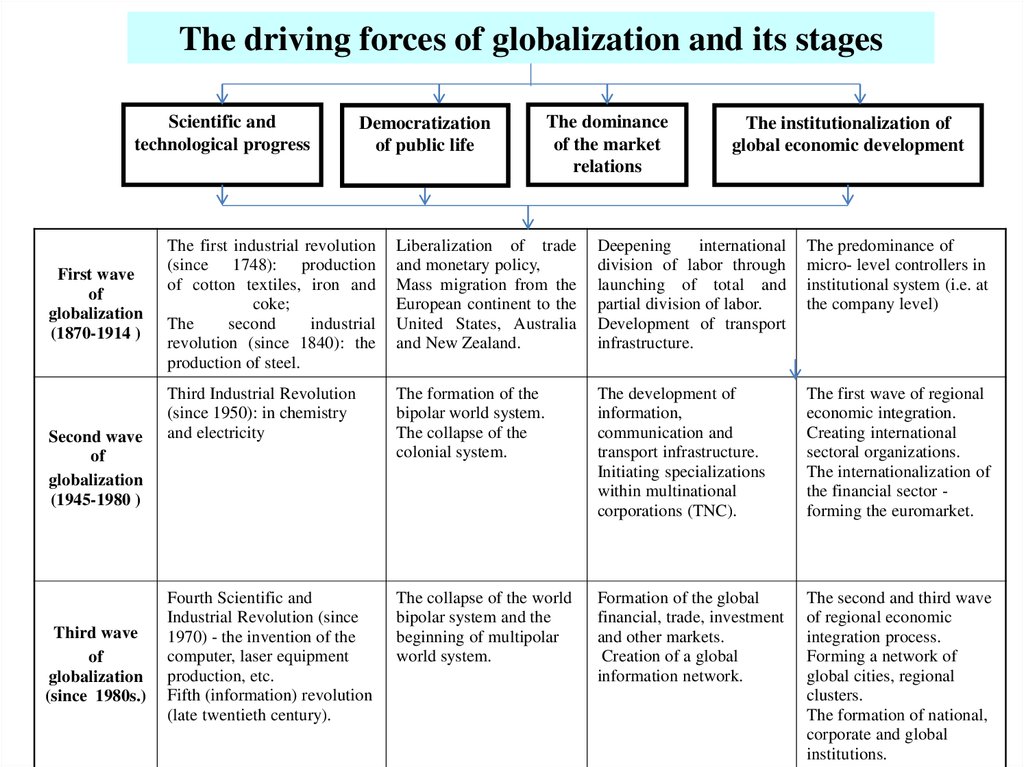
The driving forces of globalization and its stagesScientific and
technological progress
First wave
of
globalization
(1870-1914 )
Second wave
of
globalization
(1945-1980 )
Third wave
of
globalization
(since 1980s.)
Democratization
of public life
The dominance
of the market
relations
The institutionalization of
global economic development
The first industrial revolution
(since 1748): production
of cotton textiles, iron and
coke;
The
second
industrial
revolution (since 1840): the
production of steel.
Liberalization of trade
and monetary policy,
Mass migration from the
European continent to the
United States, Australia
and New Zealand.
Deepening
international
division of labor through
launching of total and
partial division of labor.
Development of transport
infrastructure.
The predominance of
micro- level controllers in
institutional system (i.e. at
the company level)
Third Industrial Revolution
(since 1950): in chemistry
and electricity
The formation of the
bipolar world system.
The collapse of the
colonial system.
The development of
information,
communication and
transport infrastructure.
Initiating specializations
within multinational
corporations (TNC).
The first wave of regional
economic integration.
Creating international
sectoral organizations.
The internationalization of
the financial sector forming the euromarket.
Fourth Scientific and
Industrial Revolution (since
1970) - the invention of the
computer, laser equipment
production, etc.
Fifth (information) revolution
(late twentieth century).
The collapse of the world
bipolar system and the
beginning of multipolar
world system.
Formation of the global
financial, trade, investment
and other markets.
Creation of a global
information network.
The second and third wave
of regional economic
integration process.
Forming a network of
global cities, regional
clusters.
The formation of national,
corporate and global
institutions.
6.
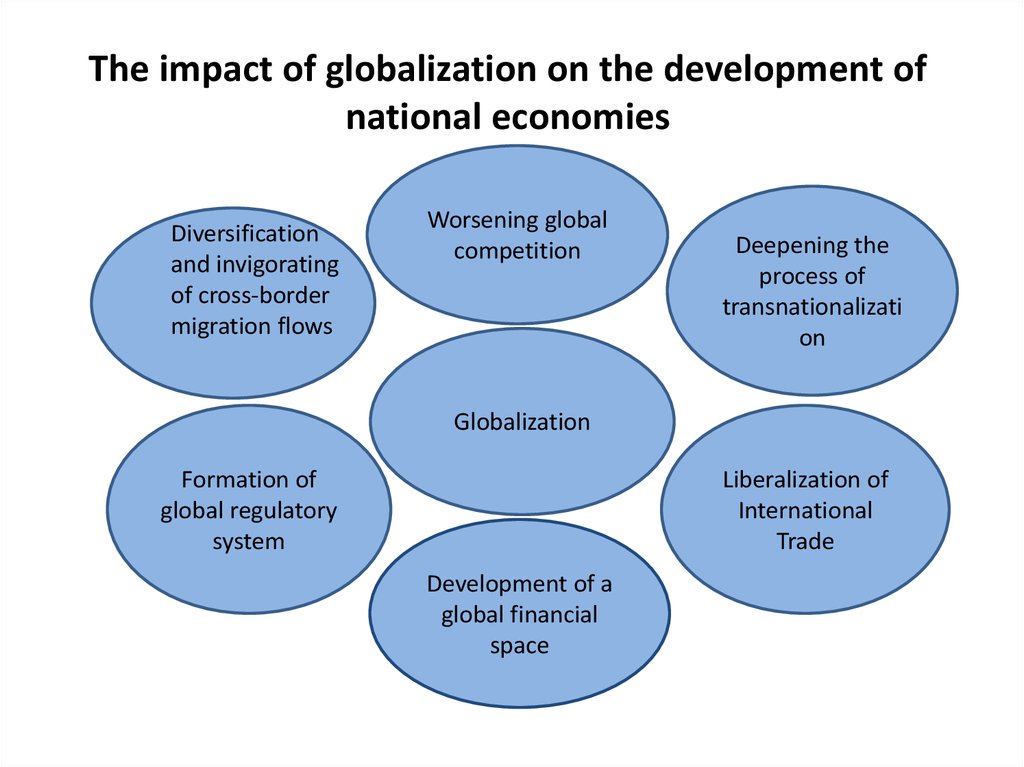
The impact of globalization on the development ofnational economies
Diversification
and invigorating
of cross-border
migration flows
Worsening global
competition
Deepening the
process of
transnationalizati
on
Globalization
Formation of
global regulatory
system
Liberalization of
International
Trade
Development of a
global financial
space
7.
Scholars separately defined economic, technological,political, cultural and social globalization:
• economic globalization - the institutionalization of the
opening of markets, liberalization of national economy
and international economic integration;
• technological globalization refers to the new
communications technology and the information
revolution;
• political globalization refers to the withering away of
the nation-state;
• cultural globalization refers to the present
homogenisation of culture;
• social globalization refers to the homogenisation of
today’s’ mode of life which is based on an individualist
and consumerist culture.
8.
The KOF Index of Globalization measures the threemain dimensions of globalization:
• economic globalization is characterized by
international economic integration, liberalization
of national economic policies that provide free
movement of goods, capital and services
throughout the world;
• social globalization expressed as the spread of
ideas, information, images and people
throughout the world;
• political globalization characterized by a
diffusion of government policies.
9. KOF Index of Globalization
Indices and VariablesEconomic Globalization
Actual Flows
Trade (percent of GDP)
Foreign Direct Investment, stocks (percent of GDP)
Portfolio Investment (percent of GDP)
Income Payments to Foreign Nationals (percent of GDP)
Restrictions
Hidden (приховані) Import Barriers
Mean Tariff Rate
Taxes on International Trade (percent of current revenue (доходи))
Taxes on International Trade (percent of current revenue)
Social Globalization
Data (дані) on Personal Contact
Telephone Traffic
Transfers (percent of GDP)
International Tourism
Foreign Population (percent of total population)
International letters (per capita)
Data on Information Flows
Internet Users (per 1000 people)
Television (per 1000 people)
Trade in Newspapers (percent of GDP
Data on Cultural Proximity
Political Globalization
Embassies in Country
Membership in International Organizations
Participation in U.N. Security Council Missions
International Treaties
Weights, %
36
50
22
29
22
27
50
22
28
27
23
38
33
26
2
26
20
25
36
36
37
28
31
26
25
28
22
25
10. List of most 10 globalized countries by the KOF Index in 2015
Country1
2
3
4
5
6
7
8
9
10
42
Ireland
Netherland
Belgium
Austria
Singapore
Sweden
Denmark
Portugal
Switzerland
Finland
Ukraine
Globalization
index
91.30
91.24
91.00
90.24
87.49
86.59
86.30
86.29
86.04
85.64
69.50
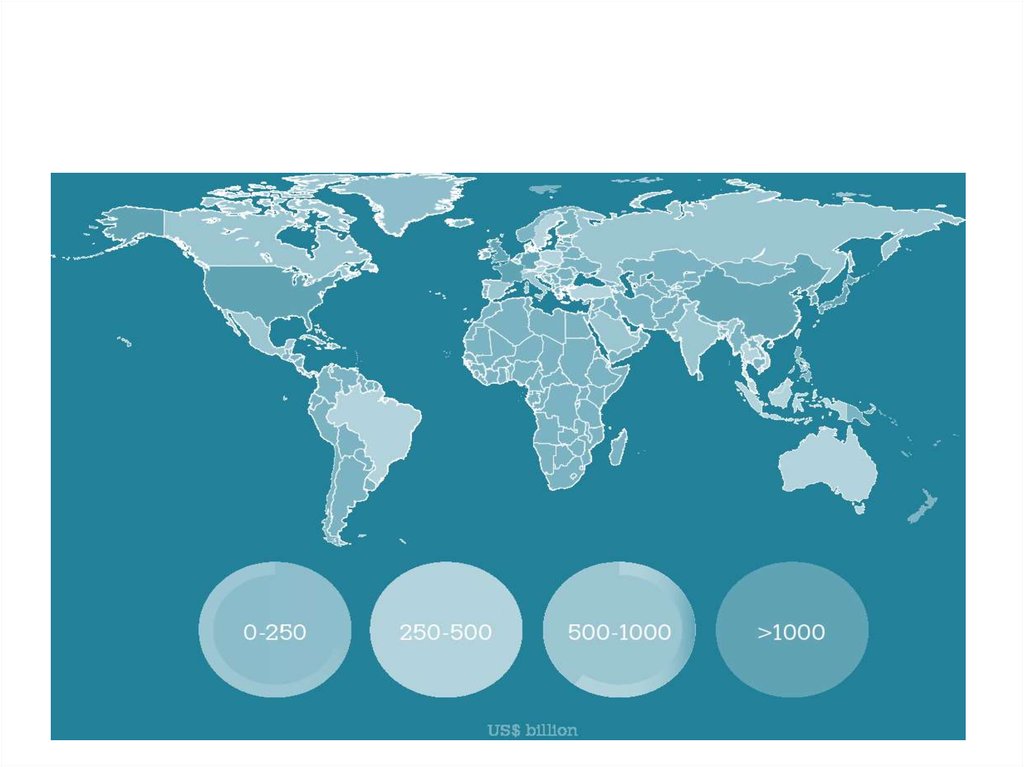
11. Economies by size of merchandise trade in 2013
12.
13. Ratio of trade in goods and commercial services to GDP, 1995-2014
14. China has become the world’s leading exporter
• China overtook Japan as the leading Asianexporter in 2004, three years after its accession to
the WTO. China surpassed the United States in
2007 and Germany in 2009 to become the world’s
leading exporter.
• The share of developing economies’ exports in
world trade increased from 26 percent in 1995 to
44 per cent in 2014 while the share of developed
economies’ exports decreased from 70 per cent to
52 per cent.
15. China, United States and Germany are top three merchandise traders
• China became the world’s biggest merchandise trader in 2013, withimports and exports totalling US$ 4,159 billion. It recorded a trade
surplus of US$ 259 billion, 2.8 per cent of its GDP.
• The United States is the second-biggest merchandise trader, with
imports and exports totalling US$ 3,909 billion in 2013.
The US trade deficit was US$ 750 billion (4.5 per cent of its GDP).
• Germany is in third place, with a trade surplus of US$ 264 billion in
2013, 7.3 per cent of its GDP.
• Japan ranks fourth, with merchandise trade totalling US$ 1,548
billion in 2013. It recorded a trade deficit of US$ 118 billion, 2.4 per
cent of its GDP.
16. Growth in the volume of world merchandise exports and production, 2005 - 2013
2005 - 2013World merchandise exports
3,5
Agricultural products
3,5
Fuels and mining products
1,5
Manufactures
4,0
World merchandise production
2,0
Agriculture
2,5
Mining
1,0
Manufacturing
2,5
World GDP
2,0
17. Growth in the volume of world merchandise trade by selected region and economy, 2005 - 2013
RegionExports
Imports
World
3,5
3,0
North America
3,5
1,5
Canada
0,0
2,0
Mexico
4,5
4,0
United States
4,5
0,5
South and Central America
1,5
8,0
Europe
2,0
1,0
European Union (28)
2,0
0,5
Norway
-1,5
3,0
Switzerland
2,5
1,5
Commonwealth of Independent States
2,5
7,5
Asia
6,5
5,5
Australia
3,5
4,5
China
11,0
10,0
India
10,5
11,0
Japan
2,0
1,0
18. World merchandise imports by region and selected economy
19481953
1963
1973
1983
1993
2003
2013
World, bln. dollars
62
85
164
594
1883
3800
7696
18409
World, %
100,0
100,0
100,0
100,0
100,0
100,0
100,0
100,0
North America
18,5
20,5
16,1
17,2
18,5
21,3
22,4
17,4
Canada
4,4
5,5
3,9
4,2
3,4
3,7
3,2
2,6
Mexico
1,0
0,9
0,8
0,6
0,7
1,8
2,3
2,1
United States
13,0
13,9
11,4
12,3
14,3
15,9
16,9
12,7
South and Central America
10,4
8,3
6,0
4,4
3,9
3,3
2,5
4,2
Brazil
1,8
1,6
0,9
1,2
0,9
0,7
0,7
1,4
Argentina
2,5
0,9
0,6
0,4
0,2
0,4
0,2
0,4
Europe
45,3
43,7
52,0
53,3
44,1
44,4
45,0
35,8
Germany
2,2
4,5
8,0
9,2
8,1
9,0
7,9
6,5
France
5,5
4,9
5,3
6,4
5,6
5,7
5,2
3,7
Italy
2,5
2,8
4,6
4,7
4,2
3,9
3,9
2,6
United Kingdom
13,4
11,0
8,5
6,5
5,3
5,5
5,2
3,6
USSR / Commonwealth of
Independent States
1,9
3,3
4,3
3,6
4,3
1,2
1,7
3,1
Africa
8,1
7,0
5,2
3,9
4,6
2,6
2,2
3,4
South Africa
2,5
1,5
1,1
0,9
0,8
0,5
0,5
0,7
Asia
13,9
15,1
14,1
14,9
18,5
23,6
23,5
31,8
Australia and New Zeland
2,9
2,3
2,2
1,6
1,4
1,5
1,4
1,5
China
0,6
1,6
0,9
0,9
1,1
2,7
5,4
10,6
India
2,3
1,4
1,5
0,5
0,7
0,6
0,9
2,5
Japan
1,1
2,8
4,1
6,5
6,7
6,4
5,0
4,5
19. World merchandise exports by region and selected economy
19481953
1963
1973
1983
1993
2003
2013
World, bln. dollrs
59
81
157
579
1838
3684
7380
18301
World, %
100,0
100,
100,0
100,0
100,0
100,0
100,0
100,0
North America
28,1
24,8
19,9
17,3
16,8
18,0
15,8
13,2
Canada
5,5
5,2
4,3
4,6
4,2
3,9
3,7
2,5
Mexico
0,9
0,7
0,6
0,4
1,4
1,4
2,2
2,1
United States
21,7
18,8
14,9
12,3
11,2
12,6
9,8
8,6
South and Central America
11,3
9,7
6,4
4,3
4,5
3,0
3,0
4,0
Brazil
2,0
1,8
0,9
1,1
1,2
1,0
1,0
1,3
Argentina
2,8
1,3
0,9
0,6
0,4
0,4
0,4
0,4
Europe
35,1
39,4
47,8
50,9
43,5
45,3
45,9
36,3
Germany
1,4
5,3
9,3
11,7
9,2
10,3
10,2
7,9
France
3,4
4,8
5,2
6,3
5,2
6,0
5,3
3,2
Italy
1,8
1,8
3,2
3,8
4,0
4,6
4,1
2,8
United Kingdom
11,3
9,0
7,8
5,1
5,0
4,9
4,1
3,0
USSR / Commonwealth of
Independent States
2,2
3,5
4,6
3,7
5,0
1,5
2,6
4,3
Africa
7,3
6,5
5,7
4,8
4,5
2,5
2,4
3,3
South Africa
2,0
1,6
1,5
1,0
1,0
0,7
0,5
0,5
Asia
14,0
13,4
12,5
14,9
19,1
26,0
26,1
31,5
Australia and New Zeland
3,7
3,2
2,4
2,1
1,4
1,4
1,2
1,6
China
0,9
1,2
1,3
1,0
1,2
2,5
5,9
12,1
India
2,2
1,3
1,0
0,5
0,5
0,6
0,8
1,7
Japan
0,4
1,5
3,5
6,4
8,0
9,8
6,4
3,9
20. Real GDP of leading countries and Ukraine in 2013
№1
2
3
4
5
6
7
8
9
10
38
Country
GDP,
bln. dollars. USA
USA
China
India
Japan
Russian Federation
Germany
Brazil
15684
United Kingdom
France
Italy
Ukraine
2254
12674
4793
4490
3380
3307
2309
2217
1829
338
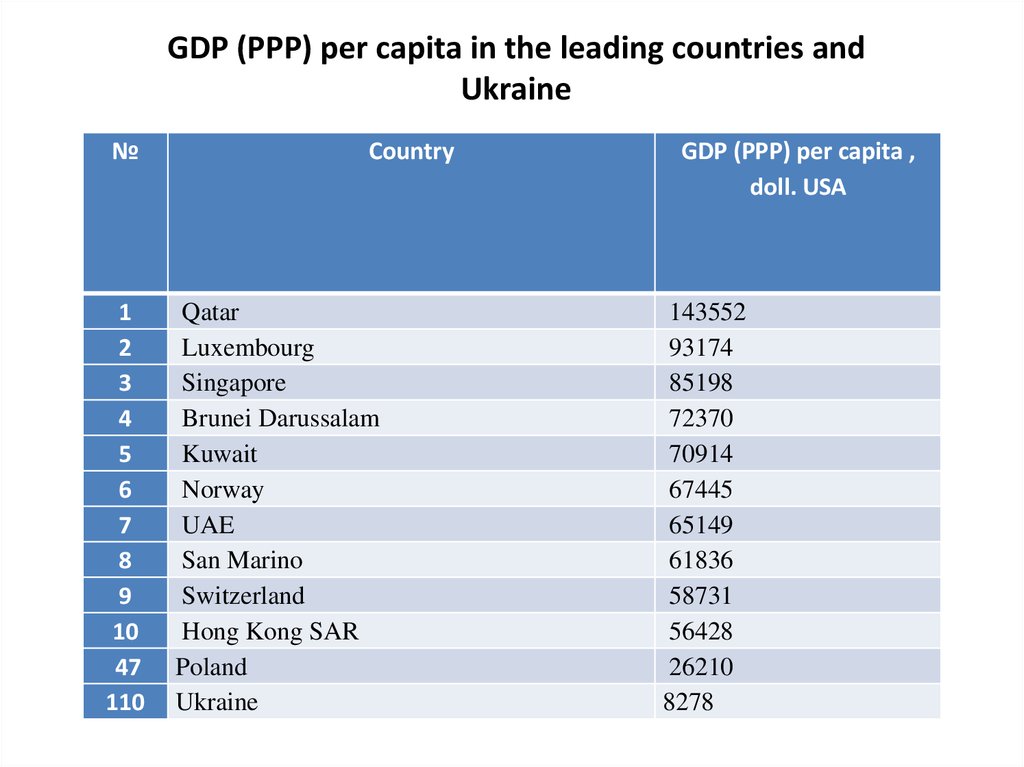
21.
GDP (PPP) per capita in the leading countries andUkraine
№
1
2
3
4
5
6
7
8
9
10
47
110
Country
Qatar
Luxembourg
Singapore
Brunei Darussalam
Kuwait
Norway
UAE
San Marino
Switzerland
Hong Kong SAR
Poland
Ukraine
GDP (PPP) per capita ,
doll. USA
143552
93174
85198
72370
70914
67445
65149
61836
58731
56428
26210
8278
22. Structure of world GDP by region of the world
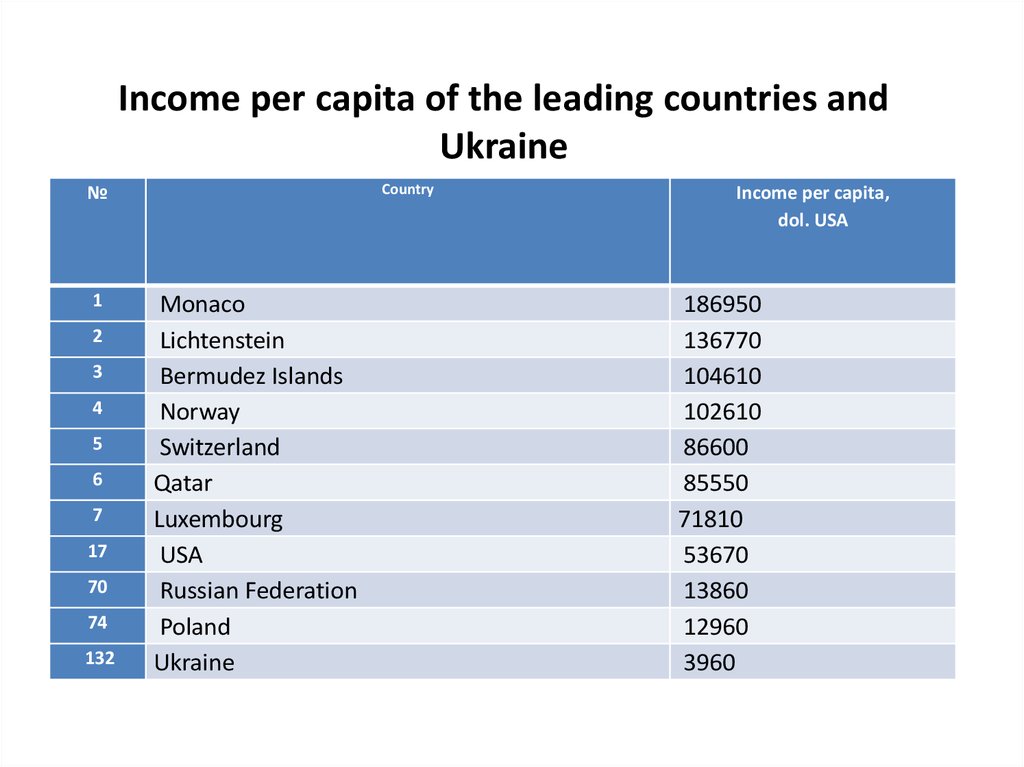
23.
Income per capita of the leading countries andUkraine
Country
№
1
2
3
4
5
6
7
17
70
74
132
Monaco
Lichtenstein
Bermudez Islands
Norway
Switzerland
Qatar
Luxembourg
USA
Russian Federation
Poland
Ukraine
Income per capita,
dol. USA
186950
136770
104610
102610
86600
85550
71810
53670
13860
12960
3960
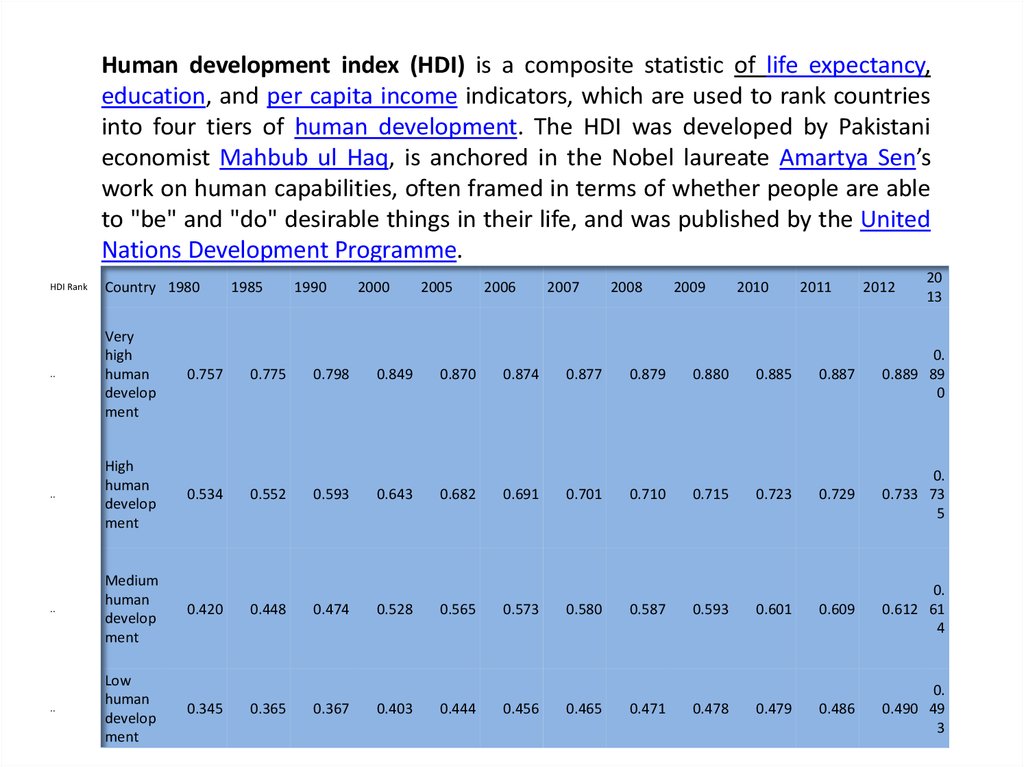
24.
Human development index (HDI) is a composite statistic of life expectancy,education, and per capita income indicators, which are used to rank countries
into four tiers of human development. The HDI was developed by Pakistani
economist Mahbub ul Haq, is anchored in the Nobel laureate Amartya Sen’s
work on human capabilities, often framed in terms of whether people are able
to "be" and "do" desirable things in their life, and was published by the United
Nations Development Programme.
1985
1990
2000
2005
2006
2007
2008
2009
2010
2011
2012
20
13
HDI Rank
Country 1980
..
Very
high
human
develop
ment
0.757
0.775
0.798
0.849
0.870
0.874
0.877
0.879
0.880
0.885
0.887
0.
0.889 89
0
..
High
human
develop
ment
0.534
0.552
0.593
0.643
0.682
0.691
0.701
0.710
0.715
0.723
0.729
0.
0.733 73
5
..
Medium
human
develop
ment
0.420
0.448
0.474
0.528
0.565
0.573
0.580
0.587
0.593
0.601
0.609
0.
0.612 61
4
..
Low
human
develop
ment
0.345
0.365
0.367
0.403
0.444
0.456
0.465
0.471
0.478
0.479
0.486
0.
0.490 49
3
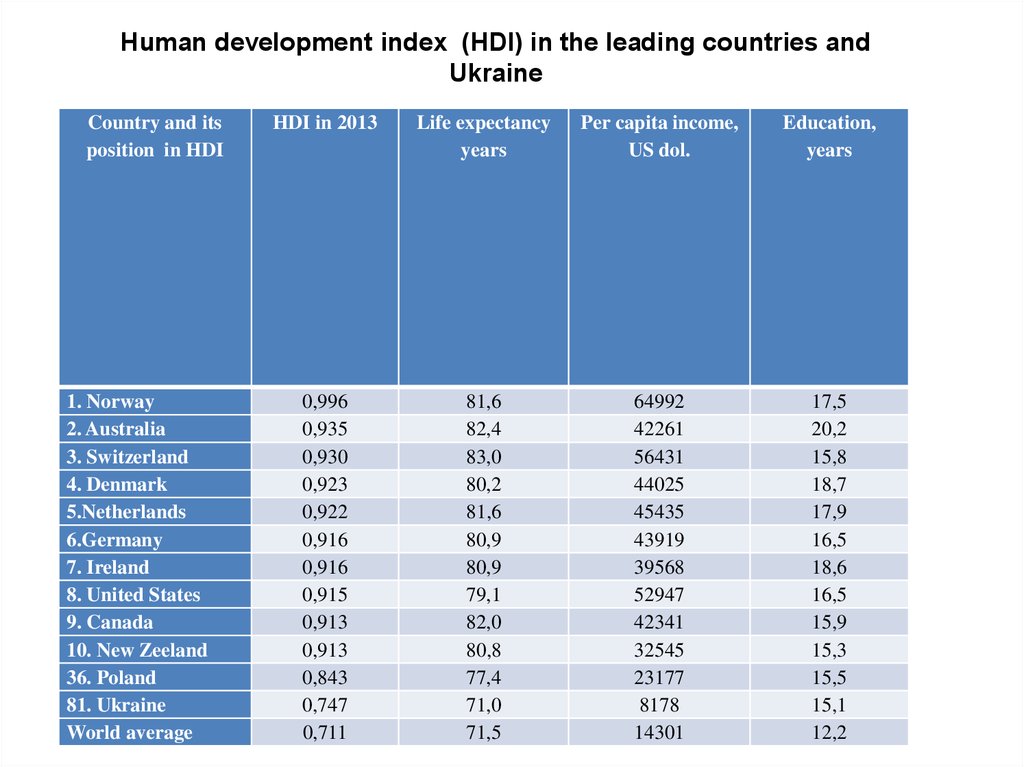
25.
Human development index (HDI) in the leading countries andUkraine
Country and its
position in HDI
1. Norway
2. Australia
3. Switzerland
4. Denmark
5.Netherlands
6.Germany
7. Ireland
8. United States
9. Canada
10. New Zeeland
36. Poland
81. Ukraine
World average
HDI in 2013
Life expectancy
years
Per capita income,
US dol.
Education,
years
0,996
0,935
0,930
0,923
0,922
0,916
0,916
0,915
0,913
0,913
0,843
0,747
0,711
81,6
82,4
83,0
80,2
81,6
80,9
80,9
79,1
82,0
80,8
77,4
71,0
71,5
64992
42261
56431
44025
45435
43919
39568
52947
42341
32545
23177
8178
14301
17,5
20,2
15,8
18,7
17,9
16,5
18,6
16,5
15,9
15,3
15,5
15,1
12,2
26.
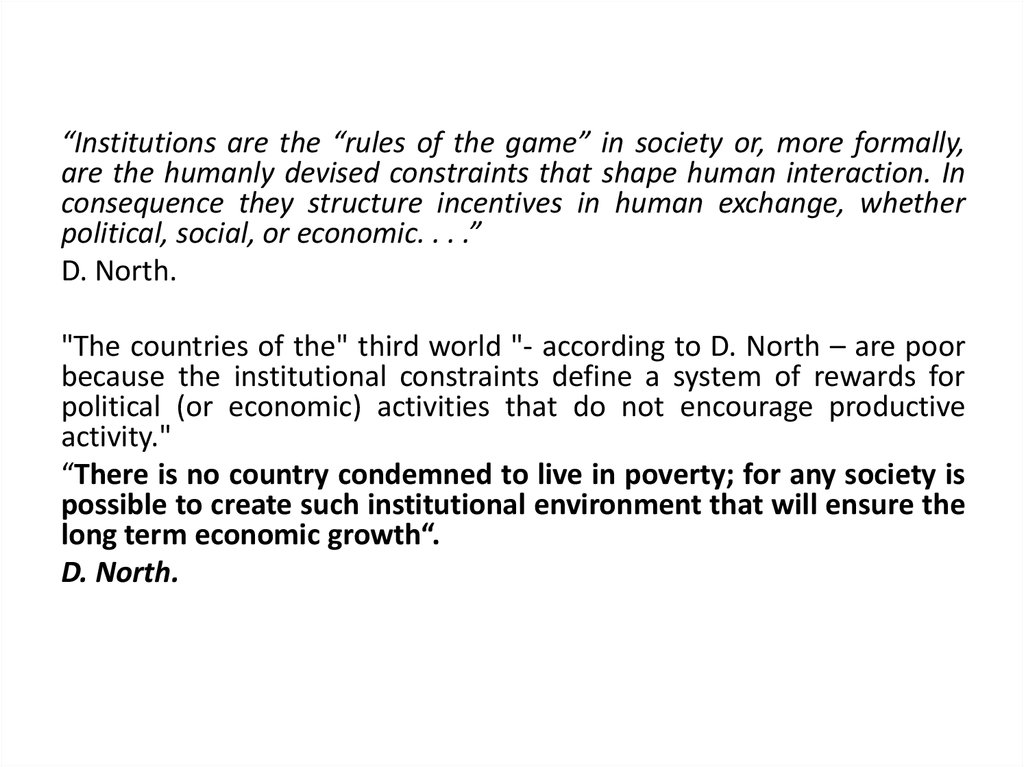
“Institutions are the “rules of the game” in society or, more formally,are the humanly devised constraints that shape human interaction. In
consequence they structure incentives in human exchange, whether
political, social, or economic. . . .”
D. North.
"The countries of the" third world "- according to D. North – are poor
because the institutional constraints define a system of rewards for
political (or economic) activities that do not encourage productive
activity."
“There is no country condemned to live in poverty; for any society is
possible to create such institutional environment that will ensure the
long term economic growth“.
D. North.
27.
Ukraine in global competitiveness index, 2015-2016Global Competitiveness Index 1-7 (best)
79
4.0
Subindex A: Basic requirements 1-7 (best)
101
4.1
130
3.1
69
4.1
3rd pillar: Macroeconomic environment 1-7 (best)
134
3.1
4th pillar: Health and primary education 1-7 (best)
45
6.1
65
4.1
34
5.0
6th pillar: Goods market efficiency 1-7 (best)
106
4.0
7th pillar: Labor market efficiency 1-7 (best)
56
4.3
121
3.2
9th pillar: Technological readiness 1-7 (best)
86
3.4
10th pillar: Market size 1-7 (best)
45
4.5
72
3.6
11th pillar: Business sophistication 1-7 (best)
91
3.7
12th pillar: Innovation 1-7 (best)
54
3.4
1st pillar: Institutions 1-7 (best)
2nd pillar: Infrastructure 1-7 (best)
Subindex B: Efficiency enhancers 1-7 (best)
5th pillar: Higher education and training 1-7 (best)
8th pillar: Financial market development 1-7 (best)
Subindex C: Innovation and sophistication factors 1-7 (best)
28. Сurrent global economic problems
1. Trade protectionism in advanced countries in a rapidly globalizingworld.
2. Excessive fluctuations and misalignment in exchange rates and
financial crises.
3. Structural imbalances in the United States, slow growth in Europe and
Japan, and insufficient restructuring in transition economies/
4. Deep poverty in many developing countries.
5. Resource scarcity, environmental degradation, climate change and
sustainable development.
29.
International economic integration is a processwhere the economic barriers between two or
more economies are eliminated
30.
Forms of international economic integrationForms and Levels
of international
economic
integration
Lower tariffs
for
movements of
goods and
services
within
the area
Preferential
Trade Area
Free Trade Area
Customs Union
Common
Market
Economic Union
+
The barriers
and quotas to
mutual trade
are
removed
The
implementation
of common
external tariff
from outside
the Union
Establishment
of free
movement of
labor, capital,
services and
individuals
+
+
+
+
+
+
+
+
+
+
+
+
+
Harmonization
and unification
of economic
and social
policy
+
31.
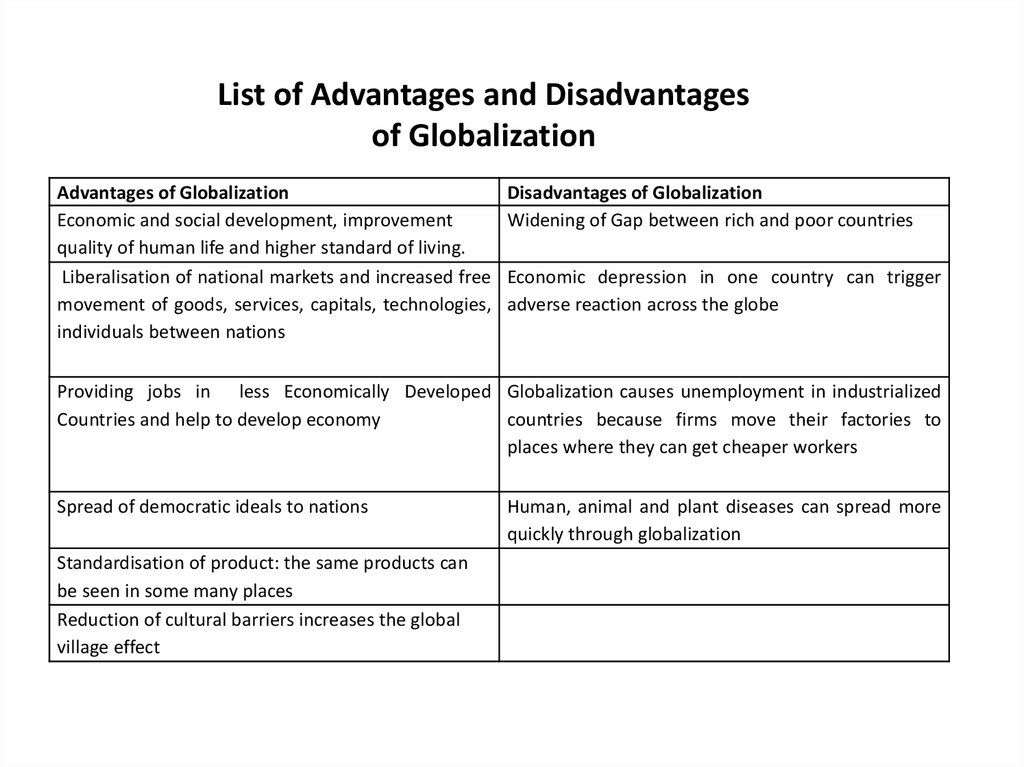
List of Advantages and Disadvantagesof Globalization
Advantages of Globalization
Economic and social development, improvement
quality of human life and higher standard of living.
Liberalisation of national markets and increased free
movement of goods, services, capitals, technologies,
individuals between nations
Disadvantages of Globalization
Widening of Gap between rich and poor countries
Economic depression in one country can trigger
adverse reaction across the globe
Providing jobs in less Economically Developed Globalization causes unemployment in industrialized
Countries and help to develop economy
countries because firms move their factories to
places where they can get cheaper workers
Spread of democratic ideals to nations
Standardisation of product: the same products can
be seen in some many places
Reduction of cultural barriers increases the global
village effect
Human, animal and plant diseases can spread more
quickly through globalization