


 economics
Similar presentations:


First Simple world economy indicators
1.
Our previous lecture and practice:2.
3.
4.
Todays lecture:5.
And what for?Тимофеева А.А. 2020 ©
About description
5
6.
Worldeconomy
main
preliminary
indicators
Тимофеева А.А. 2020 ©
6
7.
1.PopulationConnected
indicators (and
tools)
Тимофеева А.А. 2020 ©
7
8.
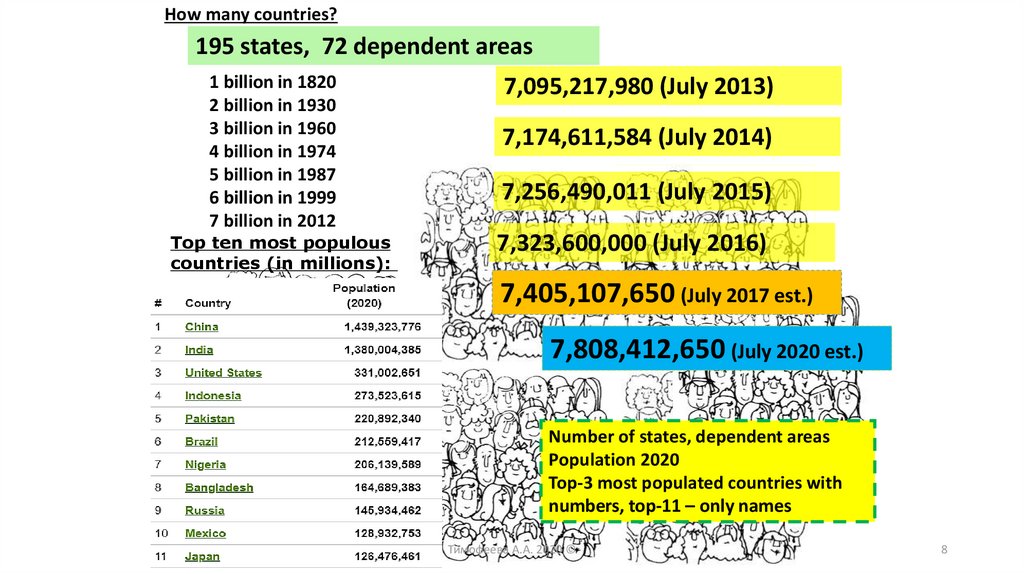
How many countries?195 states, 72 dependent areas
1 billion in 1820
2 billion in 1930
3 billion in 1960
4 billion in 1974
5 billion in 1987
6 billion in 1999
7 billion in 2012
Top ten most populous
countries (in millions):
7,095,217,980 (July 2013)
7,174,611,584 (July 2014)
7,256,490,011 (July 2015)
7,323,600,000 (July 2016)
7,405,107,650 (July 2017 est.)
7,808,412,650 (July 2020 est.)
Number of states, dependent areas
Population 2020
Top-3 most populated countries with
numbers, top-11 – only names
Тимофеева А.А. 2020 ©
8
9.
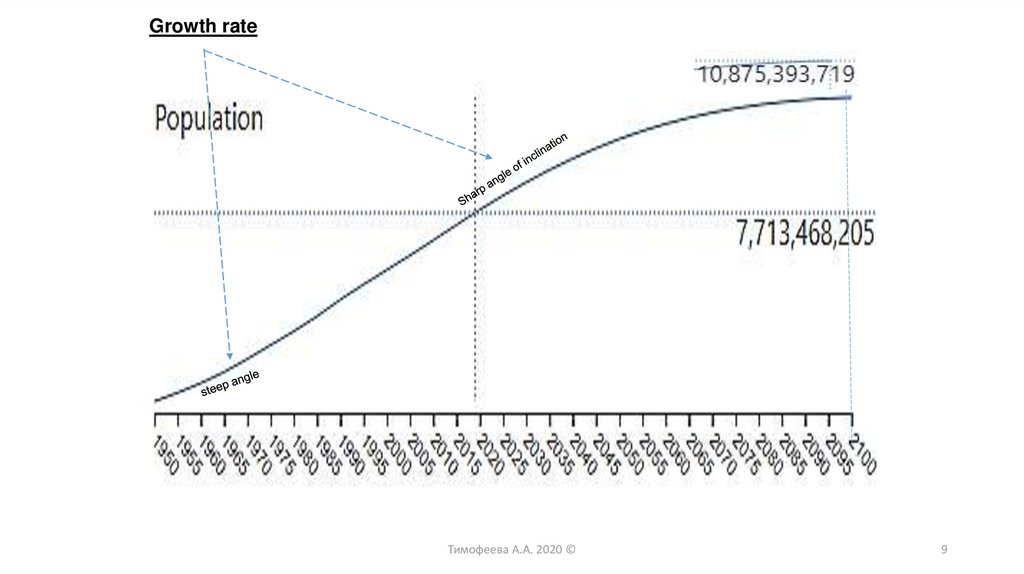
Growth rateТимофеева А.А. 2020 ©
9
10.
Age structureAge structure 2016 :
0-14 years: 25%
15-24 years: 16.8%
25-54 years: 40.6%
55-64 years: 8.4%
65 years and over: 8.3%
Age structure 2020 :
0-14 years: 25.33%
15-24 years: 15.42%
25-54 years: 40.67%
55-64 years: 9.09%
65 years and over: 9.49%
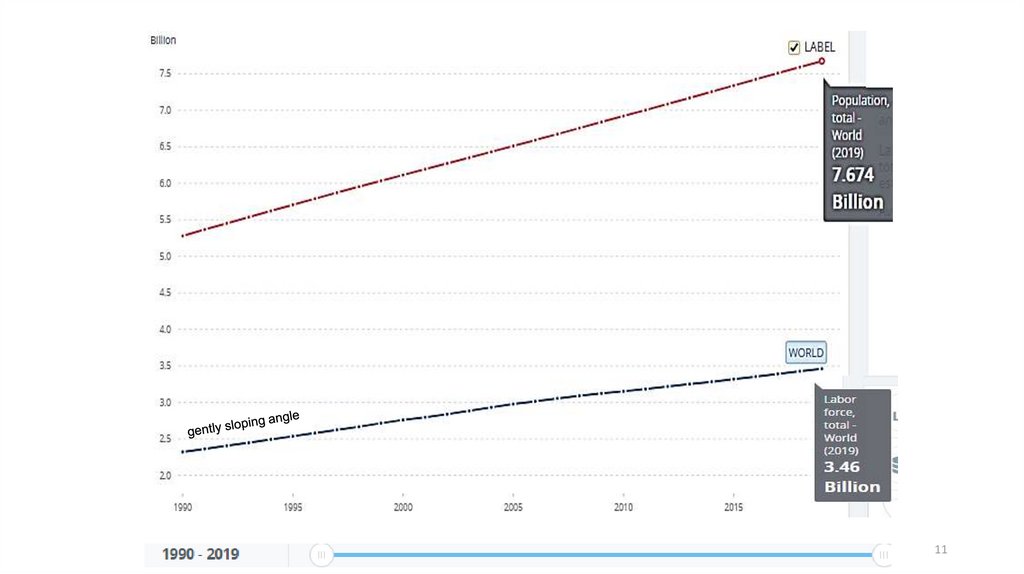
Labor force:
3,49 billion (2019)
3,36 billion (2014)
3.308 billion (2013)
3.297 billion (2012)
Тимофеева А.А. 2020 ©
10
11.
Тимофеева А.А. 2020 ©11
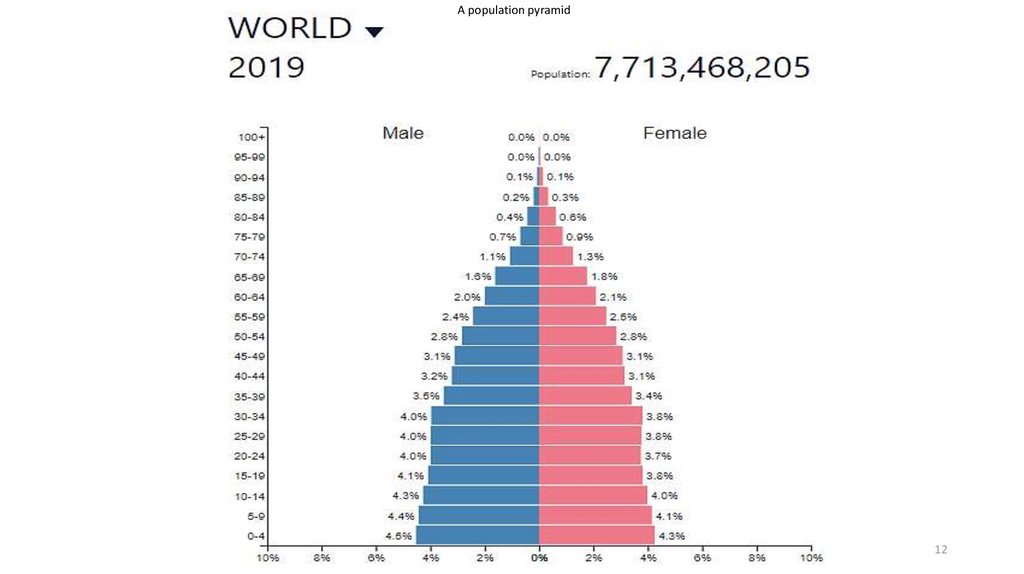
12.
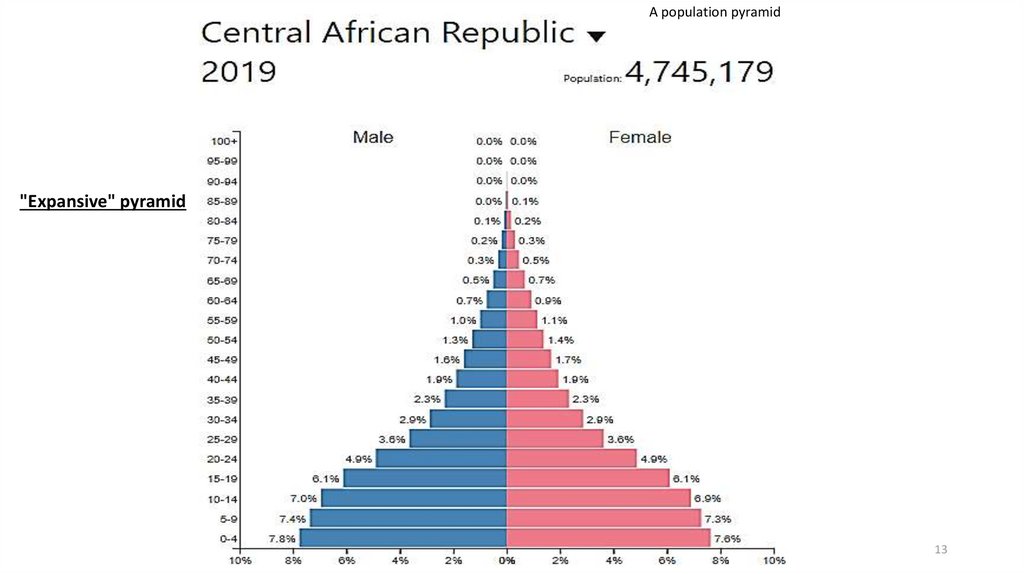
A population pyramidТимофеева А.А. 2020 ©
12
13.
A population pyramid"Expansive" pyramid
Тимофеева А.А. 2020 ©
13
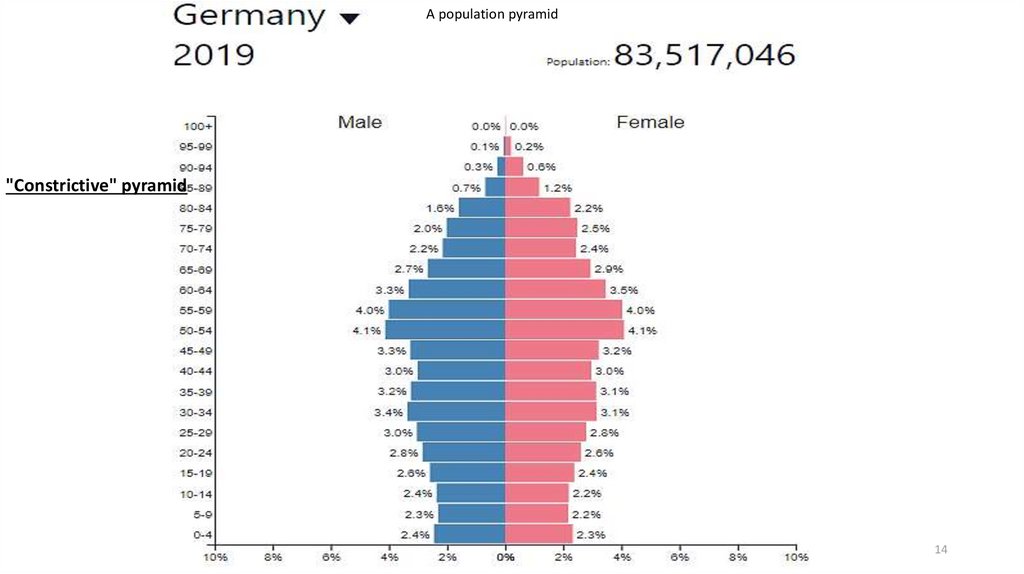
14.
A population pyramid"Constrictive" pyramid
Тимофеева А.А. 2020 ©
14
15.
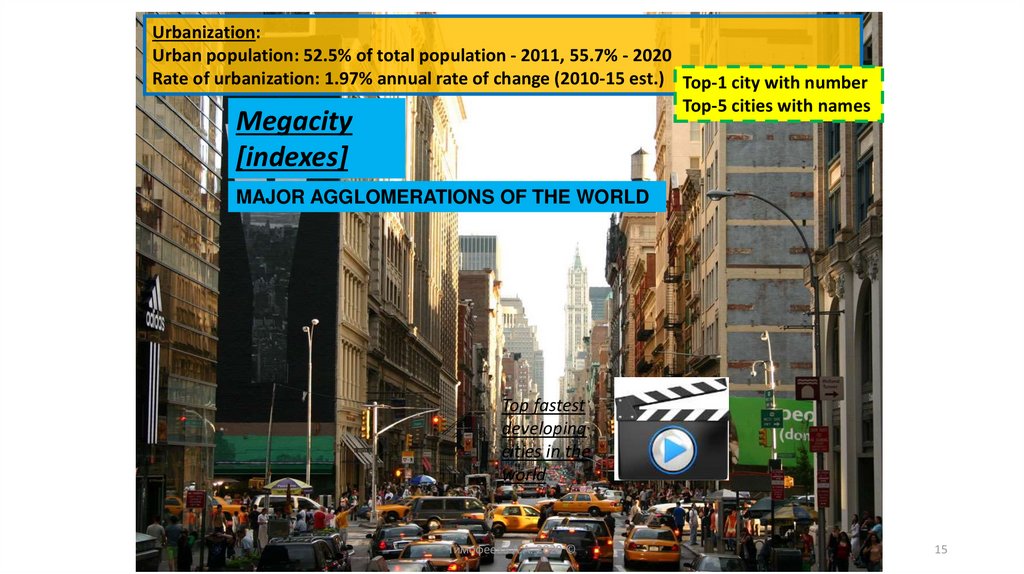
Urbanization:Urban population: 52.5% of total population - 2011, 55.7% - 2020
Rate of urbanization: 1.97% annual rate of change (2010-15 est.) Top-1 city with number
Top-5 cities with names
Megacity
[indexes]
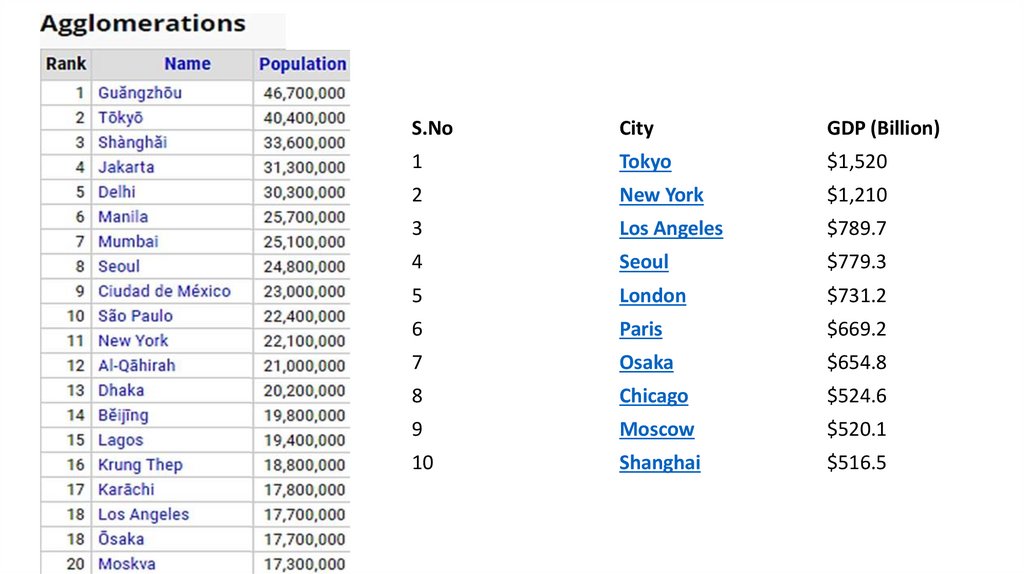
MAJOR AGGLOMERATIONS OF THE WORLD
Top fastest
developing
cities in the
world
Тимофеева А.А. 2020 ©
15
16.
URBAN POPULATION (% OF TOTAL POPULATION)Тимофеева А.А. 2020 ©
16
17.
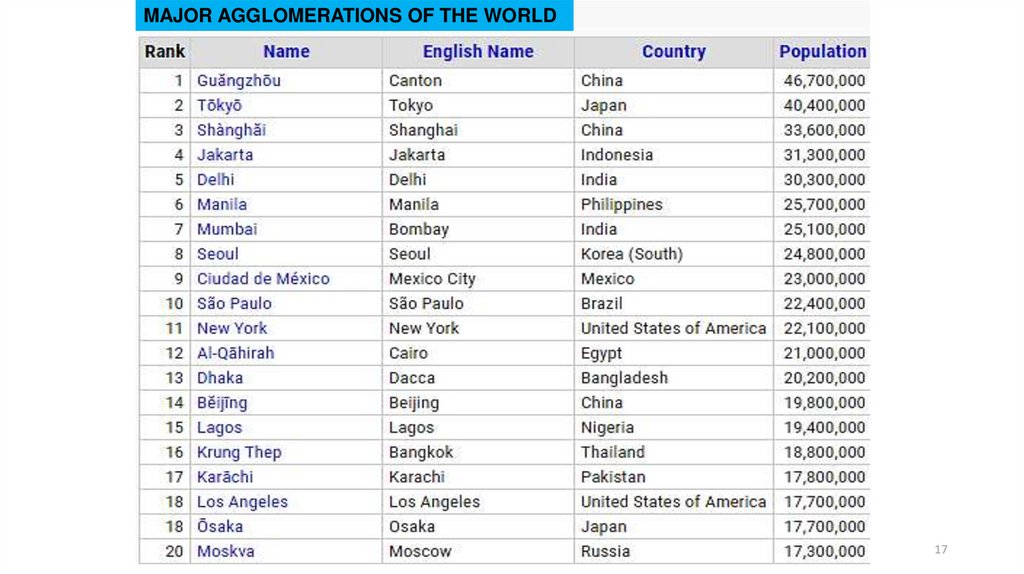
MAJOR AGGLOMERATIONS OF THE WORLDТимофеева А.А. 2020 ©
17
18.
2.ProductionConnected
indicators
Тимофеева А.А. 2020 ©
18
19.
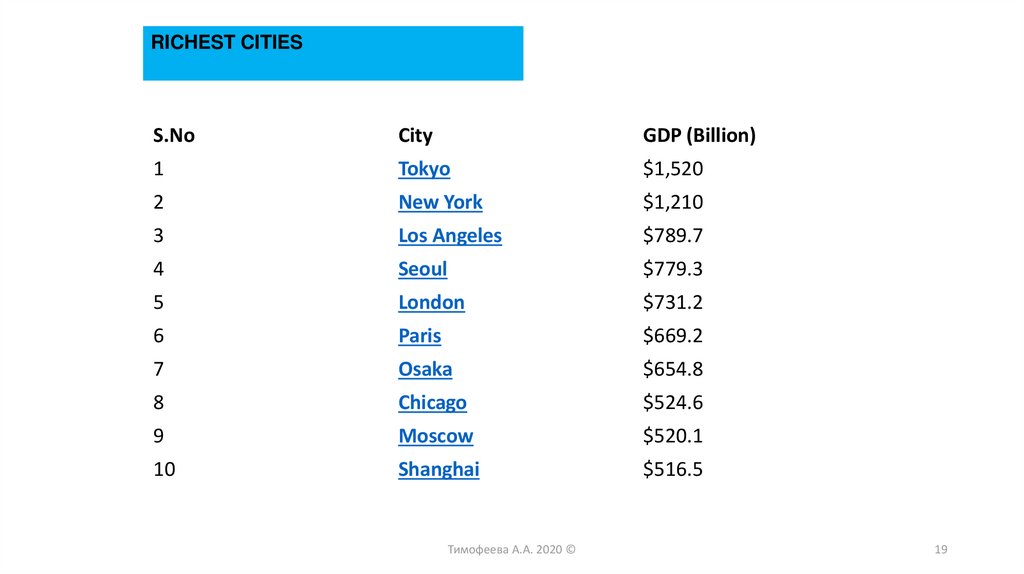
RICHEST CITIESS.No
City
GDP (Billion)
1
Tokyo
$1,520
2
New York
$1,210
3
Los Angeles
$789.7
4
Seoul
$779.3
5
London
$731.2
6
Paris
$669.2
7
Osaka
$654.8
8
Chicago
$524.6
9
Moscow
$520.1
10
Shanghai
$516.5
Тимофеева А.А. 2020 ©
19
20.
S.NoCity
GDP (Billion)
1
Tokyo
$1,520
2
New York
$1,210
3
Los Angeles
$789.7
4
Seoul
$779.3
5
London
$731.2
6
Paris
$669.2
7
Osaka
$654.8
8
Chicago
$524.6
9
Moscow
$520.1
10
Shanghai
$516.5
21.
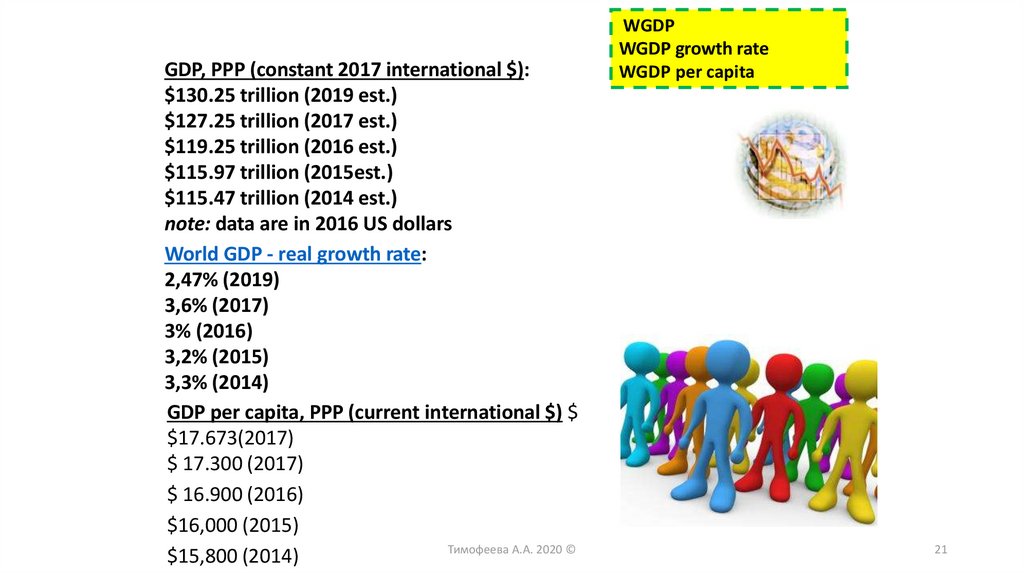
GDP, PPP (constant 2017 international $):$130.25 trillion (2019 est.)
$127.25 trillion (2017 est.)
$119.25 trillion (2016 est.)
$115.97 trillion (2015est.)
$115.47 trillion (2014 est.)
note: data are in 2016 US dollars
World GDP - real growth rate:
2,47% (2019)
3,6% (2017)
3% (2016)
3,2% (2015)
3,3% (2014)
GDP per capita, PPP (current international $) $
$17.673(2017)
$ 17.300 (2017)
$ 16.900 (2016)
$16,000 (2015)
Тимофеева А.А. 2020 ©
$15,800 (2014)
WGDP
WGDP growth rate
WGDP per capita
21
22.
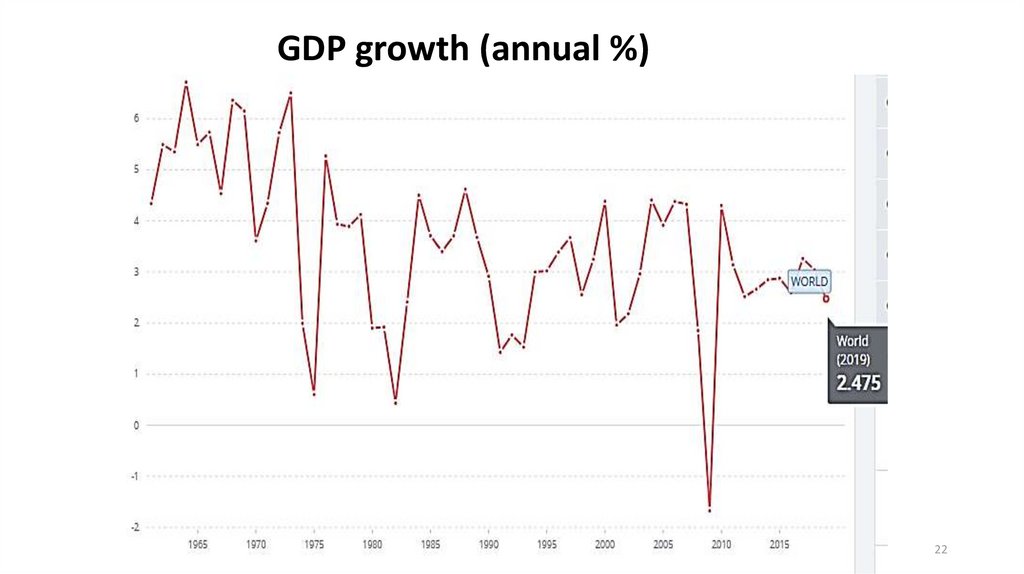
GDP growth (annual %)Тимофеева А.А. 2020 ©
22
23.
GDP - composition by sector:Agriculture: 6%
Industry: 31%
Services: 63% (2017 est.)
GDP - composition by
sector
Тимофеева А.А. 2020 ©
23
24.
3.Internationaleconomic
relations ind.
Тимофеева А.А. 2020 ©
24
25.
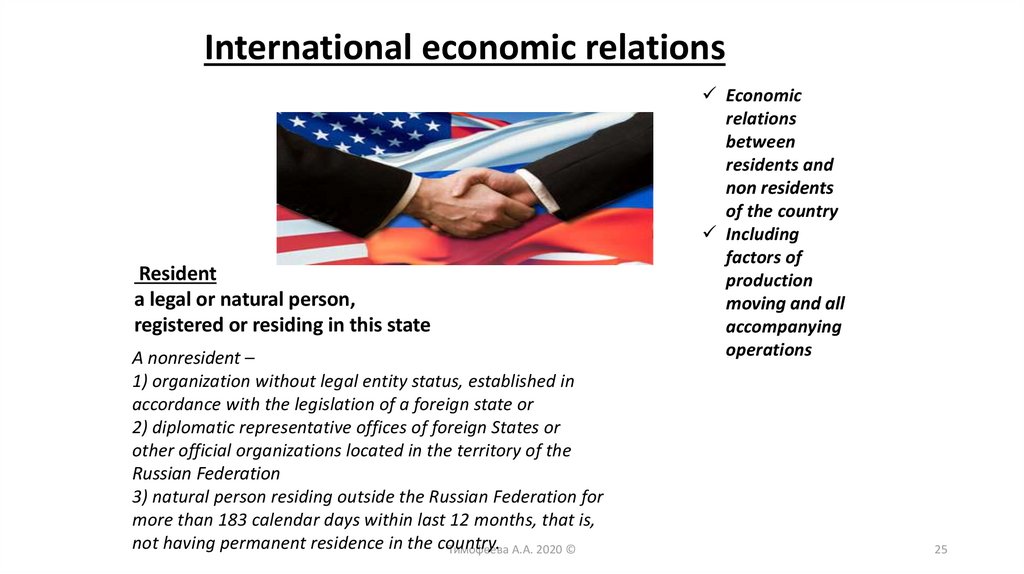
International economic relationsResident
a legal or natural person,
registered or residing in this state
A nonresident –
1) organization without legal entity status, established in
accordance with the legislation of a foreign state or
2) diplomatic representative offices of foreign States or
other official organizations located in the territory of the
Russian Federation
3) natural person residing outside the Russian Federation for
more than 183 calendar days within last 12 months, that is,
not having permanent residence in the country.
Тимофеева А.А. 2020 ©
Economic
relations
between
residents and
non residents
of the country
Including
factors of
production
moving and all
accompanying
operations
25
26.
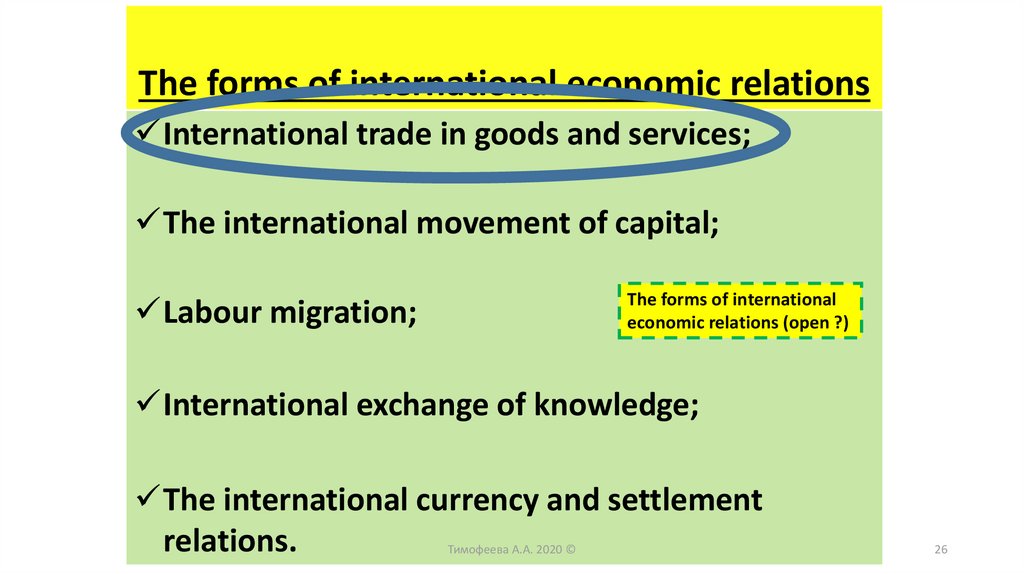
The forms of international economic relationsInternational trade in goods and services;
The international movement of capital;
The forms of international
economic relations (open ?)
Labour migration;
International exchange of knowledge;
The international currency and settlement
relations.
Тимофеева А.А. 2020 ©
26
27.
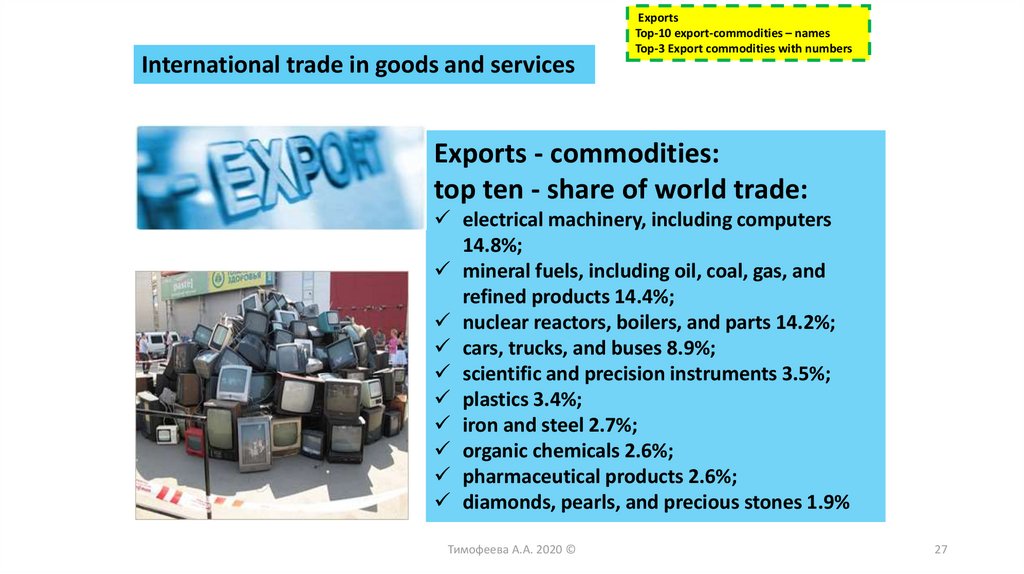
International trade in goods and servicesExports
Top-10 export-commodities – names
Top-3 Export commodities with numbers
Exports - commodities:
top ten - share of world trade:
electrical machinery, including computers
14.8%;
mineral fuels, including oil, coal, gas, and
refined products 14.4%;
nuclear reactors, boilers, and parts 14.2%;
cars, trucks, and buses 8.9%;
scientific and precision instruments 3.5%;
plastics 3.4%;
iron and steel 2.7%;
organic chemicals 2.6%;
pharmaceutical products 2.6%;
diamonds, pearls, and precious stones 1.9%
Тимофеева А.А. 2020 ©
27
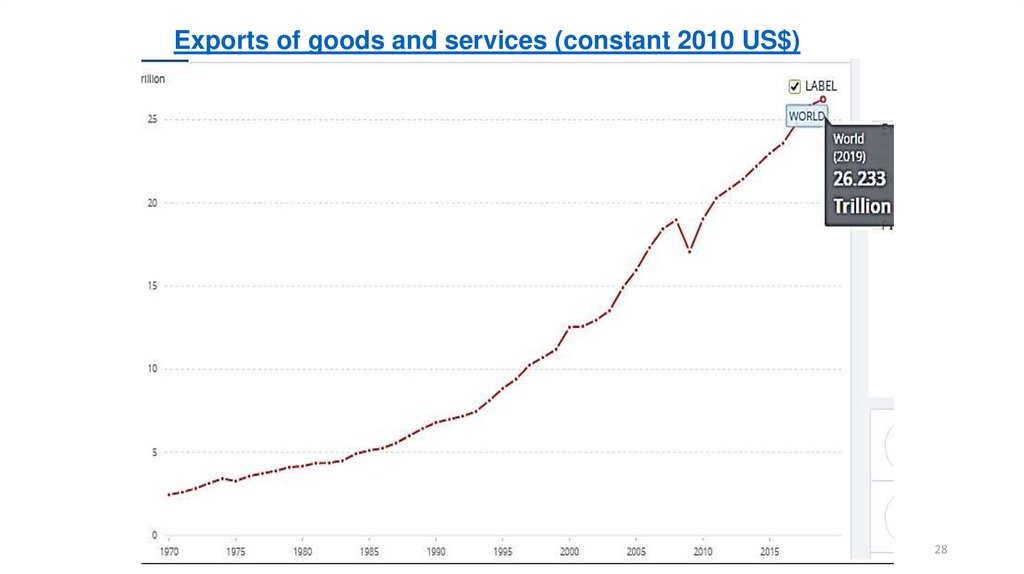
28.
Exports of goods and services (constant 2010 US$)Тимофеева А.А. 2020 ©
28
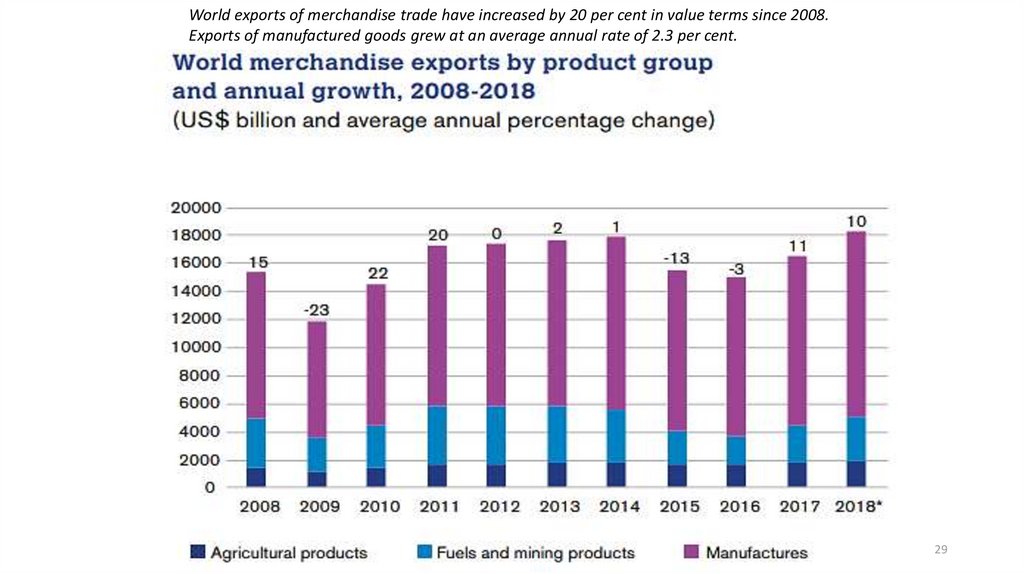
29.
World exports of merchandise trade have increased by 20 per cent in value terms since 2008.Exports of manufactured goods grew at an average annual rate of 2.3 per cent.
Тимофеева А.А. 2020 ©
29
30.
World exports of commercial services have increased by 46 per cent in value terms since 2008and services exports grew by an average annual rate of 3.9 per cent.
Тимофеева А.А. 2020 ©
30
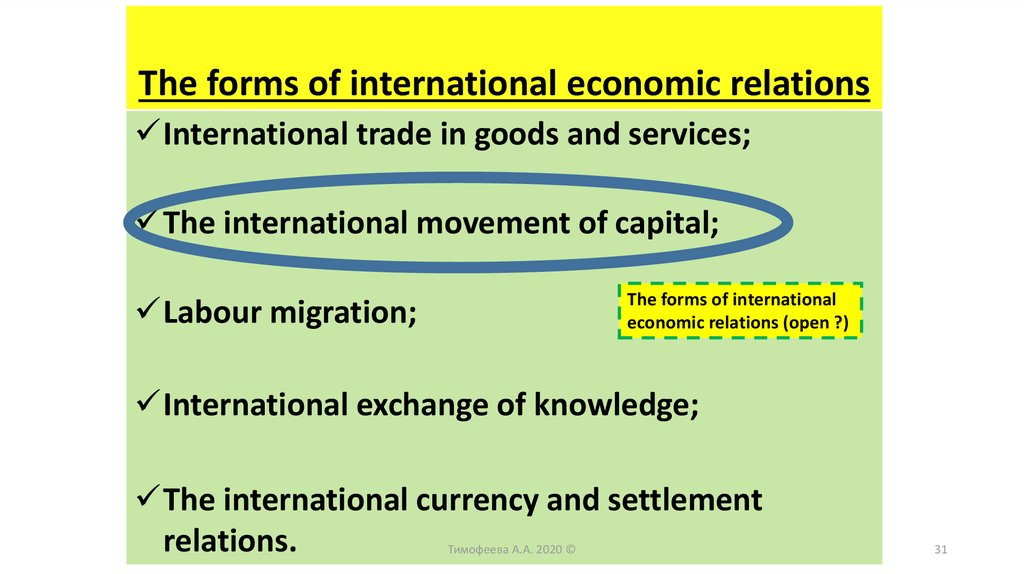
31.
The forms of international economic relationsInternational trade in goods and services;
The international movement of capital;
The forms of international
economic relations (open ?)
Labour migration;
International exchange of knowledge;
The international currency and settlement
relations.
Тимофеева А.А. 2020 ©
31
32.
See the nextpresentation
#3
Тимофеева А.А. 2020 ©
32