


 physics
Similar presentations:
")


Rectilinear kinematics: erratic motion
1.
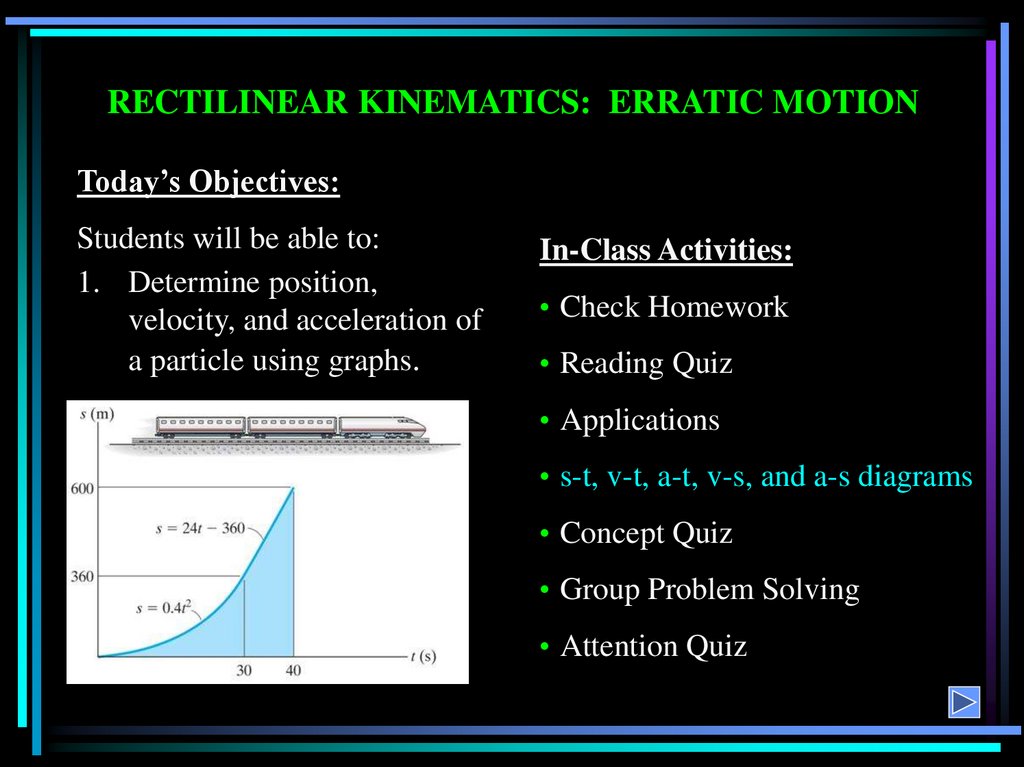
RECTILINEAR KINEMATICS: ERRATIC MOTIONToday’s Objectives:
Students will be able to:
1. Determine position,
velocity, and acceleration of
a particle using graphs.
In-Class Activities:
• Check Homework
• Reading Quiz
• Applications
• s-t, v-t, a-t, v-s, and a-s diagrams
• Concept Quiz
• Group Problem Solving
• Attention Quiz
2.
READING QUIZ1. The slope of a v-t graph at any instant represents instantaneous
A) velocity.
B) acceleration.
C) position.
D) jerk.
2. Displacement of a particle in a given time interval equals the
area under the ___ graph during that time.
A) a-t
B) a-s
C) v-t
C) s-t
3.
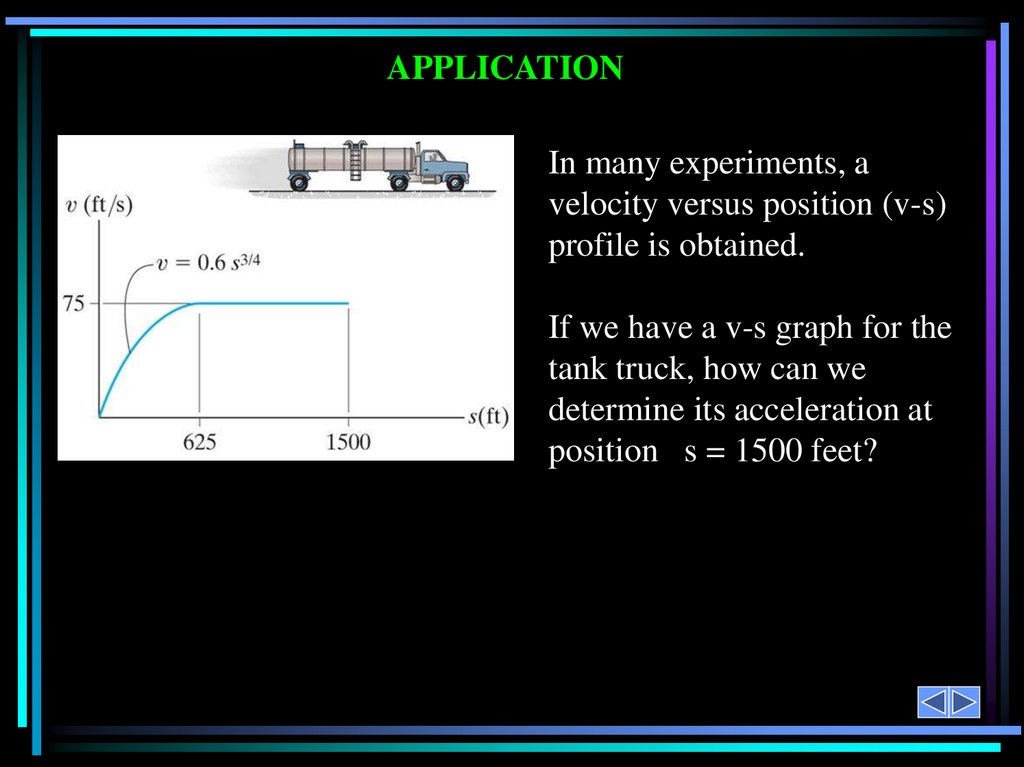
APPLICATIONIn many experiments, a
velocity versus position (v-s)
profile is obtained.
If we have a v-s graph for the
tank truck, how can we
determine its acceleration at
position s = 1500 feet?
4.
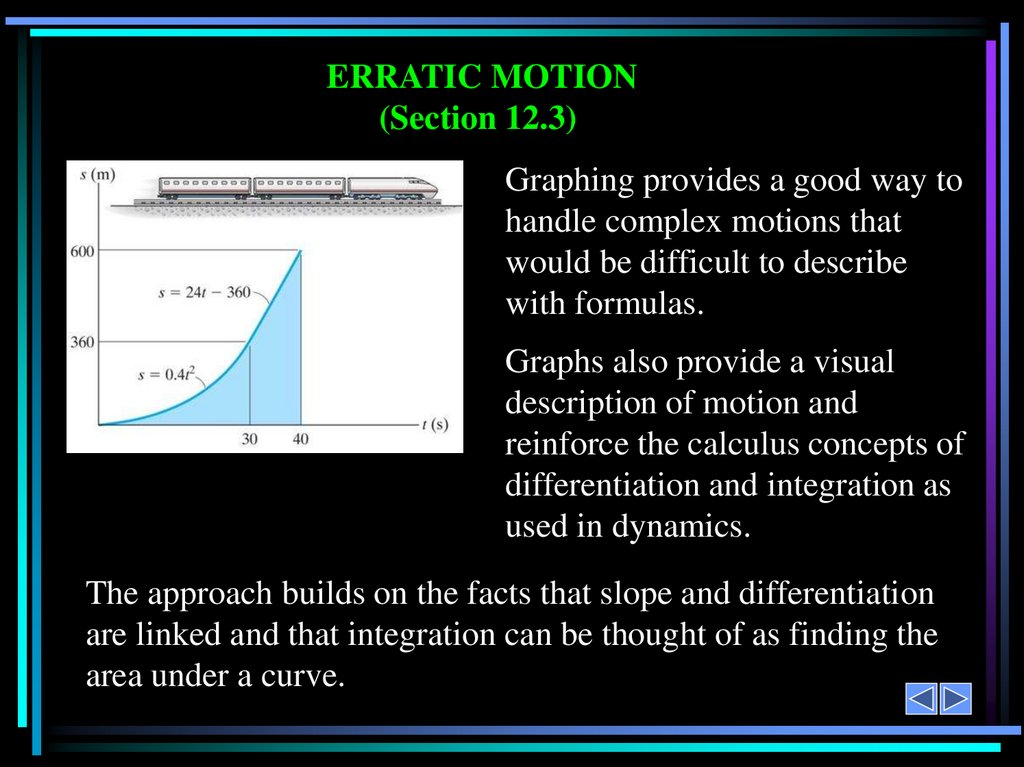
ERRATIC MOTION(Section 12.3)
Graphing provides a good way to
handle complex motions that
would be difficult to describe
with formulas.
Graphs also provide a visual
description of motion and
reinforce the calculus concepts of
differentiation and integration as
used in dynamics.
The approach builds on the facts that slope and differentiation
are linked and that integration can be thought of as finding the
area under a curve.
5.
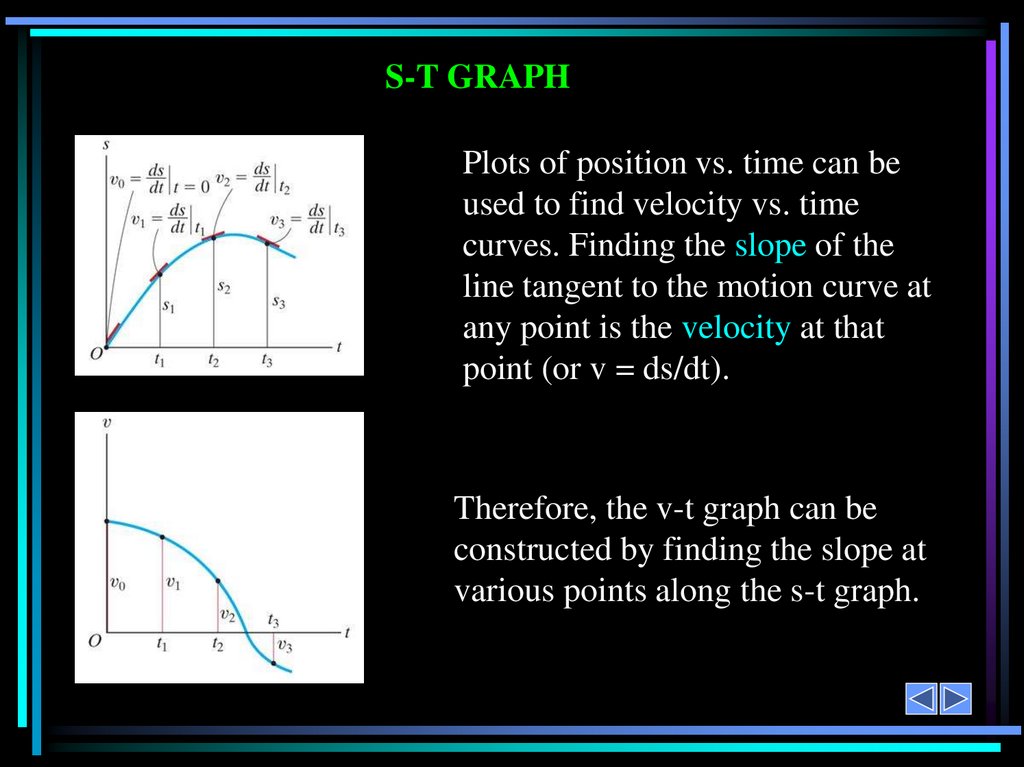
S-T GRAPHPlots of position vs. time can be
used to find velocity vs. time
curves. Finding the slope of the
line tangent to the motion curve at
any point is the velocity at that
point (or v = ds/dt).
Therefore, the v-t graph can be
constructed by finding the slope at
various points along the s-t graph.
6.
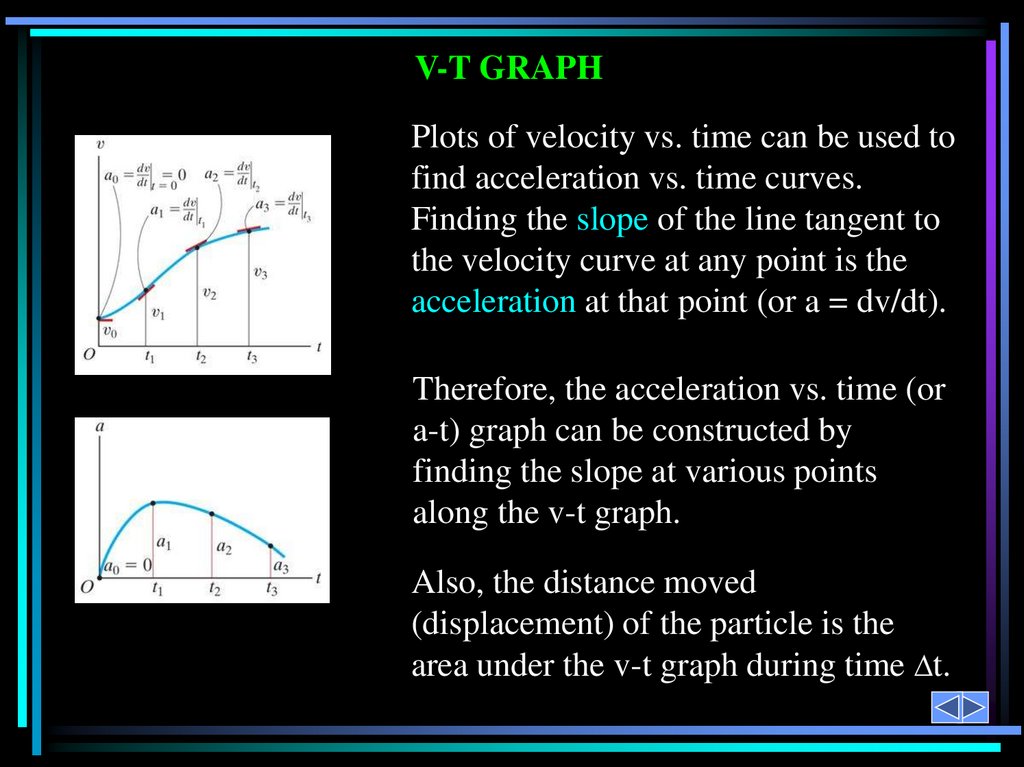
V-T GRAPHPlots of velocity vs. time can be used to
find acceleration vs. time curves.
Finding the slope of the line tangent to
the velocity curve at any point is the
acceleration at that point (or a = dv/dt).
Therefore, the acceleration vs. time (or
a-t) graph can be constructed by
finding the slope at various points
along the v-t graph.
Also, the distance moved
(displacement) of the particle is the
area under the v-t graph during time t.
7.
A-T GRAPHGiven the acceleration vs. time
or a-t curve, the change in
velocity ( v) during a time
period is the area under the a-t
curve.
So we can construct a v-t graph
from an a-t graph if we know the
initial velocity of the particle.
8.
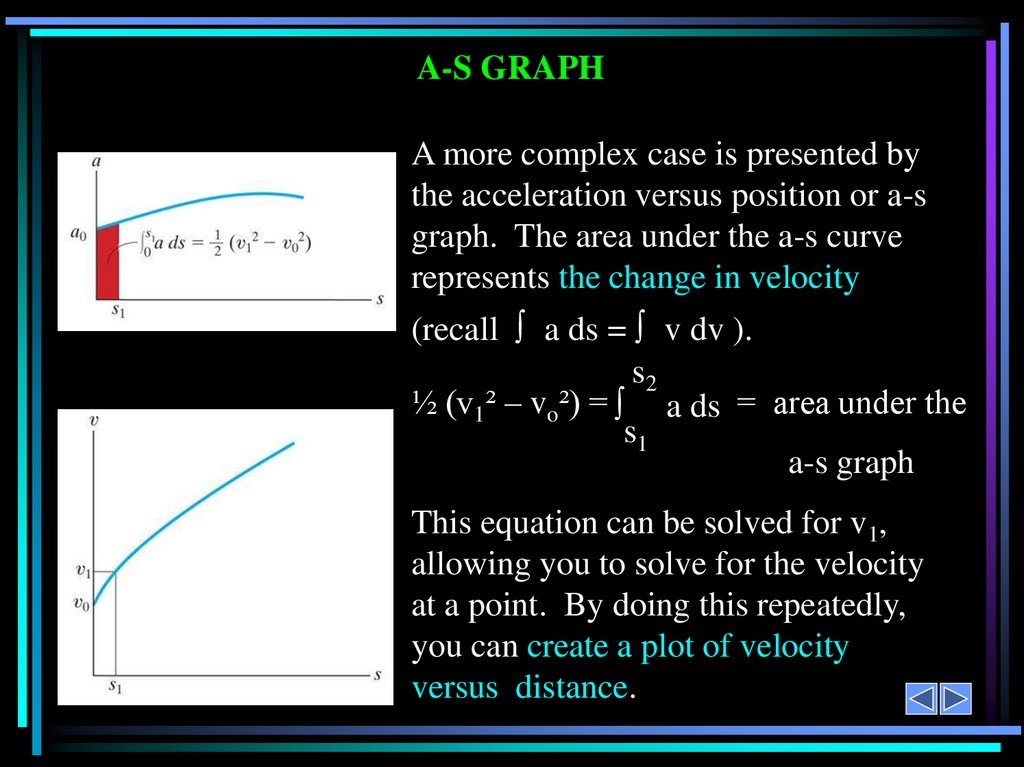
A-S GRAPHA more complex case is presented by
the acceleration versus position or a-s
graph. The area under the a-s curve
represents the change in velocity
(recall a ds = v dv ).
s2
½ (v1² – vo²) = a ds = area under the
s1
a-s graph
This equation can be solved for v1,
allowing you to solve for the velocity
at a point. By doing this repeatedly,
you can create a plot of velocity
versus distance.
9.
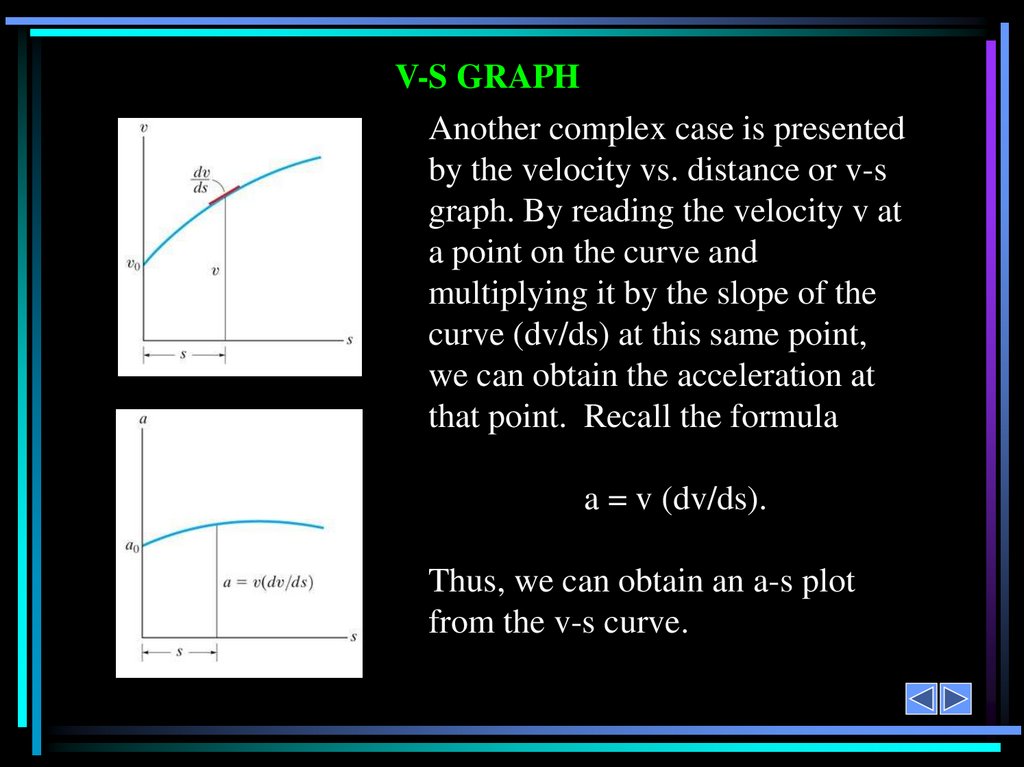
V-S GRAPHAnother complex case is presented
by the velocity vs. distance or v-s
graph. By reading the velocity v at
a point on the curve and
multiplying it by the slope of the
curve (dv/ds) at this same point,
we can obtain the acceleration at
that point. Recall the formula
a = v (dv/ds).
Thus, we can obtain an a-s plot
from the v-s curve.
10.
EXAMPLEGiven: The s-t graph for a sports car moving along a straight road.
Find: The v-t graph and a-t graph over the time interval shown.
What is your plan of attack for the problem?
11.
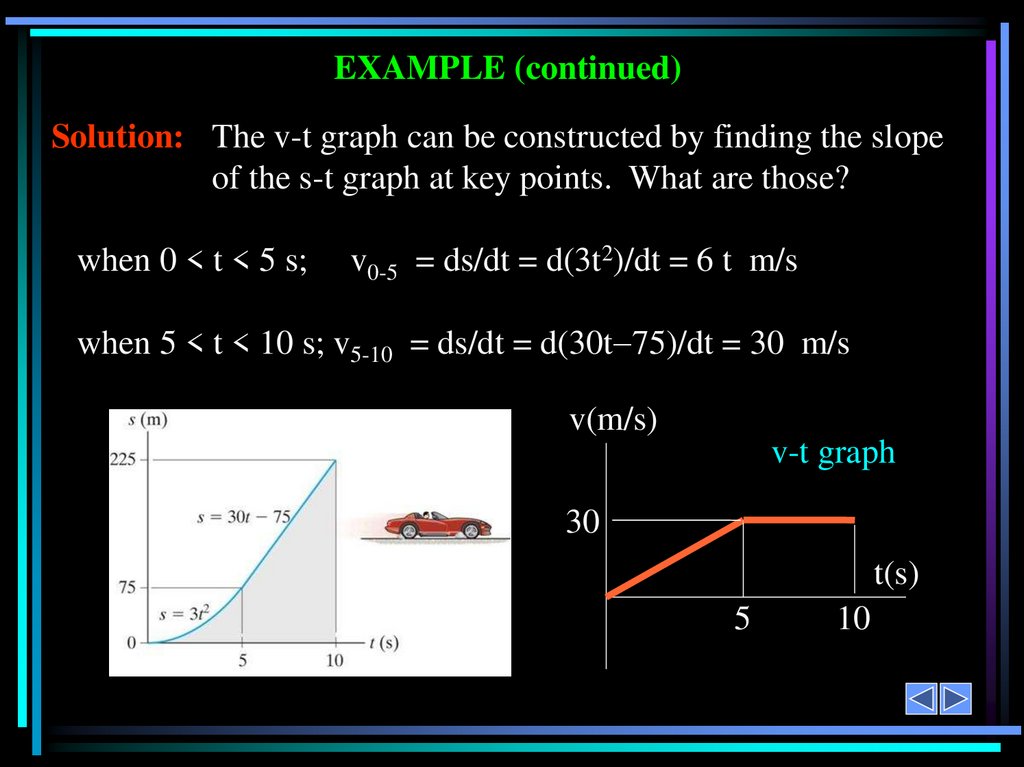
EXAMPLE (continued)Solution: The v-t graph can be constructed by finding the slope
of the s-t graph at key points. What are those?
when 0 < t < 5 s;
v0-5 = ds/dt = d(3t2)/dt = 6 t m/s
when 5 < t < 10 s; v5-10 = ds/dt = d(30t 75)/dt = 30 m/s
v(m/s)
v-t graph
30
t(s)
5
10
12.
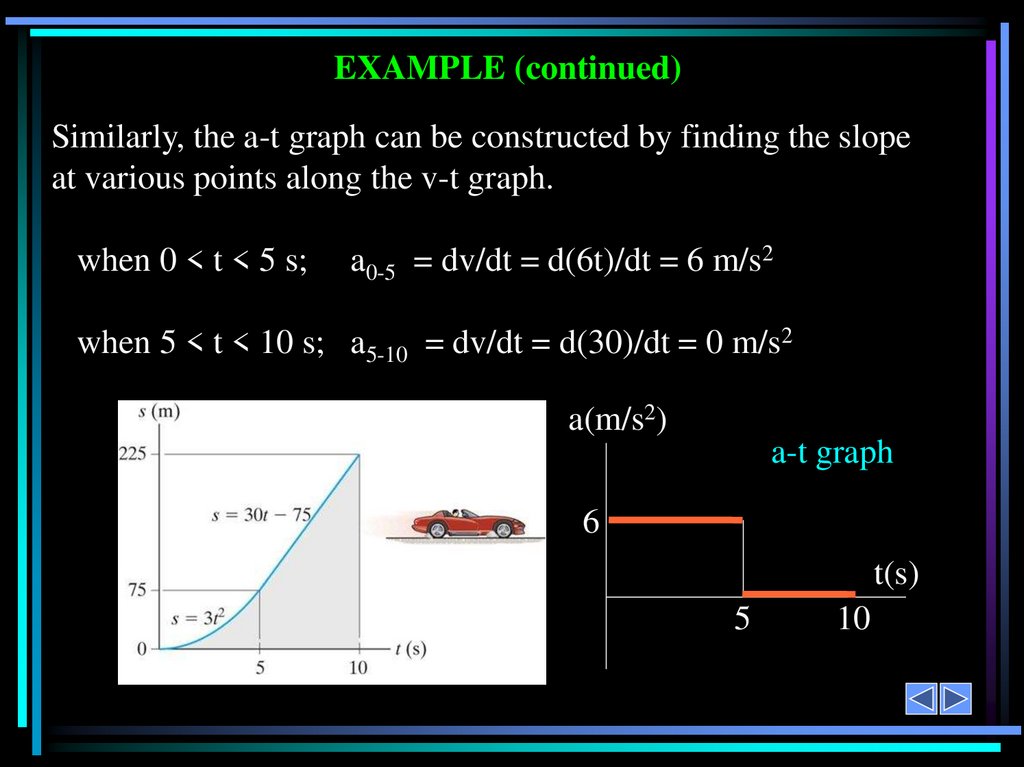
EXAMPLE (continued)Similarly, the a-t graph can be constructed by finding the slope
at various points along the v-t graph.
when 0 < t < 5 s;
a0-5 = dv/dt = d(6t)/dt = 6 m/s2
when 5 < t < 10 s; a5-10 = dv/dt = d(30)/dt = 0 m/s2
a(m/s2)
a-t graph
6
t(s)
5
10
13.
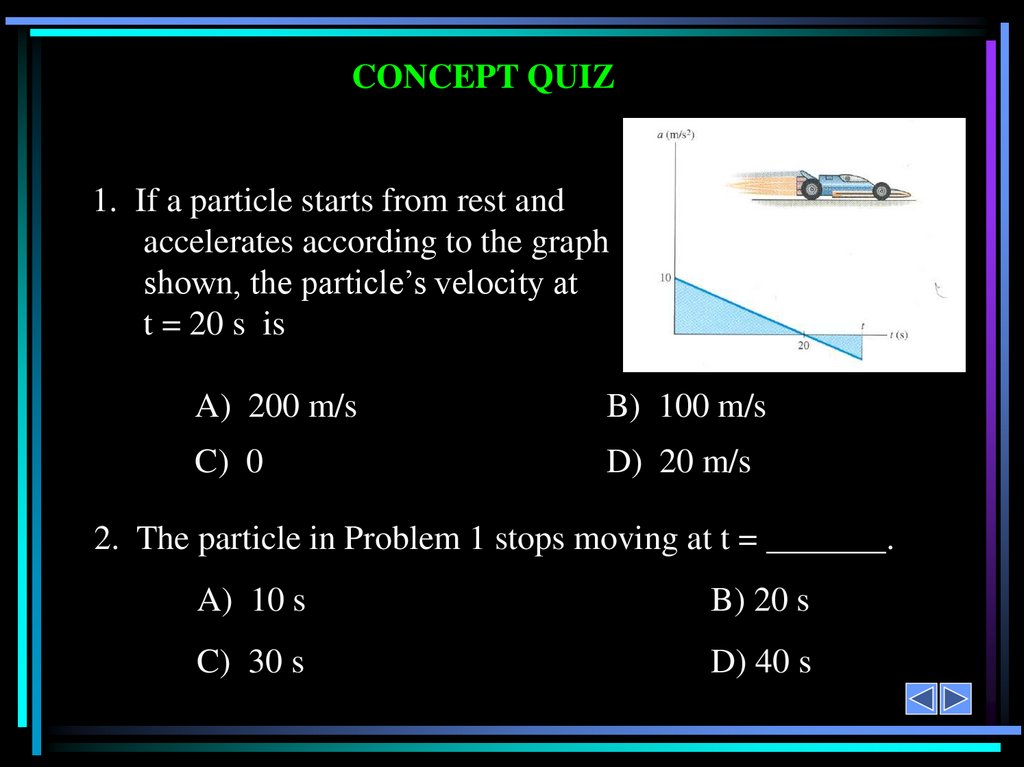
CONCEPT QUIZ1. If a particle starts from rest and
accelerates according to the graph
shown, the particle’s velocity at
t = 20 s is
A) 200 m/s
B) 100 m/s
C) 0
D) 20 m/s
2. The particle in Problem 1 stops moving at t = _______.
A) 10 s
B) 20 s
C) 30 s
D) 40 s
14.
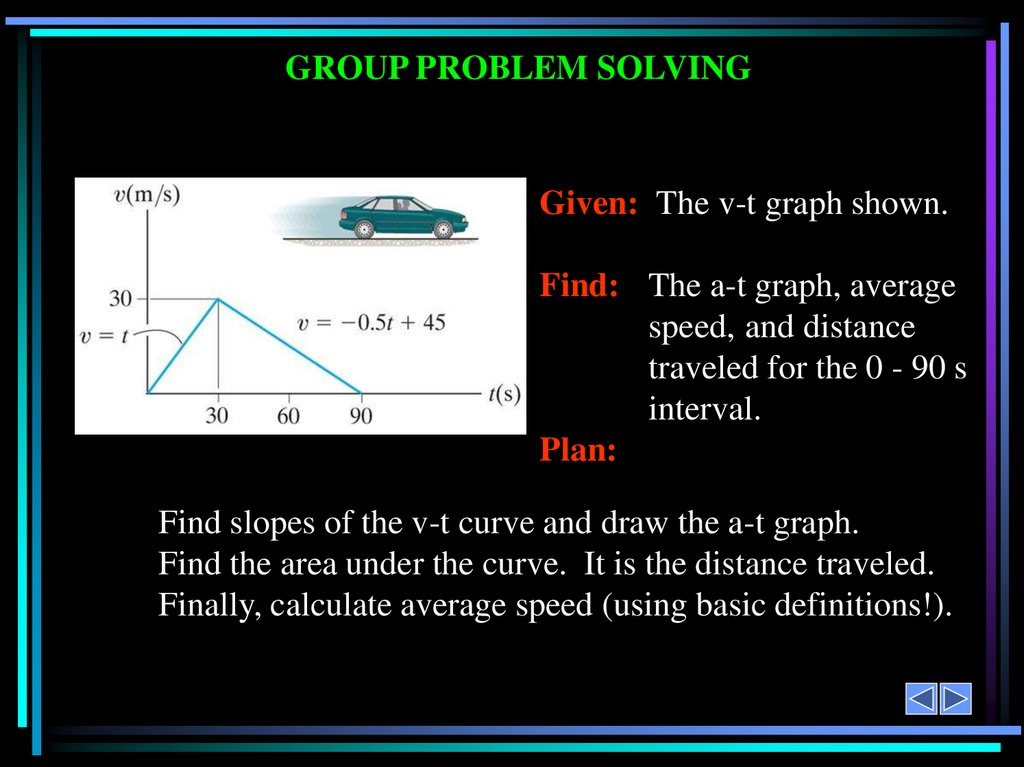
GROUP PROBLEM SOLVINGGiven: The v-t graph shown.
Find: The a-t graph, average
speed, and distance
traveled for the 0 - 90 s
interval.
Plan:
Find slopes of the v-t curve and draw the a-t graph.
Find the area under the curve. It is the distance traveled.
Finally, calculate average speed (using basic definitions!).
15.
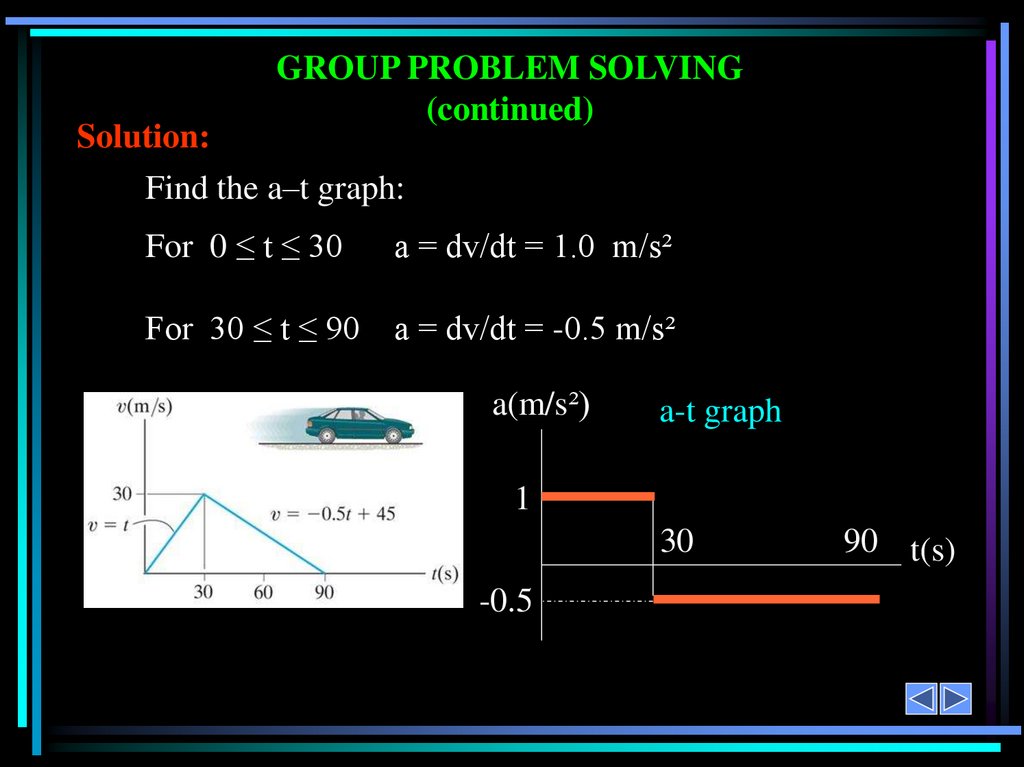
GROUP PROBLEM SOLVING(continued)
Solution:
Find the a–t graph:
For 0 ≤ t ≤ 30
a = dv/dt = 1.0 m/s²
For 30 ≤ t ≤ 90
a = dv/dt = -0.5 m/s²
a(m/s²)
a-t graph
1
30
-0.5
90 t(s)
16.
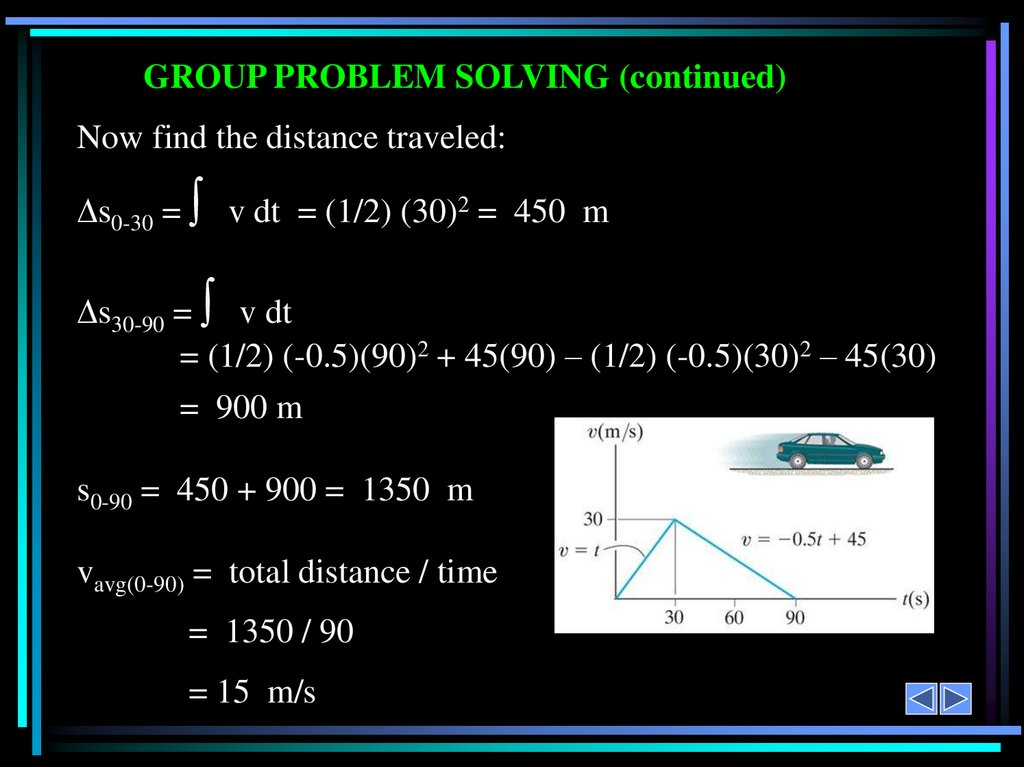
GROUP PROBLEM SOLVING (continued)Now find the distance traveled:
s0-30 = v dt = (1/2) (30)2 = 450 m
s30-90 = v dt
= (1/2) (-0.5)(90)2 + 45(90) – (1/2) (-0.5)(30)2 – 45(30)
= 900 m
s0-90 = 450 + 900 = 1350 m
vavg(0-90) = total distance / time
= 1350 / 90
= 15 m/s
17.
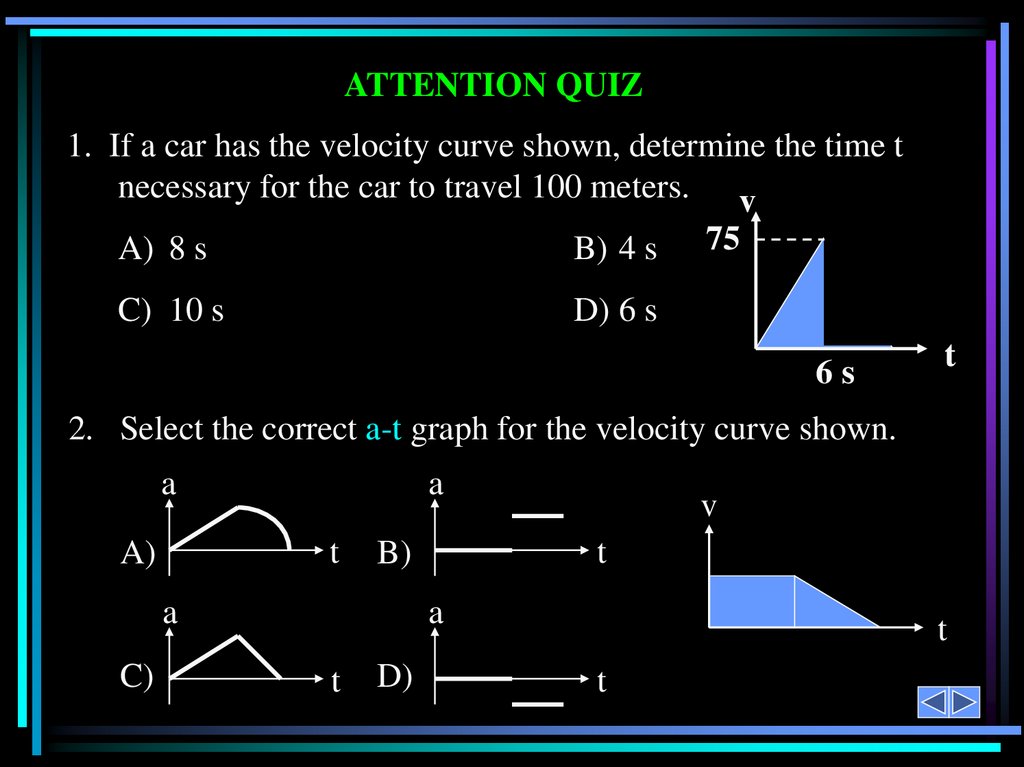
ATTENTION QUIZ1. If a car has the velocity curve shown, determine the time t
necessary for the car to travel 100 meters. v
A) 8 s
B) 4 s
C) 10 s
D) 6 s
75
6s
t
2. Select the correct a-t graph for the velocity curve shown.
a
a
t
A)
C)
t
B)
a
v
a
t
D)
t
t