


")
")


")


")


 management
Similar presentations:


")


")

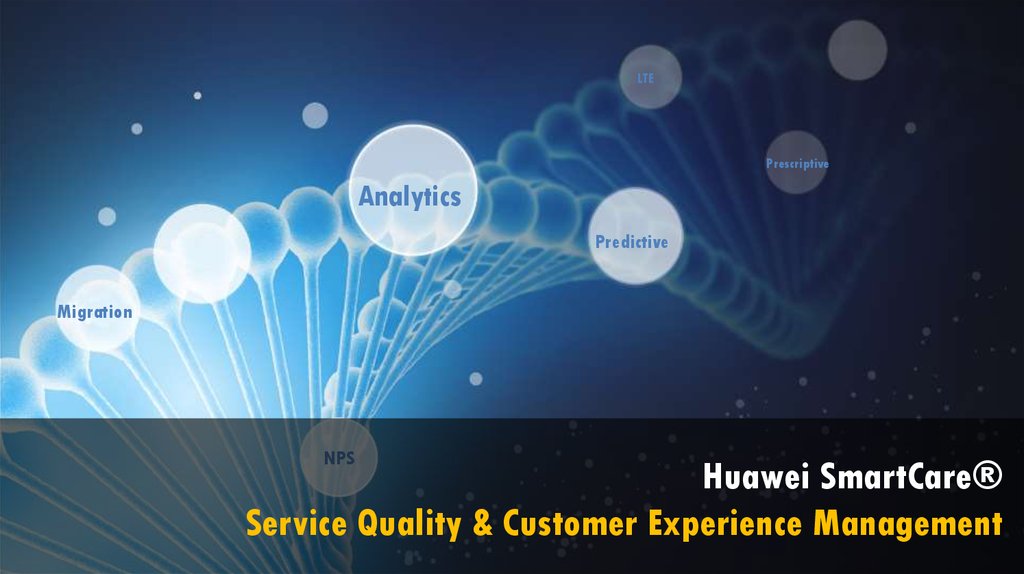
Service Quality & Customer Experience Management
1.
LTEPrescriptive
Analytics
Predictive
Migration
NPS
Huawei SmartCare®
Service Quality & Customer Experience Management
2. Content
1. CEM & SQM & NPM – Huawei’s Capability2. SmartCare® Business Value on a Customer Case
3. Use Cases & Demo & Moscow SQM Pilot
4. Global References & Why HUAWEI
Huawei SmartCare®
Service Quality & Customer Experience Management
3. CEM / SQM / NPM / SOC – Huawei’s Capability
Customer Experience ManagementNPS
CSAT
Churn
OTT Analysis
Service Quality Management
Digital Care
Monetization
Quality
Dashboard
Traffic Hotspots
& Geo-location
User / Service /
Network Mapping
Benchmarking
& Quality
Proactive
Care
Network Performance Management
Network
Planning
Service based
Capacity
Network
Optimization
Long Term Service
Performance
ARPU driven
Planning
Service Operation Centre
VIP Care
Automated Root
Cause Analysis
Enterprise
Care
Customer Care
Efficiency
User centric
Operation
Business
Transformation
OPEX Savings
3rd Party Services
Analysis
CEM Enabling
4. What Huawei can deliver
PlatformService
Operation
CEM
SQM
NPM
Geo-Location
Optimization
Tracing
Set of Use Case
NPS prediction
Churn prediction
SOC Establishment
Quality Improvement
Network Optimization
Service Operation Centre
Establishment & Operation
Network Operation
Network Planning
Set of platforms / tools, services and operation support to increase Operator’s value
5. Content
1. CEM & SQM & NPM – Huawei’s Capability2. SmartCare® Business Value on a Customer Case
3. Use Cases & Demo & Moscow SQM Pilot
4. Global References & Why HUAWEI
Huawei SmartCare®
Service Quality & Customer Experience Management
6. Savings and Earnings by Huawei CEM Platform (CCF)
20.2 Mio GBPPeriod: 5 years
5 groups – OPEX / Revenue
+ Savings on old system replacement
CCF not discounted
Maximal value
Ramp-up period
CCF (5th year): 20.2 Mio GBP
Legend:
-0.5 Mio GBP
Details per stream are presented in further slides
HUAWEI TECHNOLOGIES CO., LTD.
Huawei proprietary. No spread without permission.
Page 6
7. Savings and Earnings by Huawei CEM Platform (Overview)
GroupGroup
Group
Group
Group
C
T
B
N
D
OPEX Savings in Consumer
Operations
Savings in Technology
Operations and Service
Management
Revenue Generating by
Business Services (CEM
Monetization)
Efficient Operations in
Network Strategy and Core
Support
Digital and Marketing Impact
to OPEX Savings
Efficient CC activity and reduced
number of complaints
Reduced number of End Users
TT, less time for demarcation
per TT
B2B Support, SLA Reporting,
Account Management
Efficient planning, roaming
support, LTE users migration
Digital channels reduce
Customer Care Support efforts
1.5 Mio
0.4 Mio
1.3 Mio
2.5 Mio
0.9 Mio
Estimated benefits from CEM Platform on a level of 6.6 Mio per year
NPS
Improvement
Multi SIM usage
Churn
Prediction
HUAWEI TECHNOLOGIES CO., LTD.
Third Party
Demarcation
Location based
Marketing
+15-25 Mio /
year
Other cases
Huawei proprietary. No spread without permission.
By additional use cases, not requested in RFP
Huawei is happy to propose / demonstrate / discuss
Page 7
8. Content
1. CEM & SQM & NPM – Huawei’s Capability2. SmartCare® Business Value on a Customer Case
3. Use Cases & Demo & Moscow SQM Pilot
4. Global References & Why HUAWEI
Huawei SmartCare®
Service Quality & Customer Experience Management
9. Use Cases & Demo
Use Cases & Demo3V Demo
2G/3G/4G User
Migration
First 30 days
journey
Roaming Service
Quality Assurance
SQM Pilot Moscow
NPS
Churn
CEM vs SQM
Architecture &
Platform
VVIP Service Quality
Assurance
ARPU Driven
Network Planning
Enterprise (B2B) Service
Quality Assurance
Customer Care
Assistance
Digitizing
Customer Care
Persona Based
Experience Assurance
Value-Experience
Matrix Migration
Service Operation
Centre
10. Content
1. CEM & SQM & NPM – Huawei’s Capability2. SmartCare® Business Value on a Customer Cases
3. Use Cases & Demo & Moscow SQM Pilot
4. Global References & Why HUAWEI
Huawei SmartCare®
Service Quality & Customer Experience Management
11. Huawei SmartCare® is Leading the CEM Industry
…delivered projects with tangible valueIndonesia: Revenue Improvement
• ~10% revenue increase from high value users
China: Churn Rate Reduction
Prepaid churn rate reduced from 5.17% to 3.66% within 12
months
Denmark: Quality Benchmarking Improvement
Global Market Reference
• Serving 40+ Service Operations Centers for
14 of GSMA Top 30 Operators
• Helped 120+ networks to improve network &
service quality
No.1 in 3rd party quality benchmarking
KSA: Propensity to Call (PTC) Reduction
VIP service quality issues reduced by 90%+ within 6 months
Ghana: NPS Improvement
NPS of business elite persona improved by 10pts
12. Huawei CEM World Class
CustomerProject Technologies Scope
Mobile
Subscriber
Covered Vendors
Wireless
XL Indonesia
GSM/UMTS/LTE
60M
HW, E///
STC Saudi Arabia
GSM/UMTS/LTE/Fix
27M
HW,E///,NSN
PCCW HongKong
GSM/UMTS/LTE
3M
HW
Mobile zhejiang
GSM/UMTS/LTE
55M
HW , NSN , AL,
ZTE , Datang
Unicom Shanghai
UMTS/LTE
6.5M
HW,NSN,ZTE
TDC Denmark
GSM/UMTS/LTE
3.2M
HW,E///
Use Case
Traffic Insights /SQM/VIP CARE
/CCA/CCH
SQM/Roaming Performance Mgmt
VIP CARE /Marketing /Campaign
Support
SQM/Roaming Performance Mgmt/VIP
CARE /CCH/CCA/OTT Analytics
CCA/CCH/Service Quality
Management/Smart CAPEX
Key Benefit
1. Customer Complaint TT reduced by 30% ~ 60%
average in different regions
2. MTTH improved 60% average
1.VIP trouble tickets reduced by ~90% within 24
weeks
2.MKT Support Capability Improved
3. Ramadan & Hajj’s successful guarantee greatly
improved STC’s reliable brand image
1.MTTD : from 3 hours to 0.5 hours
2.Billing enquiries / complaints handling time:
reduced 60%
3.Provides proactive care to 9000+ high value users
1.Customer satisfaction improved by 20%
2. Reduced OPEX compared with traditional DT
SQM/Enterprise Assurance /CEI
Dashboard/Smart CAPEX/Churn
Prediction/NPS Analytics
1.Complaint Rate Reduced by 37.6%
2.VIP Complaint Rate Reduced by 31%
End-to-end Session trace
/SQM/Roaming Performance Mgmt
VIP CARE /OTT Analytics/Smart CAPEX
1.Network quality score No.1 in Denmark
2.Ps data traffic increased by 3 times
13. HUAWEI SmartCare® 3rd Party Partners
Cross-ChannelCustomer
Experience
Assurance
Feedback Management
Digital Channel
CE Consulting
IT NOS,SQM
And CEA equivalent
Service
Quality
Management
IT Solutions
Probe
Network
Optimization
Services
Innovation
with
Industry
Forums
GEO-Location
MV OSS/AFP/ACP
14.
Thank youCopyright©2015 Huawei Technologies Co., Ltd. All Rights Reserved.
The information in this document may contain predictive statements including, without limitation, statements regarding the future financial and operating results,
future product portfolio, new technology, etc. There are a number of factors that could cause actual results and developments to differ materially from those expressed
or implied in the predictive statements. Therefore, such information is provided for reference purpose only and constitutes neither an offer nor an acceptance. Huawei
may change the information at any time without notice.
15. Appendix & Supportive Materials
Appendix & Supportive MaterialsHuawei SmartCare®
Service Quality & Customer Experience Management
16. Group C – OPEX Savings in Consumer Operations
GroupC
Summary (details in further slides):
Reduction of AHT of massive network issues related calls by 15% (1 min savings per call)
Reduction of AHT of technical incident related calls by 10% (1.6 min per call)
OPEX Savings in Consumer
Operations
Improved FCR by 20% by automated root cause analysis per End User
Improved SQ / CE leads to deduction of complaints by 20% with less complaints calls
Efficient CC activity and reduced
number of complaints
Expected savings start from 1.5 Mio GBP per annum
1.5 Mio
Detailed analysis and planning supported BC calculation for OPEX savings
HUAWEI TECHNOLOGIES CO., LTD.
Huawei proprietary. No spread without permission.
Page 16
17. Consumer Operations OPEX Savings Calculation Approach
HuaweiCEM
Number of TT related Calls
Approach
All
Calls
86
Mio
per
year
Source
EE
RFP
Required Personnel
All Calls
Information /
Sales
Marketing
Rest Calls
(Sales,
Tariffs,
Marketing
,
Query / Usage
/ Issue
Complex Issue
/ Complaint
Incident /
Service
Request
Benchmark
s
MetricNet
Complaint
s
1,059,872
0.012% per
User
Target
Resolved at
first call
FCR=70%
(Benchmark)
FCR
AHT
Trouble
Tickets 30%
Call
Time
3.5
6,677,196
TT
min per year
+
min per year
9
Query /
Usage
12
Complex
Issue
16
Incident
Benchmarks
Huawei expects significant savings in Call
Centre by CEM Platform Implementation
Details – please see next page
HUAWEI TECHNOLOGIES CO., LTD.
Huawei proprietary. No spread without permission.
Retail
8,500
(est.)
Marketing
4,928,407
Ofco
m
EE
Results
AHT ~ 6.3 – 6.8
min
Page 17
Call
Centre
2,500
(est.)
11.00
0
Staff
(CC &
Retail)
EE
RFP
18. Call Centre OPEX reduction – details and clarifications
WhatHow
Benefits
Network issues calls
15%
AHT
Assumed performance impact
CE / SQ deterioration caused by network elements fault per End
only for the 7.4% of calls
User will be seen in CRM system for CC L2 staff) – 18 sec savings
per call
Complaints calls
10%
Demarcation on End User Level with pre-resolution by CEM
Backend system for CC L3 will reduce technical incidents calls time
by 1.6 minutes per technical incident call
1.2M
0.03
M
Impacting 0.31% of
all calls (only
technical incidents)
Network issues calls
FCR
20%
Pre-automated root cause identification by CEM Backend for CC L3
helps to correlate known network issues with CE / SQ thus to
reduce number of TT to NOC/SOC and to reduce time for the ticket
creation
Complaints calls
TT
20%
General improvement of Service Quality / Customer Experience
will help to reduce potential number of complaints and will reduce
number of calls
0.2M
Assumed only
0.37% of all calls
refer to TT creation
0.07
M
Assumed only
1.23% of all calls
are related to
technical
£ 1.5 M
per year
HUAWEI TECHNOLOGIES CO., LTD.
Huawei proprietary. No spread without permission.
Page 18
19. Group T – Technology Operations and Service Management Savings
GroupT
Summary (details in further slides):
Reduction of AHT by automated demarcation within the End User TT resolution
CEM Platform allows to demarcate the issue automatically
Savings in Technology
Operations and Service
Management
Demarcation includes demonstration of the NE in the chain
Demarcation includes statistic and status per NE
It helps to save time and not to address to many systems within the demarcation
Reduced number of End
Users TT, less time for
demarcation per TT
0.4 Mio
In BC the time reduction (for demarcation only) is counted on 50% level
Expected savings start from 0.4 Mio GBP per annum
By experience from many MS projects Huawei foresees even higher benefits
HUAWEI TECHNOLOGIES CO., LTD.
Huawei proprietary. No spread without permission.
Page 19
20. Technology Operations OPEX Savings Estimation (EU TT related)
Applicable only for End UserTrouble Tickets and reduces only
demarcation time (it gives 13% of
improvement time for the whole TT
resolution time)
What
Demarcation time
50%
How
Savings
CEM shows NE chain impacting CE / SQ and NE
status – this helps to avoid querying of many
systems for demarcation check
0.4M
End User TT only
£ 0.4 M
per year
HUAWEI TECHNOLOGIES CO., LTD.
Huawei proprietary. No spread without permission.
Page 20
21. Business Services – Efficient Operation and extra Revenue
GroupB
Summary (details in further slides):
Enterprise Monitoring and SLA Management
Automated operations by CEM Platform will allow to significantly save OPEX
Additional revenue / benefits were not counted here:
Revenue Generating by
Business Services (CEM
Monetization)
B2B Support, SLA Reporting,
Account Management
Huawei has a dedicated Use Case Enterprise Assurance
Estimation of extra revenue by UC Enterprise Assurance requires more input from EE
Huawei suggests to have a workshop with EE to estimate additional value for EE
New SLA offers for EE Enterprise Customers (per year)
SLA and KQI* visibility for CE will be given to Enterprises
BC calculation includes expenses for the network optimization to fulfill SLA
1.3 Mio
Expected savings start from 1.3 Mio GBP per annum
Extra support for Enterprises / B2B customers and Account Management
* KQI – Key Quality Indicator
HUAWEI TECHNOLOGIES CO., LTD.
Huawei proprietary. No spread without permission.
Page 21
22. Enterprise Monitoring and SLA Management
MajorSavings
W/O
Platform
CEM
Platform
Preparation of monitoring per VIP /
Enterprise User(s)
43.75
6.25
Create / Review set of KPI in an
additional report per Enterprise
(once a year)
6.25
0.50
Monitor and review KPI per
Enterprise (daily)
4.17
0.50
By CEM Platform alarms will be generated automatically for every VIP
/ Enterprise user. No need to monitor or to check reports on a daily
basis (assumed manually it requires 20 minutes per day per Enterprise
– so 4 people in parallel work)
Generate a report on a monthly
basis per Enterprise
6.25
0.50
CEM Platform will generate reports automatically on a weekly /
monthly with minimal efforts per employee
Mandays per year
1041.67
122.75
Man days difference
918
Platforms allows to load IMSI of Enterprise and to get all locations, NE,
KPI, and KQI Indicators (otherwise it would be required to find all
information, address, find cells and collect manually) – here is example
for 100 Enterprises is shown
~ 5 people
savings
£ 0.29M
per year
Only OPEX savings are counted (Enterprise appreciation – is a bonus)
HUAWEI TECHNOLOGIES CO., LTD.
Huawei proprietary. No spread without permission.
Page 22
23. Enterprise Monitoring and SLA Management
Approach:Benefits:
Enterprise gets SQ reports
CEA* is a strong differentiation factor for Enterprises
Either automated reports or online portal can be given*
Such an approach can help to secure business
Enterprise pays 5% more on a monthly basis
Either to reduce churn or to increase market share
Assumed – 10% of customers would go for it
Assumed 0.1% market share increase
Outcome:
Accumulated income will be completely spent for dedicated optimization
£ 0.98M
So it will become a Service Quality Assurance approach
per year
or
No price increase – optimization costs to be covered by benefits (See above)
Only OPEX savings are counted (Enterprise appreciation – is a bonus)
* CEA – Customer Experience Assurance
HUAWEI TECHNOLOGIES CO., LTD.
Huawei proprietary. No spread without permission.
Page 23
24. Network Strategy and Core – Efficient Operation and extra Revenue
Summary (details in further slides):Group
N
Smart Investments Planning Approach (Traffic / ARPU / Complaints driven)
Analysis and setting up priorities for Cell Planning / Expansion
Analysis done by ARPU, Complaints, VIP, etc
Only OPEX savings for ARPU driven Planning Process are counted
Efficient Operations in
Network Strategy and Core
Support
2G-3G-4G Users Migration (per year)
Identification of the users having LTE capable handset and not using LTE network
Analysis can be done either to identify users with no subscription or wrong configuration
Potential revenue increase (by 5% for 0.5% of only postpaid subscribers)
Efficient planning, roaming
support, LTE users migration
Roaming Customers Traffic-Churn reduction
Analysis of the location / hotspots where EE lose their roamers (due to insufficient coverage)
Recovery of 1.5% of roamers is considered as a benefit for the use case
2.5 Mio
Expected savings start from 2.5 Mio GBP per annum
Extra support for Enterprises / B2B customers and Account Management
HUAWEI TECHNOLOGIES CO., LTD.
Huawei proprietary. No spread without permission.
Page 24
25. Traffic / ARPU / Complaints Planning driven – OPEX Savings
By ARPU / Complaints driven Planning EE canachieve better ROI and generate new revenue
streams – all those will bring extra benefits for EE,
which are not presented in BC at the moment (extra
bonus)
Business Case
Manually with
supportive tools
£ 0.17M
By Huawei CEM
Platform
VS
583
Man days
per year
HUAWEI TECHNOLOGIES CO., LTD.
Huawei proprietary. No spread without permission.
Page 25
60
Man days
26. 2G-3G-4G Users Migration – Additional Revenue Generation
DataCollection
Initial Output
Approach
Network & Business
Consulting
Segmentatio
n
3G Users
(4G Phone Locked in
3G Network)
Traffic
Probes
CRM
CEM
Platform
Proposals
User Behavior
2G/3G Users
with High Data
Traffic
(4G Phone)
Network Proposals
Strategy & Implementation
Terminal
Package
2G Users
(Low Data)
Marketing Proposals
Campaign & Migration
2G Users
Voice Only
Assumed: 0.5% of
current postpaid
customers per year to
be migrated
HUAWEI TECHNOLOGIES CO., LTD.
Assumed: 5% of
monthly ARPU
increased per user
Huawei proprietary. No spread without permission.
1.3 Mio GBP
additional revenue
per year
Page 26
27. Roaming Business Leakage Retention – Additional Revenue
Huawei CEM Platform candemonstrate areas with last
Step2: Collect lost roamer location
details (Cell ID)
Step1: Lost roaming user detection
roamers activity – areas of
Step3: Prioritize network quality
optimization
roamers losing
Areas with high
Inbound roamer
losses
Assumed: due optimized
network the number of
active inbound roamers
will increase by 1.5%
HUAWEI TECHNOLOGIES CO., LTD.
This is expected to
bring min 1 Mio
GBP per year
Huawei proprietary. No spread without permission.
Page 27
28. Digital Marketing – data usage / CE / SQ Info via MyApp and online*
Summary (details in further slides):Group
Data usage and network experience details to customers via MyEE and online:
D
Ability for end users to query / see data usage via EE online or App
Customer Care efforts reduction due to digital channels migration
Digital and Marketing Impact
to OPEX Savings
Simplification of the data queries by CC Agent by only one tool (instead of existing three)
Assumed agent can query information from IT system by 2 minutes shorter than before
Digital channels reduce
Customer Care Support efforts
0.9 Mio
Applicable only for the data query calls (assumed 1.7% of all calls)
Expected savings start from 0.9 Mio GBP per annum
This case requires more detailed analysis dependant on number of queries
* As there is no specific technical requirement in RFP for CEM tool to support MyEE or online complaint, MyEE or online complaint support is out of the proposal scope and needs further discuss
with EE
Page 28
Huawei proprietary. No spread without permission.
HUAWEI TECHNOLOGIES CO., LTD.
29. Data Query Calls Efficiency Improvement – OPEX savings
WhatHow
Data Query Calls
AHT
2 min
Benefits
Impacting 2% of all
calls (only data
usage queries)
0.6M
CC Agent can use only one tool for Data Usage
query (instead previously 3 tools) – this will help
to save 2 minutes per data query call
Data Query Calls
PTC
10%
0.29
M
Online Portal or / and APP integrated to CEM
Platform (to get query results) may help to reduce
up to 10% of data usage requests
Impacting 2% of all
calls (only data
usage queries)
HUAWEI TECHNOLOGIES CO., LTD.
Huawei proprietary. No spread without permission.
£ 0.9 M
per year
Page 29
30. Appendix & Supportive Materials
Appendix & Supportive Materials1. SmartCare® Business Value on a Customer Case
2. Use Cases Set
3. Global References & Why HUAWEI
Huawei SmartCare®
Service Quality & Customer Experience Management
31. 3V Demo – Supportive Materials
32. VIP / VIS / VIA Proactive Care Overview
VISVIP
VIA
(Very Important Service)
(Very Important Person)
(Very Important Area)
Voice Service
Enterprise Clients
Call drops / MOS
M
Monitoring
Throughput / PDP Attach
Web Service
Voice/ Web / Streaming
4G/3G downgrade 3G/2G rate
Response / Delay / Stall / Disconnect
Highlighted KPI
Roaming Clients
Throughput / Traffic / PDP Attach
D
Airport / Urban Highway Area /
Central Business District /
University Area / Industry Park
VVIP
Response / Delay
Streaming Service
Key Areas
Alarm Rules & Ticket Dispatch Methods
Special Events
Exhibitions/ Concerts/ Sporting
Events
Voice/ Location Update
KQI/KPI Rules
Demarcation
R
Resolution
• Core Network Issue Resolution
• RAN Issue Resolution
• SP/OTT Issue Real Time Reporting
• Device Issue Resolution
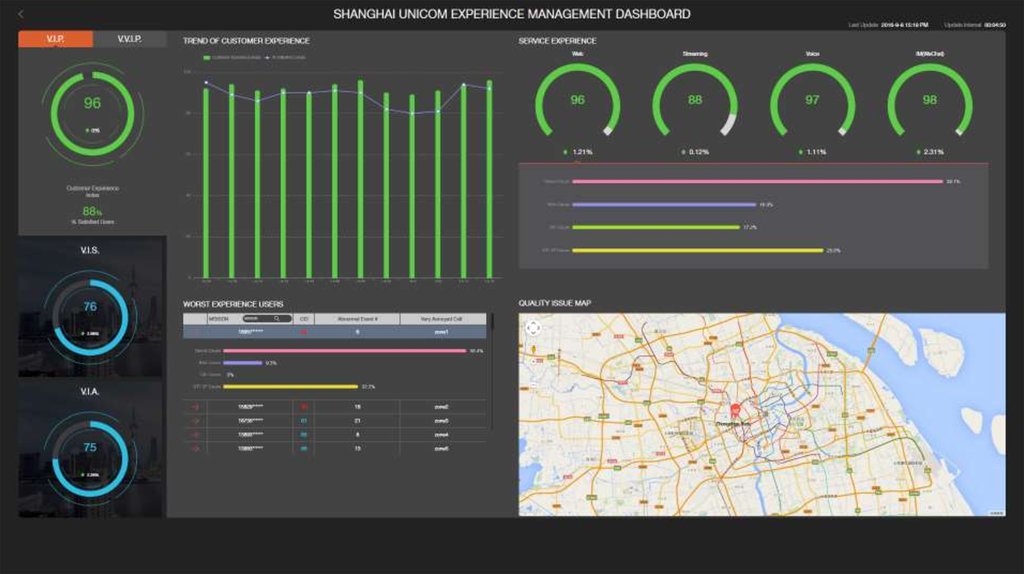
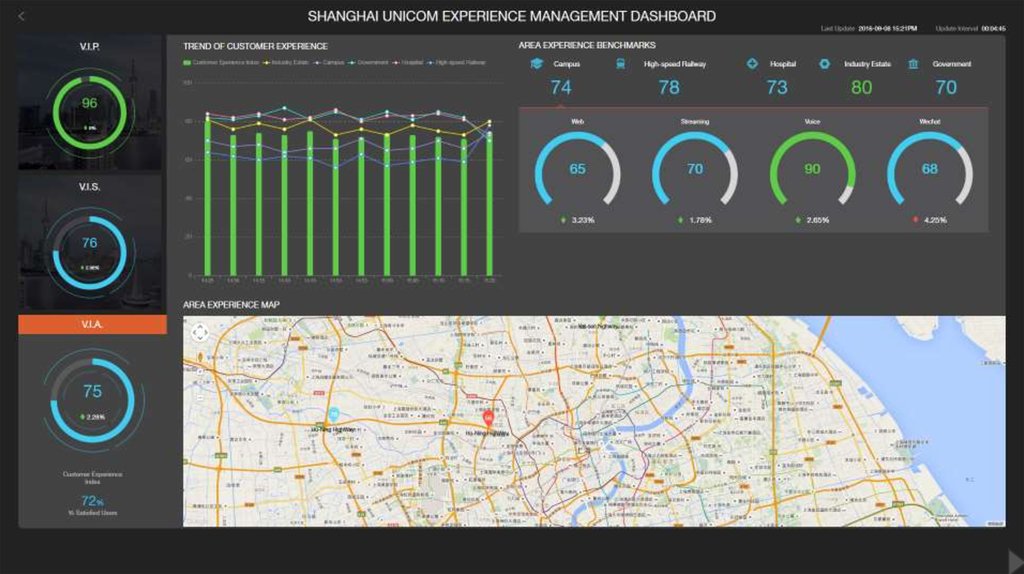
33. 3V Dashboard
34.
35.
3536.
37. 3V Demo – end of supportive materials
38. First 30 days journey – Supportive Materials
39. First 30-Day Journey
Winner of “Best CEM Culture Transformation Program”Business Objectives
Customer Experience
Improve Position in High Value
Management
Post-paid Market
Exploit First Mover Advantage
from Early LTE Launch
First 30-day Experience Assurance
(ICT Journey)
40. Complete View of the 30-day Journey
41. Complete View of the 30-day Journey
42. First 30 days journey – end of supportive materials
43. Architecture & Platform – Supportive Materials
Architecture & Platform – Supportive Materials44. Network Data Sources
Cx/Dx/ShCSCF
Gi
GMSC
SGi
MSCb
Gr
D
SMSC
GGSN
Gn
Protocol
Wireless
Abis
Iub
A
IuCS
Nc
Nb
Mc
C/D/E/F
CAP
Gb
IuPS
Gr
Gn
Gi
Gm, ISC, Sh/Dh, Cx/Dx, Mr,
Mx, Mi, Mj, Mg, Mw DNS
S1-MME
S1-U
S6a
S5/S8
S11
SGi
S4
S3/S10
RR/BTSM
NBAP
BSSAP
RANAP
BICC/ISUP/SIP
RTP/RTCP
H.248
MAP
CAMEL
BSSGP
RANAP
MAP
GTP
Gi-U, Gi-Radius
Core CS
S5/S8
SGW
PGW
S4
S11
SGSN
MSCa
Nc
Interface
Mg/Mi/Mk/Mm/ HSS
Mr/Mw/Gq
S6a
HLR
E
Domain
S3
Core PS
MME
Mc
Nb
MGW
Gb
Iu-PS
S1-MME
Iu-CS
A
GSM
Abis
UMTS
Iub
S1-U
IMS
LTE
LTE
SIP/Diameter
S1-AP
GTP-U
Diameter
GTP
GTP-C
TCP/UDP
GTPv2
GTP
45. Platform Architecture
500 Gbps probe capability & 1800+ protocols identificationApplications
Application
Layer
Interface Module
VIP
Assurance
SQM
System Mngt.
Job Manage
Platform
Layer
Customer
Care Assistance
Data Service Provider Interface
Real Time Processing
Churn
Prediction
…
Data Storage & Data Mining Center
SSV
EDW
Spark, SQL
Meta Data
CMDB
Self Manager
Data Source
Layer
In Memory Computing
CEP
Hadoop
Batch Processing
Off-line Module
Integration
Framework
Access Control & Security
Monitor
Real-time Module
3rd Party
Apps
3rd Party Systems
TT Process
Data Integration and Share
Scheduler
Marketing
Campaign
Support
SMS / Email
CMS
PM/FM
CRM/Billing
PCRF
Data Adaptation
Data Source
Data Source
Passive Probe
Active Test Data
Embedded Data(CHR)
PCRF
FM/PM
CRM
TT
Platform & Data Source Exposure (Big data, Openness)
Service Modeling
Alarm Management
Data Collection, Adaptation and Processing
Fault Tree
Self - Definition
System Integration
Data Sharing
46. CEM Platform to deliver value through use cases
Service Quality ManagementCustomer Care
Customer Experience Management
Proactive and preventive
management of service quality
Efficient Assistance for
Customer Complaints
Management
Big Data Analytics and E2E view on
customer experience with business
impact
Customer
Care
ITMS
Web-based Application Presentation Layer
Report
Engine
KQI/KPI
Definition
Dashboards
SEQ Analyst
Alarm
Management
Role & Auth
Management
Log
System
E-Mail Server
Data Mediation and Preprocessing Subsystem
SMC
CS & PS Data
Fixed Management Platform + SIG /
NetProbe…
IPTV / Broadband
FM
Other
system
Net-Probe
Discovery-Geo
Mobile Agent
Mobile Networks (2G/3G/LTE)
Value through Use Cases for Operator’s needs
Big Data
Other sources
47. Architecture & Platform – end of supportive materials
Architecture & Platform – end of supportive materials48. ARPU Driven Network Planning – Supportive Materials
49. Quality Brand Experience & Value Driven Site Ranking
Quality Brand Experience & Value Driven Site RankingSites Ranking Model
Network Centric
Coverage
Value & Experience Centric
Customer
Experience
Performance
Traffic
f(x)
Value
Terminal
Complaint
Network
Centric
Modeling
Site Ranking
50. Quality Brand Experience & Value Driven Site Ranking
Quality Brand Experience & Value Driven Site RankingValue/experience Classified Model
Customer Experience CEI
High
CEI > 3
Zone 2
Low
Zone 1
****K Subs. 63%
***K Subs. 29%
** MUSD 31%
** MUSD 60%
Monthly Fee < 18.6$
Zone 3
Monthly Fee > 18.6$
Zone 4
VALUE
High
**K Subs. 3%
***K Subs. 5%
** MUSD 6%
** MUSD 3%
Low
CEI < 3
23.7%
Matched with Traditional KPI
Focused List
Zone 4 Target Sites
Traditional KPI Focused
TOP 1000 Sites
51. Quality Brand Experience & Value Driven Site Ranking
Quality Brand Experience & Value Driven Site Ranking52. Quality Brand Experience & Value Driven Site Ranking
Quality Brand Experience & Value Driven Site Ranking53. ARPU Driven Network Planning – end of supportive materials
54. 2G/3G/4G User Migration – Supportive Materials
55. 2G to 3G to 4G Subscriber Migration Matrix
Network optimization4G
Network
Customer contact
Marketing activities
1
4G subscriber
2G/3G Terminal
4G Terminal
5
2/3G high traffic subscriber
6
2/3G high APRU subscriber
4
No 4G contract subscriber
7
3G fall back subscriber
8
3G terminal locked
in 2G subscriber
2
4G fall back subscriber
9
No 3G contract subscriber
10
2/3G low traffic subscriber
11
3G Subscriber
2G/3G
Network
3
4G terminal locked in 2/3G subscriber
56. Migration Analytics to Action Overview
User SegmentationA
Fall back subscriber 4G device terminal using
B
Terminal locked subscriber 4G device model terminal
C
locked in 2/3G network
2/3G network
Potential subscriber Need marketing support
4
No 4G contract subscriber
2
4G fall back subscriber
3
4G terminal locked in 2/3G subscriber
9
No 3G contract subscriber
7
3G fall back subscriber
8
3G terminal locked in 2G subscriber
5
2/3G high traffic subscriber
6
2/3G high APRU subscriber
Influence factors
Marketing
Network
Coverage
RF Setting
Others
Terminal
Contract
Package
Action
Network service quality optimization
Terminal sales
promotion
Customer care &
marketing
Package adjustment
Other
s
57. Best Practice in Operator U
1.7 million of 2G subscribers migrated to 3GG byte / day
MB / Data Subscriber / day
87
12%
66%
36%
1000
13.9
3.320X
15.6
800
2700
By Migration
30%
Natural Growth
( 2013)
2700
8% in 2013
2014/4/3
2014/8/21
1.7M 2G Subscriber Migrated to 3G
2G
3G
20X Traffic Uplift of Migrated Subscriber
2014/4/3
66% More Traffic Increase
Operator has 0 cost
1. PSPU capability
2. Device type correlated with traffic type
3. Segmentation base on subscriber behavior
2014/8/21
58. 2G/3G/4G User Migration – end of supportive materials
59. Roaming Service Quality Assurance – Supportive Materials
60. Solution Overview
Roaming Qualitymonitoring
Roaming Service Quality
Analysis
Performance
Analysis
Steering
Analysis
61. Roaming Quality Monitoring
Select carrierSelect KPI
Key Monitored Contents:
• Number of inbound and outbound roamers
• Historical trend for the number of inbound and
outbound roamers
• Specified KPIs and carrier
• Top poor-quality carriers ranking
• Supports drilldown to trend analysis.
• Interfaces include MAP, CAP, ISUP, Gp, IuPS,
S1MME, S8, and S6a.
• KPIs of LU, Voice, SMS, and Data services
Configure threshold
Perform monitoring
62. Performance Analysis
Inbound and outbound roaming KPIranking
Performance Analysis
Roaming performance
KPIs
Performance
Ranking
Performance
Trend
Roaming KPIs ranking by
country/carrier/region
Roaming performance
historical trend by
country/carrier/region
Roaming LU SR (%) History
Trend
100
95
90
China
Failure analysis and detail record analysis
RAN issue
SP issue
Device issue
……
Problem
Demarcation
Canada
63. Steering Analysis
Steering identificationSteering failure analysis
Identify steering status of carriers in different
countries
Steering
Success Rate
Country
Operator
LU Attempt
Steering
A
XXX
59545
59545
B
XXX
46324
46324
C
XXX
41037
28746
70%
D
XXX
36928
23654
64%
……
…
…
…
Steering failure code distribution
Steering Analysis
100%
100%
Steering detail record analysis
64. Best Practice
Roaming KPI AnalysisSelect query criteria, including Time Period, RAT, Roam Type.
Roaming KPI Demarcation
Using failure analysis and detail record analysis to demarcation
Roaming failure.
Suggestions:
1. Confirm the roaming user has been
configured in the network.
Top 10 country/Carrier list. And then select the indicator such as
Location Update Success Rate.
Failure cause category and cause analysis distribution for demarcation
roam failure.
2. Need check MAP log for detail reason of
network failure.
Using History Analysis function to see the indicator history trend.
Detail Record analysis to see the detail failure information and signal
flow
65. International Roaming Analysis
Background:KPI Monitoring
GRQ Reporting
International Roaming Issues
• The right partnerships are critical for optimal roaming revenues(Best
Operation
Customer Service
Marketing & Sales
Digital Service
Traffic Distribution
Gain & Lost Report
Roaming Experience and Appropriate Rate);
• The operator need detailed, prioritized and actionable information to
avoid roaming revenues lost;
• The operator need finely solution to optimize network for increase
SEQ Analyst Platform
roaming traffic
Value Proposition:
• Increase roaming traffic
Real-time roaming traffic and performance monitoring
Deeply root cause analyze base on per roamers
Gain new business opportunity
Provide competitive SLA to gain more roaming partners
Up-sell promotion base on rich roaming service analysis
Gp
BSC
Gp
IuPS
GRX
Abis
BTS
2G
HLR
Gb
A
SMC
CD
MAP
CAP
ISUP
E
IuCS
Node B
GGSN
Gr
(PC
U)
Detect roaming fraud behaviors
Provide proofs for controversial roaming billing settlement
Reduce MTTR of roaming issue
Visit Network
SGSN
Avoid roaming revenue lost
Fast fine and locate inbound roaming barriers
Indentify the outbound roaming destination gaps
GGSN
Local network
Iub
3G
RNC
VMSC
ISTP
HLR
SS7
ISTP
66. Roaming Business More Effectively
Analysis roaming KPI and alarm event.① Fraud HPLMN send bar to VPLMN to limit the
calling right , but VPLMN not receive the bar
Operation
Customer Service
Marketing & Sales
Digital Service
The Customized Report for Specific Roaming Scenario (Gain
and Lost CELL List)
Analyze roaming failure cause
Best Partners and New Partners Insight
Partners Network Quality Insight
② Steering HPLMN steer roamers onto best
partners networks to ensure QoS and cut costs
③ Anti-Steering VPLMN reserve theHome
inbound
roamers onto network to increase revenue
PLMN
Detect the inbound Roamer first visit
CELL
Detect the inbound Roamer lost CELL
Anti-steering is proscribed by the GSMA
Roaming Analyses help operator run
roaming network more effectively
• Real-time roaming traffic and performance analysis, deeply
cause analyze base on per roamers, It can help operator
reduce MTTR of roaming issue and gain new business
opportunity
Which operators have the bad or best networks? Why
cannot connect to network?
Which operators should be your best partner with?
Which operators should be your new partner with?
Roaming Audit help operator avoid roaming
revenue lost
• Roaming audit can help operators to prevent revenue losses
through find:
Fraud calls: Cast back the lost revenue
Steering: Perfect QoS and cut costs
Anti-steering: Visit PLMN Increase roaming revenue ,
but Home PLMN is a casualty
Roaming Gain & Lost analyses help operator
promote the roaming traffic
• Roaming Gain & Lost analyses can help operator to increase
number of first visiting roamers and roaming traffic through
optimize following cells:
Top cells for roamers may be lost to competitors
Hot cells for first visiting roamer
67. Roaming Service Quality Assurance – Supportive Materials
68. VVIP Service Quality Assurance – Supportive Materials
69. VIP Assurance
SQMVIP Care
Customer Care
Churn Predict
360°VIP Understanding:
• What application the VIP is using.
- HTTP, Video, MMS, WAP, FTP, Email, Voice, SMS
• Where the VIP is.
• What handset the VIP using.
VIP Report
• What network assets are being using.
• What errors the customer experiencing.
Used to:
• Understand the VIP Failure in real-time.
VIP Analysis
• Fast analyze any problem of VIP.
• Measure the impact of service decline to VIP.
• Provide data source to evaluate the QOE of VIP.
• Steer the optimization to improve VIP experience.
VIP Tracing
NPS Analysis
CEI
70. VIP and VIP Groups Real Time Monitoring
VIP Management :CS Service : Voice, SMS
PS Service : MMS, Web, WAP, Streaming,
Email …
VVIP Monitoring --1 minute interval
• 1 000 VVIPs Real-time Care
• 2 000 VIP Groups Under Real-Time Care
• Voice service and packet service.
VIP Subscriber
Failure Alert
VIP Subscriber
Location Map
• Drill down analysis to call trace
Customer Group Management:
• Grouping customer by data consumption
volume, spending characteristics, device,
etc.
• Analysis by distribution, terminal, root
cause
VIP Group Management –5 minutes interval
VIP Group CS and PS Service Quality monitoring
71. VIP Experience Insight
Start from 21:00,09 May 2016Her video stalled frequently
User 1, High revenue generator
Like surfing in internet and prefer
Youtube
Experience Insight
Real-time KQI alarm triggered
Time
User
Service
Failures
2012-10-09 21:00
User 1
Youtube
Streaming Stall Frequency
over threshold
2012-10-09 21:01
User 1
Youtube
Streaming Stall Frequency
over threshold
2012-10-09 21:03
User 1
Youtube
Streaming Stall Frequency
over threshold
Failure history analysis
Location Analysis
Device Analysis
Device
Type
Device
Brand
Operation
System
Service
Failures
Service
Requests
C5
Nokia
S60V3
6
10
Discover VIP’s service abnormity within 1
minute
Service Failure
rate(%)
60%
72. VVIP Service Quality Assurance – Supportive Materials
73. Customer Experience from whole Customer Journey
AdvertisementProduct Information
Product Comparison
Subscribing
Activating
Using
Here are touch
points within a
complete
Customer
Paying
Consumer
Requesting for Help
Resolving
Prolonging / Canceling
Journey
74. Journey and Touch Points – Experience is in between
Clarification /Understanding the product
Selecting and
Subscribing
Checking
credibility
Activation /
Billing
Paying
Prolong /
Expand
Decision for
Cancel
Advertising
communicatio
n / First
Contact
Churn
Change Request
Using
Getting
resolution
Trouble resolution
request
Selection
Experience
Response
Experience
Sharing
Billing
Experience
Trouble Resolution Experience
Activation Experience
The most time
consumers are
here
(but not only)
Experiencing
Pro-active care
experience
Use
Experience
Contract
Prolongation
Experience
Churn
Experience
CEI
75. KPI from each Point to create CEI of End User
Clarification /Understanding the product
CEI Checking
– CustomerActivation /
credibility
Billing
Experience Indicator
Selecting and
Subscribing
Expecting
Paying
Prolong /
Expand
Advertising
communicatio
n / First
Contact
Decision for
Cancel
Churn
Do you already
Selecting
Change Request
cover complete
Using
Buying
Getting
resolution
0
Using
User
Sharing
Prolonging
Response
Some Touch
Experience
Points
examples
2
4
6
8
Trouble resolution
request
Customer
10
Sharing
Experiencing
Journey for your
CEI = F(CEI1,CEI2, .., CEIN)
Selection
Experience
Billing
Experience
Trouble Resolution Experience
Activation Experience
Pro-active care
experience
Use
Experience
CEM?
Contract
Prolongation
Experience
Churn
Experience
CEI
76. Snapshot to show Impact to User Experience
Clarification /Understanding the product
Selecting and
Subscribing
Checking
credibility
Activation /
Billing
Paying
Prolong /
Expand
Decision for
Cancel
Advertising
communicatio
n / First
Contact
Churn
Change Request
Using
User AAA
User BBB
User CCC
User DDD
Getting
resolution
Trouble resolution
request
What is the real most concerned
factor for majority of Users?
User GGG
User HHH
User PPP
User AAA
User XXX
User YYY
User ZZZ
User DDD
Sharing
Experiencing
Have you got a system to see CEI for all Touch
Points?
How many users at this moment stuck in Activation or waiting for Trouble Resolution?
77. How it works – Info to be gathered from whole ICT
CRM /Advertising
Shop / eShop
CC Sales
Portal
Provisioning
Network &
Probing
Big Data Storage
Clarification /
Understanding the product
Advertising
communicatio
n / First
Contact
Billing
CEM Platform
Customer
Care
Report Example:
Response Rate
Response Time
Best Response Time Window
etc
Reporting
Profiles
Mediation
Aggregation
Profiles
Events
Analysis
Gathering
Events
Selecting and
Subscribing
Checking
credibility
Activation /
Billing
Paying
Prolong /
Expand
Change Request
Decision for
Report Example:
Cancel
First Page visit
Purchase rate
Abandoning page
Churn
etc
Using
Getting
resolution
Trouble resolution
request
Surveys
Sharing
Experiencing
78. See at whole and by details to improve by Influencer
MarketingCEI (or NPS)
Unhappy customers:
Happy customers:
•User AAA
•User BBB
•User CCC
•User DDD
•User XXX
•User YYY
•User ZZZ
•User XYZ
Billing
Network
Customer Care
Cumulative Customer
Experience Indicator
Operation
Revenue
Loss / Gain
79. Huawei’s CEM Solution under the name SmartCare®
Experience ProblemsQuick Demarcation
Experience Visualization
• Customer Journey
definition, E2E experience
gathering and
visualization
Service Quality
Management
• Huge application analysis with
real-time monitoring for the service
quality visualization
CEM Solution
• Experience Problem
demarcation to decrease
customer complaints
Various Report/Use Case
• Various report generation based on
Big Data Analysis
80. Service Quality Management
CEM or SQMWhat is the difference?
81. What kind of service we manage quality for?
VoiceSimple Question
SMS
Internet
What kind of
services you deliver
to your End Users?
?
WAP / MMS
M2M
YouTube?
Facebook?
Instagram?
It is hard to manage quality of services for non-own ser
HUAWEI TECHNOLOGIES CO., LTD.
Huawei proprietary. No spread without permission.
Page 81
82. From QoS via Service Quality to Customer Experience
ServiceQuality
QoS
QoE
VS
QoS
Defined by ITU many years ago:
Service
Quality
Customer
QoE
Experience
Throughput
Voice
Customer
Messaging
Latency
Packet Loss
Experience
M2M
WEB Service
Jitter
SQM is a typical entity existing almost in all network ope
HUAWEI TECHNOLOGIES CO., LTD.
Huawei proprietary. No spread without permission.
Page 82
83. From Service Quality to Customer Experience
(Committed)Quality
Experience
User 1
User 2
UC
2
UC 1
Expectations
SLA / Promise
Quality versus
Experience
UC
3
Expectations
User 1
Quality
Satisfaction
User 2
Quality
Service
capabilit
y
Satisfaction
Use Case 1
Use Case 2
Use Case 3
CEM correlates real Experience and Customer Expectations
HUAWEI TECHNOLOGIES CO., LTD.
Huawei proprietary. No spread without permission.
Page 83
84. Merge of subjective and objective to have real CEI
CEM Summary – from traditional QoS to QoE driven CEMBusiness Benefits
Service Quality
and Quality
Alarms
Enhanced SQM by
customer journey and
touch points
Efficient
CAPEX
OPEX
Savings
Business
Efficient
Troubleshooting
Service
Centricity
User
driven by
New
Revenue
Streams
Customer
Experience
Regular Network
Optimization
Enhanced operation +
Traditional SOC
CSAT
&
NPS
Objective (experience)
+ Subjective
(expectations)
Churn
Retention
User Experience
Oriented operation
CEM is a new way of Business in Digital Telco World
HUAWEI TECHNOLOGIES CO., LTD.
Huawei proprietary. No spread without permission.
Page 85
85. CEM Summary – from traditional QoS to QoE driven CEM
Net Promoter Score86. Net Promoter Score
VALIDATE POSITIVE IMPACT OF IMPROVING NPS87. VALIDATE POSITIVE IMPACT OF IMPROVING NPS
UNCOVER NPS INFLUENCING FACTORS PER PERSONAFactors Where The Customer Expectation is High are HYGIENE FACTORS. Good Performance Reduce Detractors and Negative WoM.
Factors Where The Customer Expectation is Low Offer an Opportunity to Delight. Good Performance Creates Promoters and Positive WoM.
88. UNCOVER NPS INFLUENCING FACTORS PER PERSONA
PERSONA BASE NPS IMPROVEMENT APPROACHReduce Detractors & Monetize Promoters
89. PERSONA BASE NPS IMPROVEMENT APPROACH Reduce Detractors & Monetize Promoters
VALUE DELIVERED IN PRACTICE WORLDNPS Improved 10pts with $1.2 Additional Earning
90. VALUE DELIVERED IN PRACTICE WORLD NPS Improved 10pts with $1.2 Additional Earning
NPS Detractors – not a one but many different groupsWhat to do?
All Users are different and their concerns
are different
We cannot simply improve NPS by same
Why tariffs are
so complex?
Why I cannot
make a call?
≠
/ one action(s) for all users
What to do and where to start?
≠
Why Web
loading time
is so long?
Detailed view on Promoters and
How can I
check my
balance?
Detractors with particular step(s)
for every group
HUAWEI TECHNOLOGIES CO., LTD.
Huawei proprietary. No spread without permission.
Page 91
91. NPS Detractors – not a one but many different groups
Net Promoter Score Prediction FrameworkSetup
Pattern Recognition
100+
Algorithms
Mass Application
Random Forest
Live Engine
Seed Model
Predictive NPS Score
Selected Algorithm
Run 8K Libraries for
NPS survey samples
Training Sets
Combined NPS DNA
patterns for every user
NPS Predictive score
per individual user
Surveyed Focus Group
Combined NPS
DNA Patters
Passive
Promoters
…
Probes
CRM &
Billing
Score
4
User 2
8
…
MSISDN
Score
8126***1
6
8125***7
9
8122***8
2
3
Regions
NPS
City 1
48,8%
City 2
54,5%
…
Validation Process
DNA
Patterns
• 8000 DNA-pattern maps
• Source: 24 countries
• Approach: Individual User
Level
Users
User 1
User N
DNA Maps
Detractors
Outcome
+
Prediction
Results
Survey
Results
HUAWEI TECHNOLOGIES CO., LTD.
CRM &
Billing
85,1%
Users
Best Survey
Time
User 1
13:00-14:00
User 2
DNA Patterns learned
from Global NPS
Experience
Probes
City N
…
User N
Survey
Data
Probes
CRM &
Billing
Huawei proprietary. No spread without permission.
Probes
CRM &
Billing
Page 92
85,1%
Geo-Map, Table, Top users /
cells
92. Net Promoter Score Prediction Framework
Let us imagine – measured NPS is 10 (%)0-2
3-4
5-6
7-8
9-10
0-2
3-4
5-6
7-8
9-10
10
0-2
3-4
5-6
7-8
9-10
0-2
3-4
5-6
Shall we use same improvement mechanism for every case?
HUAWEI TECHNOLOGIES CO., LTD.
Huawei proprietary. No spread without permission.
Page 93
7-8
9-10
93. Let us imagine – measured NPS is 10 (%)
Address Expectations of every NPS Score GroupUser Centric
Quality Excellence
NPS
Group
Actions
Differentiated
Coverage
VMOS
Fast response
Benchmarking
Personalized services
Call SSR
Video Quality
Pro-active care
Best capability
Omni Channels
Billing
CDR
Digital Channels
Newest technologies
Innovative
Availability /
Accessibility
Integrity &
Service Quality
Communication &
Resolution
Exceeding
Expectations
Personalization &
Empathy
0-2
3-4
From Stable Performance
to Excellent Quality
HUAWEI TECHNOLOGIES CO., LTD.
5-6
7-8
Best Network &
Best Operator
User Oriented Operation
Huawei proprietary. No spread without permission.
9-10
Page 94
94. Address Expectations of every NPS Score Group
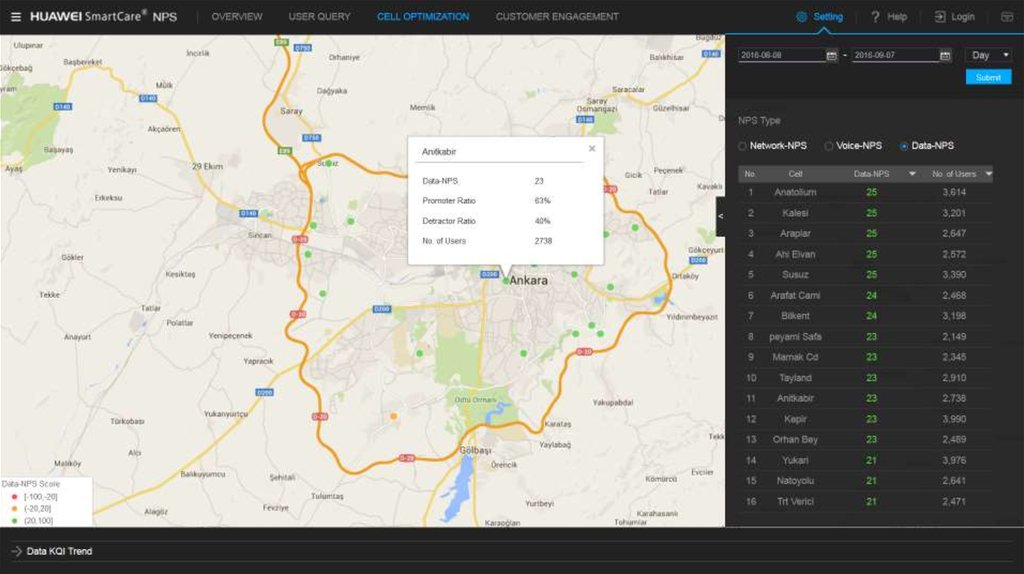
NPS Demo95. NPS Demo
96.
97.
98.
99.
Churn Prediction – Details100. Churn Prediction – Details
Why we should manage Churn?• New subscriber attraction cost is 3..10 times higher than retention cost
• Loyalty decrease of 5% causes 25% revenue loss
• Packages/tariffs promotion success rate is only 15% for new subscribers,
while for existing subscribers it's 50%
• Annual churn decrease of 5% might increase revenue by 25-85%
101.
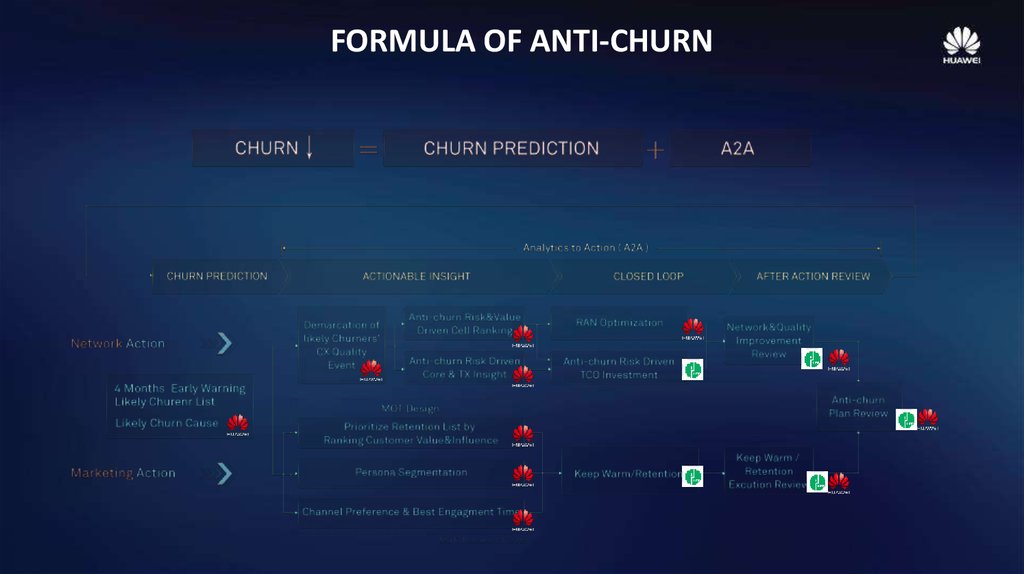
FORMULA OF ANTI-CHURN102. FORMULA OF ANTI-CHURN
MethodologyBetter Result by Experience Oriented Churn Detection
SmartCare Churn Prediction Model
Based on Experience Data (OSS+BSS Data)
Traditional Churn Prediction Model
Based on BSS Data)
User decides to leave
Transition
Point
Usage
Golden Period
Real Churn
Point
Transition Period
Churn Point
Recognized
By System
Fake Living Period
Time
Experience
Attitude
Behavior
103.
HUAWEI Churn Prediction Solution HighlightTransition
Point
Usage
Decide to leave
Customer Experience based
analytics from OSS+BSS data,
with churn probably motivation:
Real Churn
Point
Customer usage based
analytics from BSS data only
Network
Service
Campaign
Billing
4 Months advanced
Churn Prediction Model on both OSS+BSS Variables:
Recall Rate: 43%
Top 20% Precision: 65%
Change operator
Time
2-4 weeks advanced
Churn Prediction Model on BSS Variables:
Recall Rate: 38%
Top 20% Precision: 62%
Source: China Unicom SH
104.
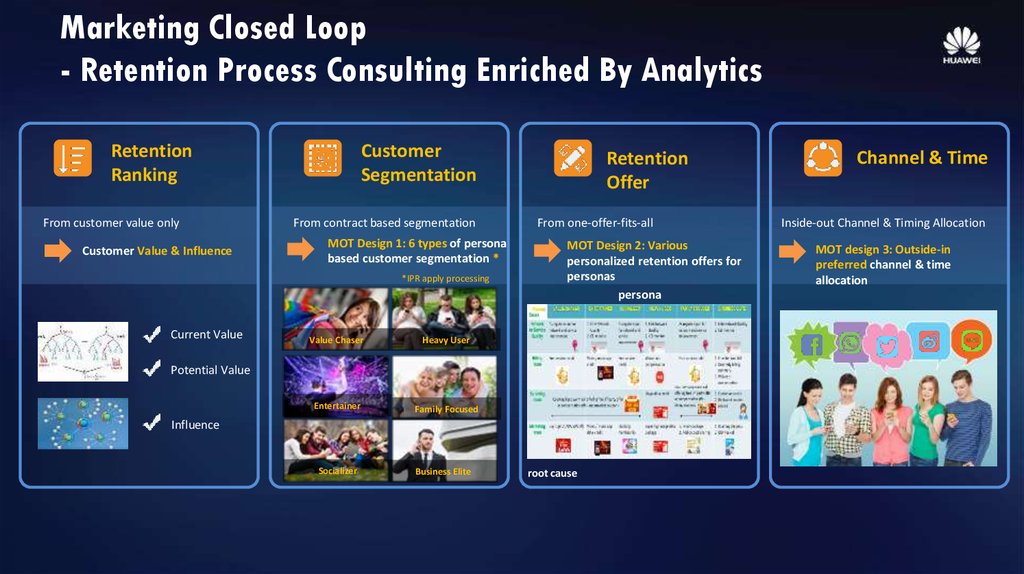
Marketing Closed Loop- Retention Process Consulting Enriched By Analytics
Retention
Ranking
From customer value only
Customer Value & Influence
Customer
Segmentation
From contract based segmentation
MOT Design 1: 6 types of persona
based customer segmentation *
*IPR apply processing
Current Value
Value Chaser
Heavy User
Entertainer
Family Focused
Retention
Offer
From one-offer-fits-all
MOT Design 2: Various
personalized retention offers for
personas
persona
Potential Value
Influence
Socializer
Business Elite
root cause
Channel & Time
Inside-out Channel & Timing Allocation
MOT design 3: Outside-in
preferred channel & time
allocation
105. Marketing Closed Loop - Retention Process Consulting Enriched By Analytics
Reference Case- early predication & MOT improve retention effect greatly
The churn rate of “Retention Group” is much lower than the ones of “Base Case” and “Control Group”
based on accurate & 4 months ahead churn predication with MOT designed retention offer
Churn Rate Comparison
Base
Customers
49.3%
Accurate & 4 moths
ahead and Churn
Prediction Model
5.4%
0.87%
Prediction
List
Control Group without
retention
Random
Subgroup
Control group
without retention
(20%)
Retention group with
MOT design
(80%)
Unicom
HUAWEI
• Base case churn rate was sourced as Ave. of 2013.
• The prediction list was generated in Aug 2015.
• Control group & Retention group’s churners were verified in Feb 2016
Source: China Unicom SH
106. Reference Case - early predication & MOT improve retention effect greatly
Achieved 2.4% Churn Rate Reduction~49,000
Network
Closed loop
Subscribers successfully retained
during 7 months (Jun-Dec 2015)
2.4 Pct.
Marketing
Closed loop
Churn Rate Reduction in 24 Months
136 USD
Subscriber CLV captured
Precision Rate : 77.0%
Recall Rate : 49.1%
Warning Period : 4 Months advance
Project Start
Source: China Operator S, Churn Rate
107. Achieved 2.4% Churn Rate Reduction
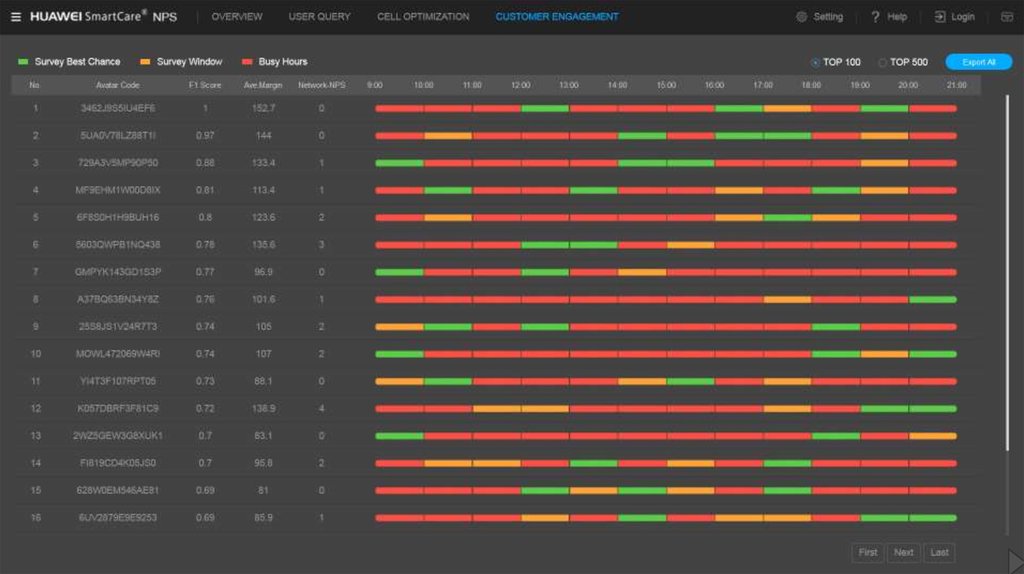
Output108. Output
Data Explorer Demo – Churn109. Data Explorer Demo – Churn
In this demo we monitor all users to identify churners among them110.
More details are available with a list of potential churners for actions111.
Churn Cause Analysis helps to identify Root Causes for churners112.
The group to addressfirst
Different value groups show customers that bring more value to address them first
113.
Even the most preferred communication channel identified & recommended114.
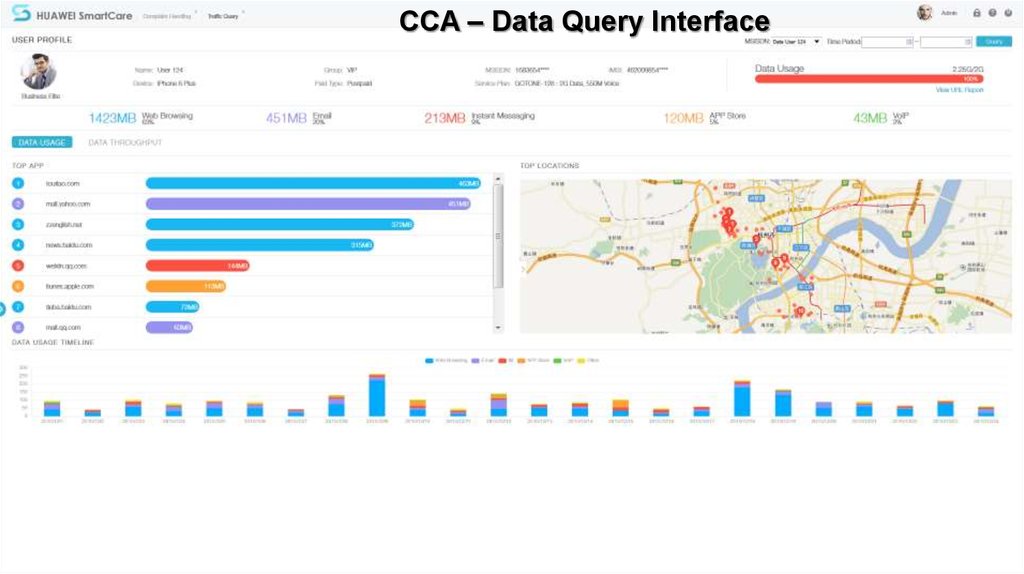
Customer Care Assistance Module115. Customer Care Assistance Module
CCA – Call Center Agent Interface116.
CCA – Data Query Interface117.
118.
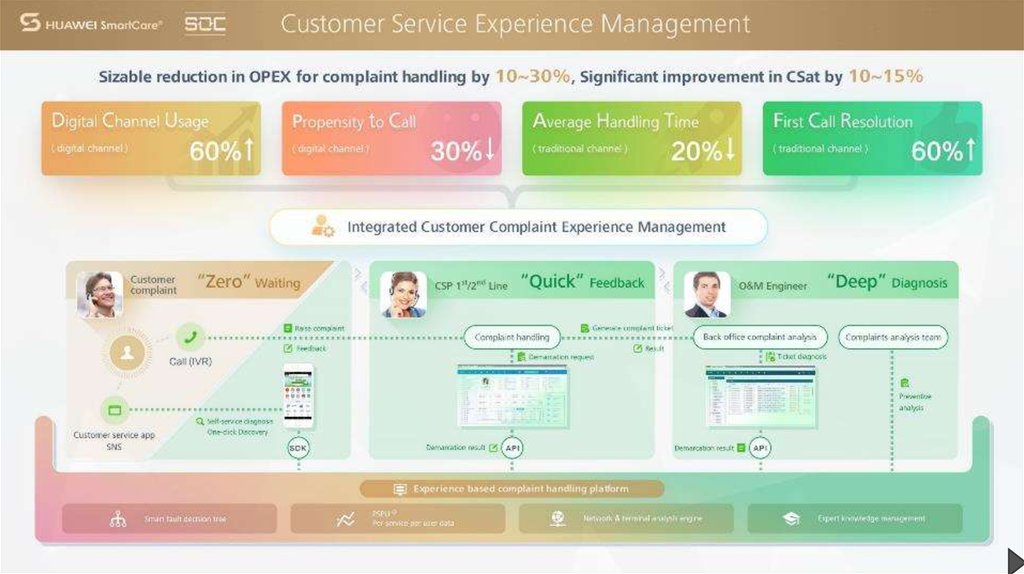
SOC to close the loop in the whole Customer Lifecycle Journey119. SOC to close the loop in the whole Customer Lifecycle Journey
Service Centric Operations -> Network + ServiceSOC
Benefits
Experience
Service
KQI
Content
CSAT
NOC
Network
SLA
Service Quality Monitoring
Service Quality Alarm
Consolidation
Closed-loop complaint
handling
KQI Demarcation for Data
Service
VIP Care
Partner with Customer Care
Fast Response to New Service
launch
…..
NPS
+
KPI
MTTR
120. Service Centric Operations -> Network + Service
External Operation Driven By SOCCustomers
Service
Centric
Customer
Centric
Sales Account
Management
Marketing
Planning
& Engineering
Network
Centric
Service
Operation
Center
(SOC)
Customer
Care
First Time Fault
Resolution
VIP Care
Visibility
User
Visibility
3rd Party
Service
Providers
Precise Fault
Demarcation
Service
Visibility
Terminal
Visibility
Network
Visibility
NOC
Telecom & IT Networks
Organization
Processes
Tools
Attract & Retain
Customers
SMART CAPEX
Investments
Increase
Resource
Utilization
121. External Operation Driven By SOC
Example of NOC-SOC SynergySOC
NOC
SQDT Related Service Alarms
No
Service Quality
Monitoring &
Reporting
Service Problem
Demarcation
SQDT
(User & Service Impact)
Create new TT and
correlate with SQDT
Ticket
Exists
Troubleshooting &
Resolution based on
TT
Yes
SQDT
User & Service Impact Request
Verification
Prioritize Ticket
based on Service
Impact
Override TT with
Service Impact
information from
SQDT
122. Example of NOC-SOC Synergy
Service Operation Centre will enhance customer life cyclemanagement towards Buying & Sharing Domains
Huawei has delivered already 30+ SOC over the world
123
123. Service Operation Centre will enhance customer life cycle management towards Buying & Sharing Domains
Separator124. Separator
Value-Experience Matrix Migration Result in Operator XValue-Experience Matrix
CEI
41%
40
%
33%
14%
Average Payload per user
(MB)
Subscriber are shifting towards good customer experience and inline with the
customer lifecycle to grow more traffic volume
5.27
Data Traffic usage per user
2.91
increase by 80%
before
after
NQI
Customer complaint
Reduced by 50%
Janua
ry
8%
11%
High Value User Traffic
February Marc
h
April
May
June
July
Low Value User Traffic
Before
After
17%
36%
90% Increase in high
Traffic
(GB)
value user data traffic
Value
before
after
1X.x% improvement in revenue
125. Value-Experience Matrix Migration Result in Operator X
Separator126. Separator
General DescriptionUse Case Name:
Enterprise Service Quality Assurance
Description:
For Enterprise Users SLA Assurance, this service will periodically monitor and analyze the KQIs/KPIs of voice and data services used by
different Enterprise Users with whom the carriers have signed service level agreements (SLAs).
Enterprise Users SLA Assurance consists of SLA Task Management, SLA Monitoring, and SLA Analysis.
Benefits:
This Enterprise Users SLA Assurance shows the service quality of Enterprise Users with whom the operators have signed SLAs, helping the
operators to evaluate the fulfillment of SLA commitments to their customers within the validity periods of the SLA contracts.
Improved Enterprise Users satisfaction and loyalty.
Data Source:
Passive probe data
CRM
System Integration:
Passive probes
CRM
Activities:
Enterprise Users SLA Violation Alarm Monitoring
Enterprise Users SLA Violation Demarcation with indicative suggestions
Enterprise Users SLA Violation Tracking and Manage
Enterprise Users SLA Reporting
127. General Description
Solution OverviewCustomer quantity
Traffic analysis
Service KQI analysis
Modeling analysis
User quantity trend
Range-based traffic
distribution
Overall KQI information
Traffic model
User distribution
User quantity trend
Traffic trend
Application-based traffic
distribution
Range-based traffic
distribution
User-based traffic
distribution
KQI trend
Failure cause distribution
TOP VAPs
Traffic model
Abnormal user identification
128. Solution Overview
MethodologyEC
Failure cause identification
Exception statistics
service
RAN problem locating and
optimization
Terminal
problem
analysis
RAN problem
analysis
CN problem
analysis
quality
monitoring
Is the problem
resolved?
Problem locating and
optimization by network
Management departments
Demarcation and analysis of
service quality-related problems
Problem
import
Failure xDR analysis
Original signaling analysis
SP
problem
analysis
CN problem locating and
optimization
Terminal problem locating
and optimization
SP problem locating and
optimization
KPIs and xDR are analyzed and problem scenarios are reproduced to quickly locate and isolate problems.
129. Methodology
Best PracticeEnterprise service monitoring
Service failure analysis
EC monitoring information
Customer name: Shanghai LKL
Counter name: PDP active success rate
Date: 2013/11/12
Location: Shanghai
Exception: PDP active success rate abruptly drops by
10% after 15:00.
Failure analysis results
Failure category: Wireless access failure is the main category,
accounting for 68%.
Trend of PDP Activation Success Rate
In-depth drilling analysis
Analysis on the long duration of 1000 RAB assignment time
Analysis Period: (15:00 – 16:00)
Cause Category: Long duration of 1000 RAB assignment is the
main cause.
Failure Analysis on PDP Activation Success Rate
Conclusion
Long duration of wireless RAB assignment time is the main
reason that causes PDP active success rate exception after
15:00 in Shanghai LKL on November 12, 2013. Wireless
access failure mainly occurs in 3G01_Site4_Cell1.
NOC team is advised to check wireless access RAB counter in
3G01_Site4_Cell1 and further locate the problem.
The monitoring result shows the problem, and then the problem can be gradually demarcated through multi-dimensional failure analysis.
130. Best Practice
Separator131. Separator
Digitizing Customer Care132. Digitizing Customer Care
133. Digitizing Customer Care
134. Digitizing Customer Care
135. Digitizing Customer Care
Separator136. Separator
Persona–based Experience Assurance137. Persona–based Experience Assurance
138. Persona–based Experience Assurance
139. Persona–based Experience Assurance
Separator140. Separator
Scope of Pilot – Use Case DeliveryNo.
Use Case Name
1 Customer complaint handling
Description
Implement Customer Care system integration with SQM system, help Call Center agents
L1/L2 quickly make reply to complaint calls, decrease FCR, improve complaint handing
efficiency
Integration with Megafon HPSM system to improve compliant handling efficiency
2 Proactive monitoring and problem
resolution
Proactive monitoring of service quality of Megafon Moscow mobile network in different
dimensions, such as cell level, network level, location level, etc.
Quick problem demarcation and root cause resolution for service quality problems
3 Real-Time Monitoring of VIP &
super-VIP subscribers
Real-time (5 minutes) proactive monitoring of service quality problems for VVIP users
Quick problem demarcation root cause resolution for service quality problems
4 B2B clients SLA monitoring
Proactive monitoring of B2B users service quality problems violating SLA
Quick problem demarcation and root cause resolution for service quality problems
5 Analysis of Terminals
Analysis reports of terminal ranking in brands, traffic, service qualities, etc.
Customized reports
5 Use Cases supporting operation & maintenance has been defined as the scope of Use Cases delivered in pilot
There is also planned Churn and NPS detractors analytics after 4 months of collected data.
HUAWEI TECHNOLOGIES CO., LTD.
Huawei proprietary. No spread without permission.
Page 141
141. Scope of Pilot – Use Case Delivery
Milestones & ProgressWe Are Here
Jan
Feb
01.01 01.13 02.01
Mar
03.01
Apr
04.0
Platform Installation,
Commissioning
May
Sep
Oct
Nov
05.01
09.01
10.01
11.01
Suspended
Cutover
Power-on & 3.1
Upgrade
3.1 upgrade is
completed
Cutover got started on Apr 18,
almost done, data check work
didn’t start before project got
stopped
Dec
12.01
Jan
Feb
01.01
02.01
Training
Data Check
Use Case Delivery
& Verification
MGF Test
& Verification
MGF Test
& Verification
MGF Test
& Verification
MGF Test
UC 5 Implementation & Verification
MGF Test
UC 1 Implementation
Complaint Handling
Real-time Monitoring of super VIP customers UC 2 Implementation
B2B clients SLA Monitoring
Proactive monitoring and problem resolution UC 3 Implementation
for own and roaming subscribers
UC 4 Implementation
5. Analysis of Terminal
1.
2.
3.
4.
• MegaFon requested to have preliminary trial results by end of Oct. 2016
• It’s proposed to focus on Use Case 1 Complaint Handling delivery for phase 1, due to limited time left for delivery
HUAWEI TECHNOLOGIES CO., LTD.
Huawei proprietary. No spread without permission.
Page 142
142. Milestones & Progress
Выполненные работы1) Оборудование смонтировано, включено и настроено
2) Программное обеспечение установлено
3) Произведены отладочные работы
4) Завершена интеграция с различными IS/IT системами (CC, NRI, TT)
5) Сформирована и русифицирована экспертная система
рекомендаций для L1/L2
6) Настроена и русифицирована система root cause analysis для L3
7) Проведено обучение сотрудников МегаФон
8) Предоставлен доступ к решению сотрудникам МегаФон
HUAWEI TECHNOLOGIES CO., LTD.
Huawei proprietary. No spread without permission.
Page 143
143. Выполненные работы
Текущие и запланированные работы1) Проверка полноты и целостности входных данных
2) Калибровка KPI/KQI, установка пороговых значений аварий
3) Реализация, имплементация и демонстрация пяти юзкейсов
4) Расширение проб-серверов и установка TDM-конвертеров
5) Передача системы в пользование
6) Подготовка и реализация юзкейсов по анализу NPS и оттока абонентов
7) Интеграция с Metricell Agent
HUAWEI TECHNOLOGIES CO., LTD.
Huawei proprietary. No spread without permission.
Page 144
144. Текущие и запланированные работы
Собираемые KPIVoice:
SMS:
Email:
- Perceived Call Success Rate
- E2E Call Connection Delay
- Perceived Call Drop Rate
- SMS Origination Success Rate
- SMS Origination Delay
- SMS Termination Success Rate
- SMS Termination Delay
- Email Login Success Rate
- Email Login Delay
- Email Send Success Rate
- Email Send Throughput
- Email Download Success Rate
WEB:
MMS:
Streaming:
- Page Response Success Rate
- Page Response Delay
- Page Browsing Success Rate
- Page Browsing Delay
- Page Download Throughput
- MMS Send Success Rate
- MMS Send Delay
- MMS Send Throughput
- MMS Download Success Rate
- MMS Download Delay
- MMS Download Throughput
- Video Streaming Start Success Rate
- Video Streaming Start Delay
- Video Streaming Stall Frequency
- Video Streaming Stalled Time Rate
- Video Streaming Plays
HUAWEI TECHNOLOGIES CO., LTD.
Huawei proprietary. No spread without permission.
Page 145
145. Собираемые KPI
Thank youCopyright©2015 Huawei Technologies Co., Ltd. All Rights Reserved.
The information in this document may contain predictive statements including, without limitation, statements regarding the future financial and operating results,
future product portfolio, new technology, etc. There are a number of factors that could cause actual results and developments to differ materially from those expressed
or implied in the predictive statements. Therefore, such information is provided for reference purpose only and constitutes neither an offer nor an acceptance. Huawei
may change the information at any time without notice.