


 physics
Similar presentations:


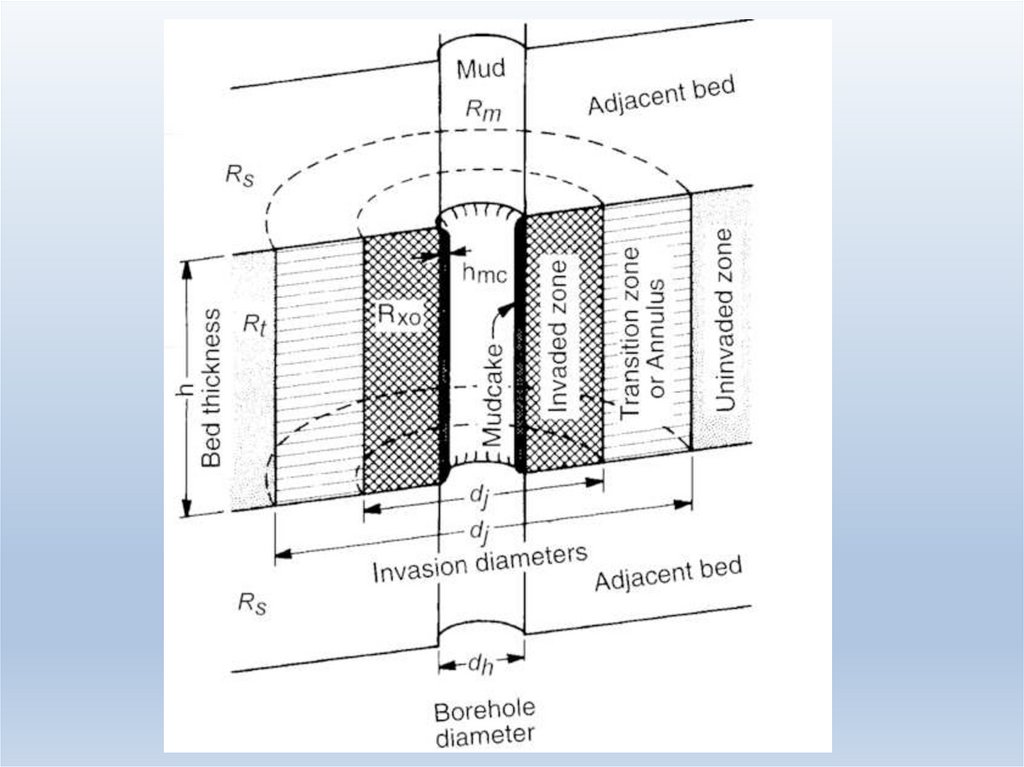
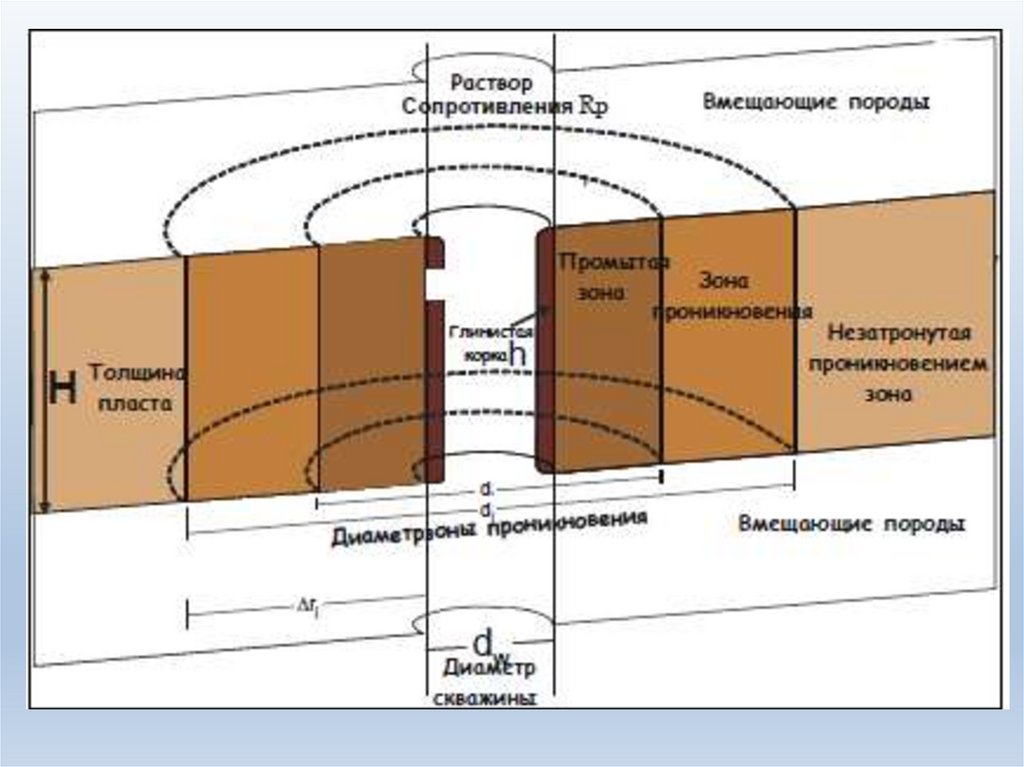
Основы каротажа открытого ствола - Openhole Basics
1.
Основы каротажа открытогоствола - Openhole Basics
Виталий Пасмурнов 2021
2.
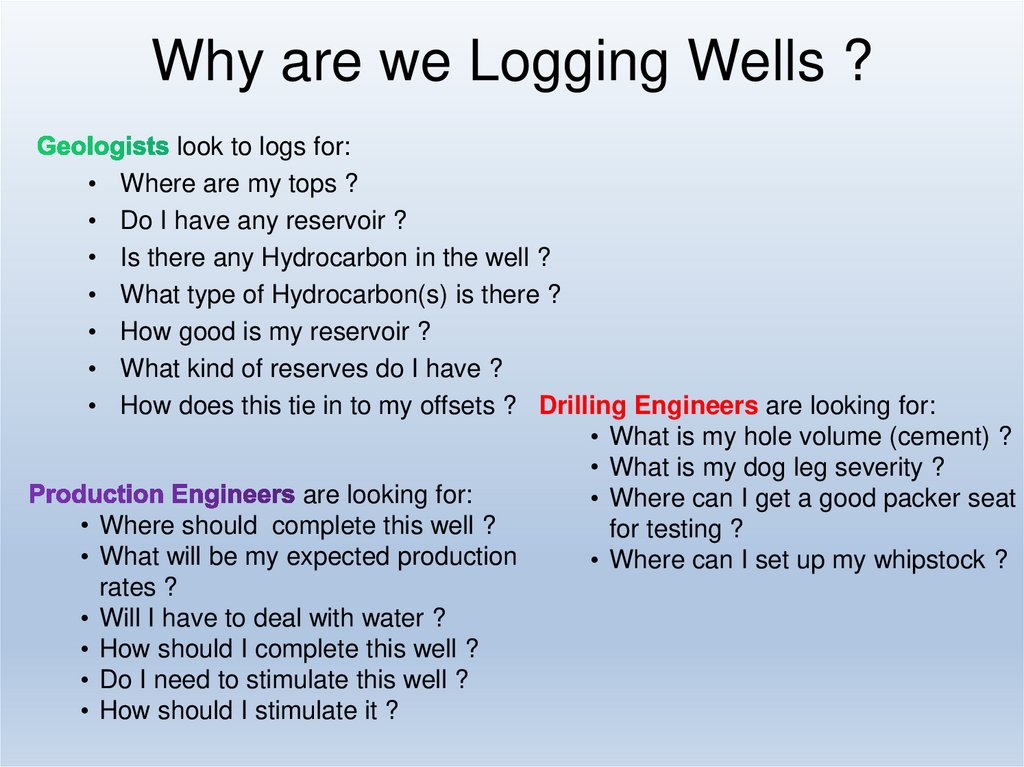
Why are we Logging Wells ?look to logs for:
• Where are my tops ?
• Do I have any reservoir ?
• Is there any Hydrocarbon in the well ?
• What type of Hydrocarbon(s) is there ?
• How good is my reservoir ?
• What kind of reserves do I have ?
• How does this tie in to my offsets ? Drilling Engineers are looking for:
• What is my hole volume (cement) ?
• What is my dog leg severity ?
are looking for:
• Where can I get a good packer seat
• Where should complete this well ?
for testing ?
• What will be my expected production
• Where can I set up my whipstock ?
rates ?
• Will I have to deal with water ?
• How should I complete this well ?
• Do I need to stimulate this well ?
• How should I stimulate it ?
3.
The Gamma Ray Log (ГаммаКаротаж)
Since clays and shales tend to
accumulate radioactive materials,
the gamma ray (GR) log is used as a
shale indicator with a high gamma
ray indicating shale (around 100
GAPI) and low gamma ray indicating
clean formation (~30 GAPI in sands,
0
GAPI
150
Shaly Sand
Shale
Clean Sand
and about ~15 GAPI in carbonates).
Sandy Shale
Limestone
Volcanic Ash
Dolomite
Coal
Anhydrite / Salt
Gypsum
4.
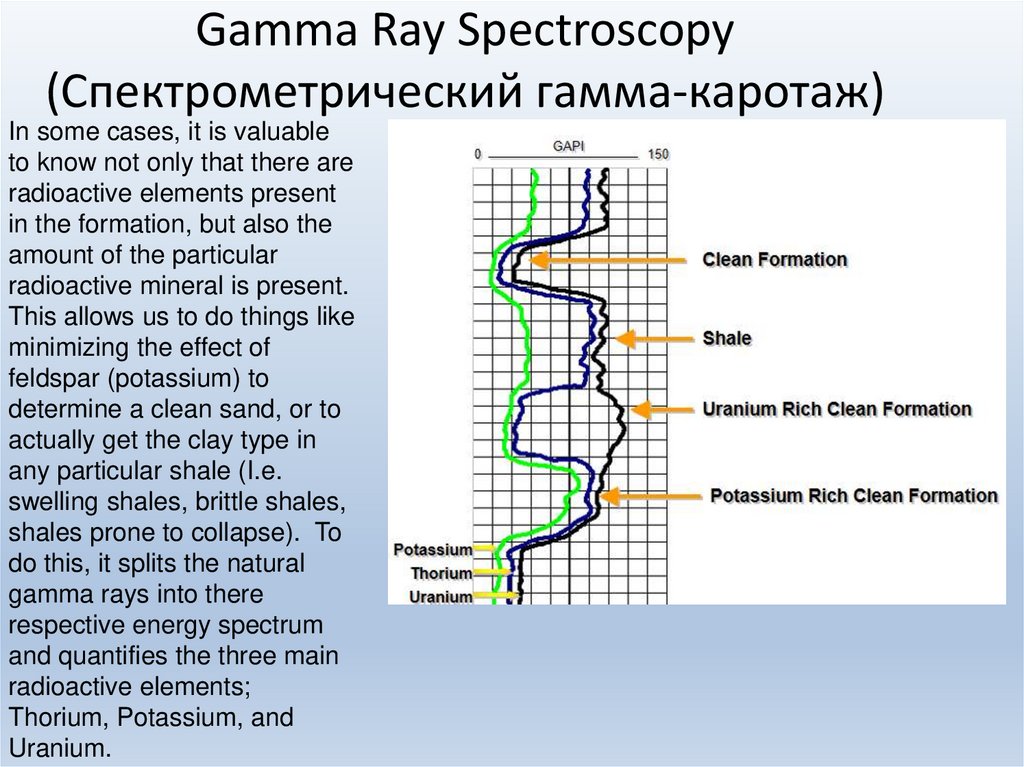
Gamma Ray Spectroscopy(Спектрометрический гамма-каротаж)
In some cases, it is valuable
to know not only that there are
radioactive elements present
in the formation, but also the
amount of the particular
radioactive mineral is present.
This allows us to do things like
minimizing the effect of
feldspar (potassium) to
determine a clean sand, or to
actually get the clay type in
any particular shale (I.e.
swelling shales, brittle shales,
shales prone to collapse). To
do this, it splits the natural
gamma rays into there
respective energy spectrum
and quantifies the three main
radioactive elements;
Thorium, Potassium, and
Uranium.
5.
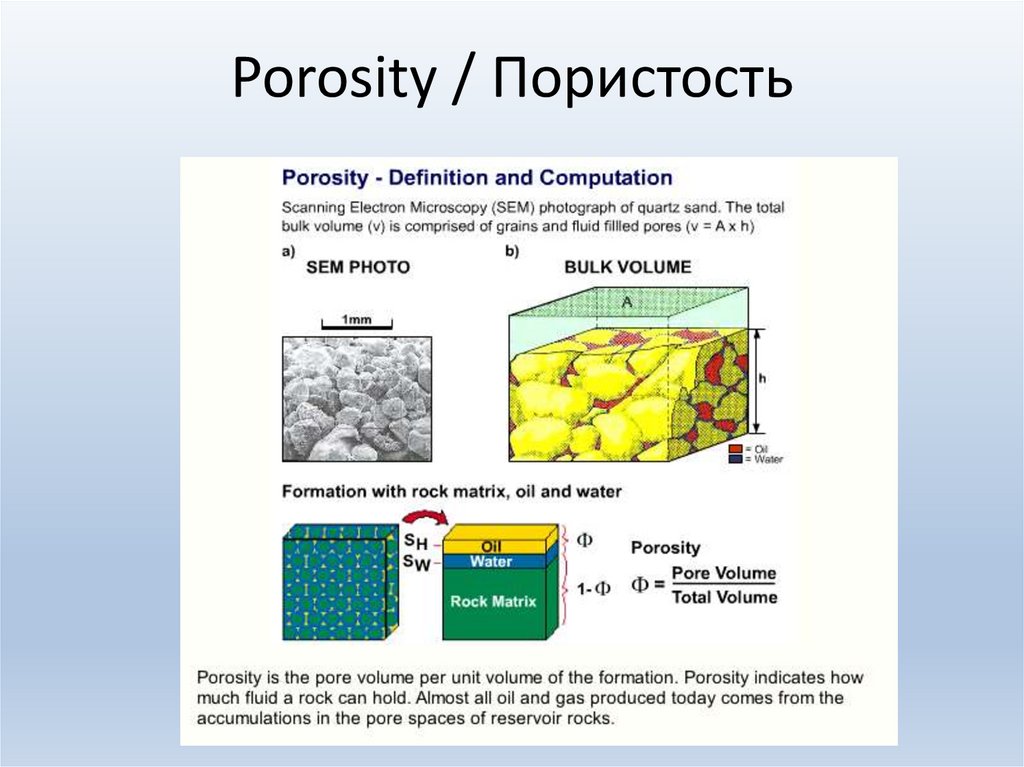
Porosity / Пористость6.
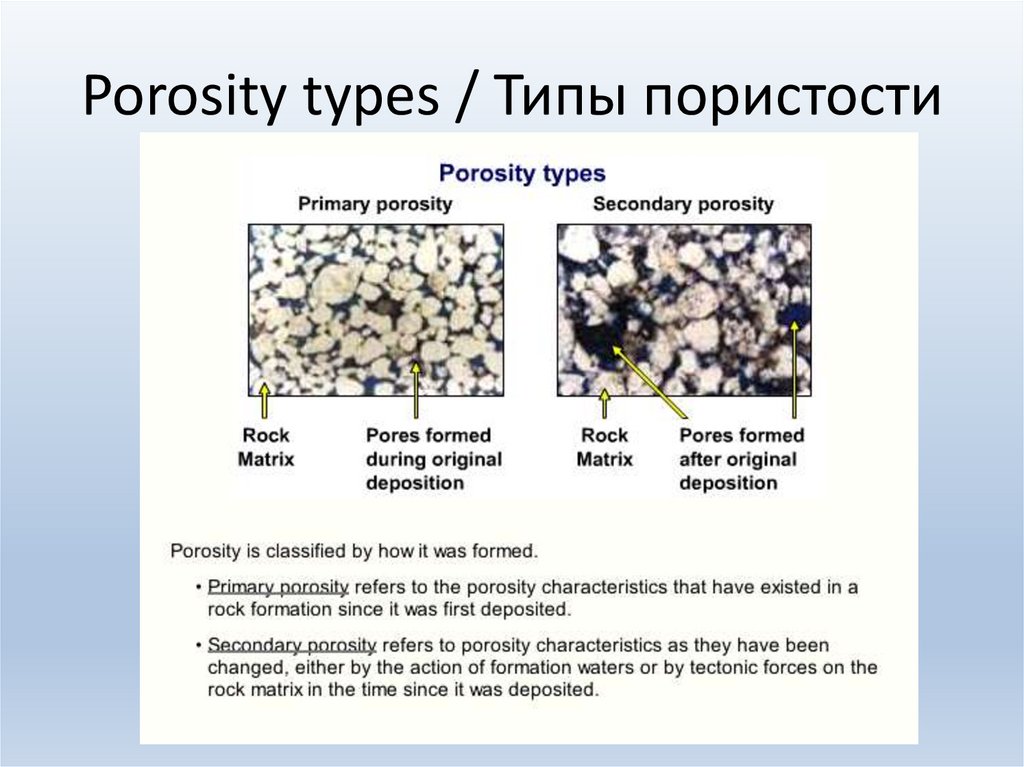
Porosity types / Типы пористости7.
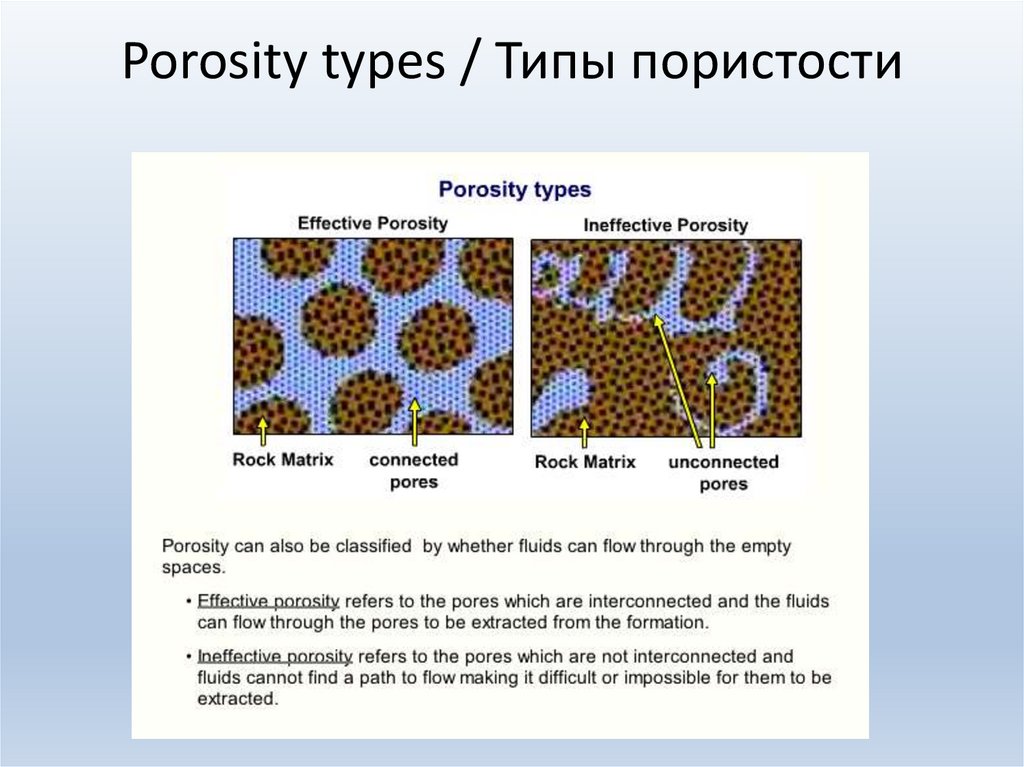
Porosity types / Типы пористости8.
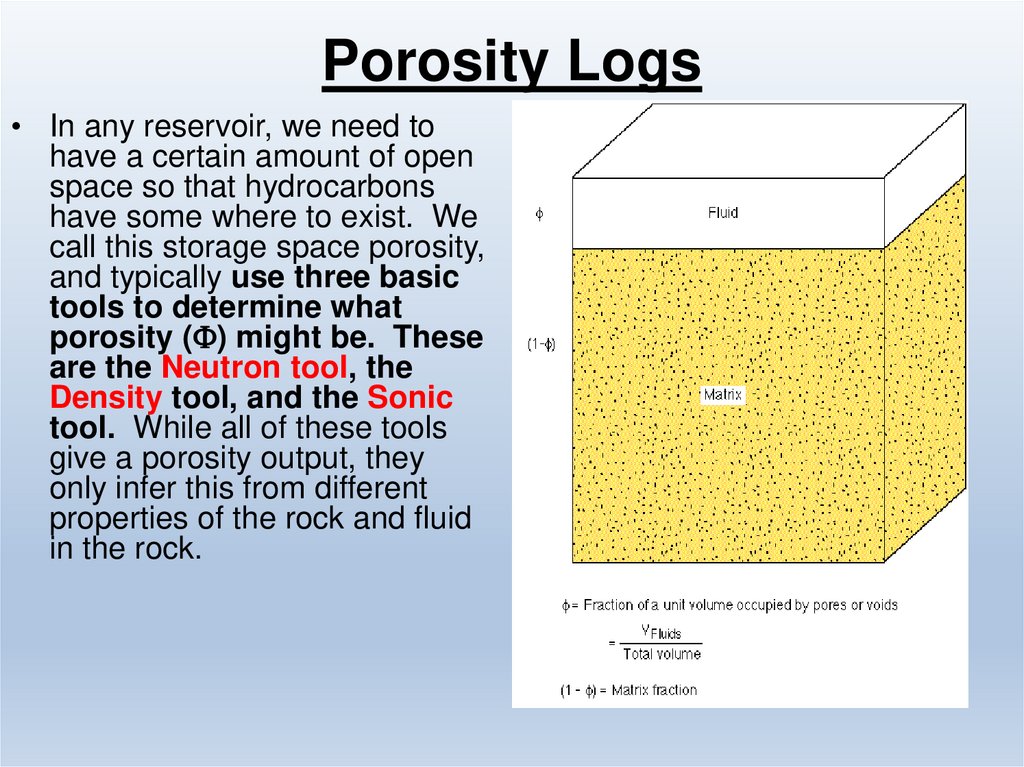
Porosity Logs• In any reservoir, we need to
have a certain amount of open
space so that hydrocarbons
have some where to exist. We
call this storage space porosity,
and typically use three basic
tools to determine what
porosity (F) might be. These
are the Neutron tool, the
Density tool, and the Sonic
tool. While all of these tools
give a porosity output, they
only infer this from different
properties of the rock and fluid
in the rock.
9.
The Sonic Log (Акустический каротаж)The Sonic log, as the name implies, uses the travel time of sound through the formation to infer
porosity. That is, it sends a sound pulse or a ‘click’ out from a transmitter, and then measures
the time it takes to travel through the formation and back to a receiver on the tool. By comparing
how fast the ‘click’ travels through the rock to how fast it should travel if there were no porosity,
and knowing how fast sound will travel through fluid, we can infer a liquid filled porosity.
F=(tLOG-tma)/(tf-tma)
Where:
F = porosity
tLOG=s onic travel time read from the log
tma= sonic travel time in a clean 0 porosity
matrix
tfl= sonic travel time in the wellbore fluid
Sand
Dt = 182 ms/m
Limestone
Dt = 156 ms/m
DolomiteDt = 143 ms/m
Anhydrite
Dt = 164 ms/m
Fresh muds
Dt = 620 ms/m
10.
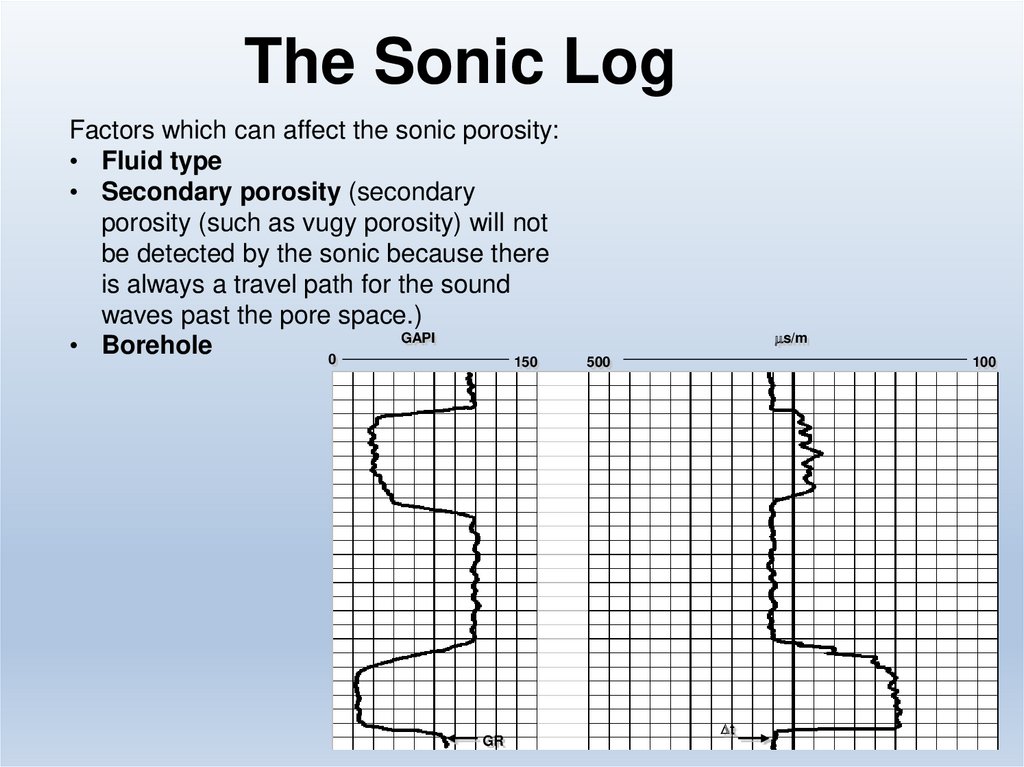
The Sonic LogFactors which can affect the sonic porosity:
• Fluid type
• Secondary porosity (secondary
porosity (such as vugy porosity) will not
be detected by the sonic because there
is always a travel path for the sound
waves past the pore space.)
GAPI
• Borehole
0
150
GR
ms/m
500
100
Dt
11.
The Neutron Log (Нейтронный каротаж)The neutron tool uses the amount of hydrogen in a formation to infer porosity. Since water
/ oil has a relatively constant amount of hydrogen atoms by volume, the amount of
hydrogen can be used to infer the amount of fluid in a formation, which in a clean
formation is the porosity.
The Neutron log is presented in porosity units based on a particular matrix type
(sandstone, limestone, or dolomite). Since the amount of neutron absorbers in the
formation greatly affect the porosity readings of the log, it is essential that the correct
matrix be used.
GAPI
%
0
150
60
0
Limestone
GR
NPOR
12.
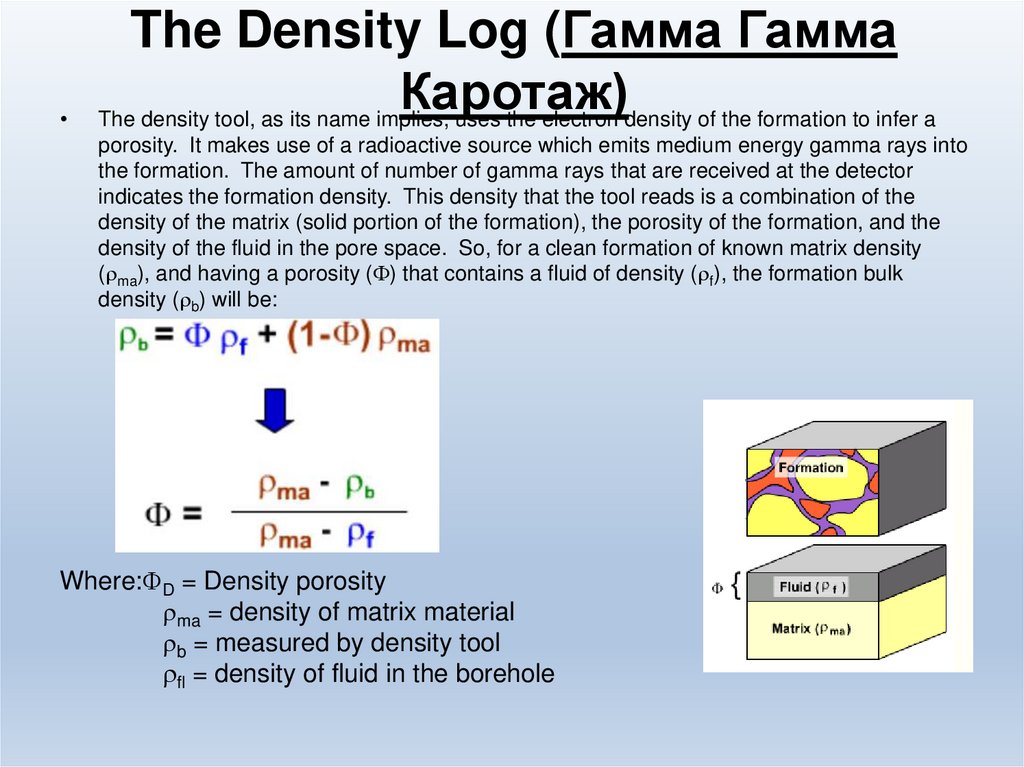
The Density Log (Гамма Гамма
Каротаж)
The density tool, as its name implies, uses the electron density of the formation to infer a
porosity. It makes use of a radioactive source which emits medium energy gamma rays into
the formation. The amount of number of gamma rays that are received at the detector
indicates the formation density. This density that the tool reads is a combination of the
density of the matrix (solid portion of the formation), the porosity of the formation, and the
density of the fluid in the pore space. So, for a clean formation of known matrix density
(rma), and having a porosity (F) that contains a fluid of density (rf), the formation bulk
density (rb) will be:
Where:FD = Density porosity
rma = density of matrix material
rb = measured by density tool
rfl = density of fluid in the borehole
13.
The Density LogIn addition to the bulk density measurement, the toll also measures the photoelectric
absorption index, which can be related to lithology. The photoelectric absorption
factor is presented on the log as a PEF curve and can be used in conjunction with
the bulk density to indicate the matrix type
GR
Sandstone
Limestone
Dolomite
PEF ~ 1.8
PEF ~ 5.1
PEF ~ 3.1
PEF
DPHI
RHOB ~ 2650 Kg/m3
RHOB ~ 2710 Kg/m3
RHOB ~ 2850 Kg/m3
14.
Factors that may effect the Density Log• Lithology
• Fluid type
• Oil; residual oil will drive the density porosity high.
• Salt water will drive the density porosity low
• Gas; residual gas will drive the porosity reading high.
• Borehole effect
15.
Total Porosity DeterminationSo, which porosity measurement should be used? Depending on the
formation and the tools available, we use the following.
In a sand shale sequence, for initial computations:
– If Fn is available, use FTotal = FN
– If only Dt are available, use FTotal = FS with compaction corrections.
In a carbonate, for initial computations:
– If FN and FD are available, then use FTotal = (FN+FD)/2
– If only Dt is available, use FTotal = FS + Estimated FVugs
16.
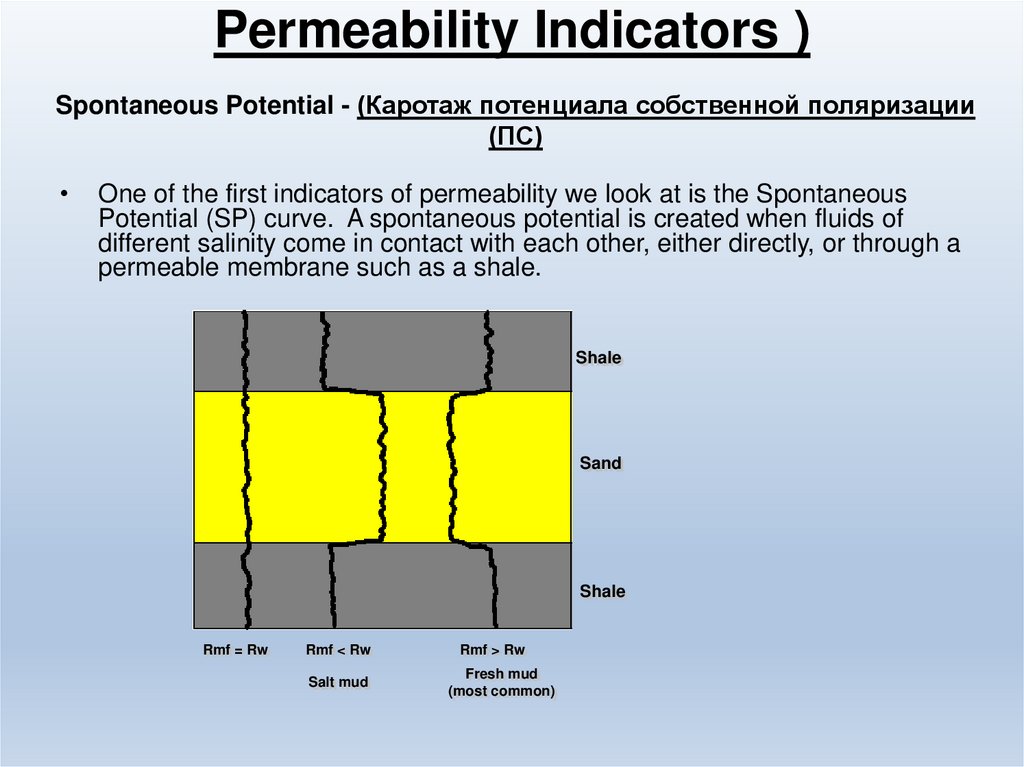
Permeability Indicators )Spontaneous Potential - (Каротаж потенциала собственной поляризации
(ПС)
One of the first indicators of permeability we look at is the Spontaneous
Potential (SP) curve. A spontaneous potential is created when fluids of
different salinity come in contact with each other, either directly, or through a
permeable membrane such as a shale.
Shale
Sand
Shale
Rmf = Rw
Rmf < Rw
Salt mud
Rmf > Rw
Fresh mud
(most common)
17.
Permeability IndicatorsMicrolog and Caliper (Микробоковой каротаж)
The Microlog tool measures resistivity at two depths, then compares them to indicate permeability. If
there is permeability, then mudcake should build up. Therefore, the shallow reading on the microlog
(Microinverse) will read the mud cake (generally lower) and the deeper reading (Micronormal) will read
the invaded formation (generally higher) producing a positive curve separation.
Another good indicator of permeability is the caliper device. Since permeability produces mudcake, the
borehole should be constricted where a permeable formation is
OHMm
0
20
Micorinverse
SP
GR
Caliper
Bit Size
Micronormal
18.
So, we now have a clean, porous,permeable formation. All we have to do now
is find out what will come out of it.
19.
20.
21.
What is Resistivity ? Что такоеУдельное Сопротивление?
• Resistivity is a physical property of a substance
• Resistivity is the resistance of a conductive material 1 m
long with a cross sectional area of 1 m2.
22.
23.
24.
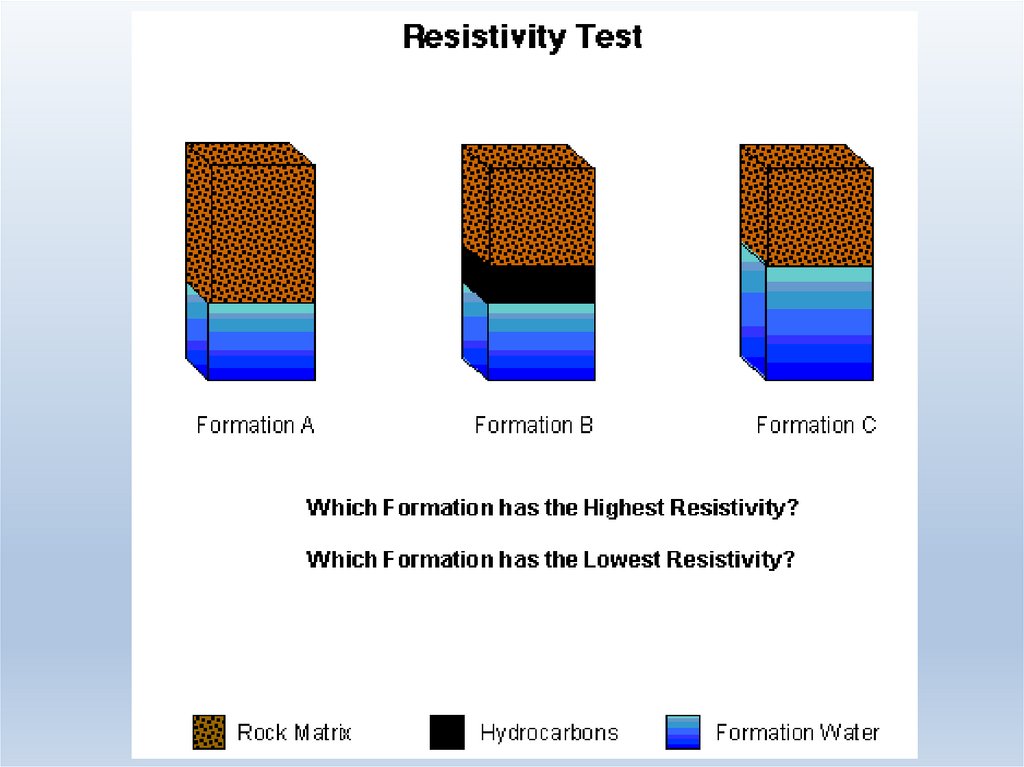
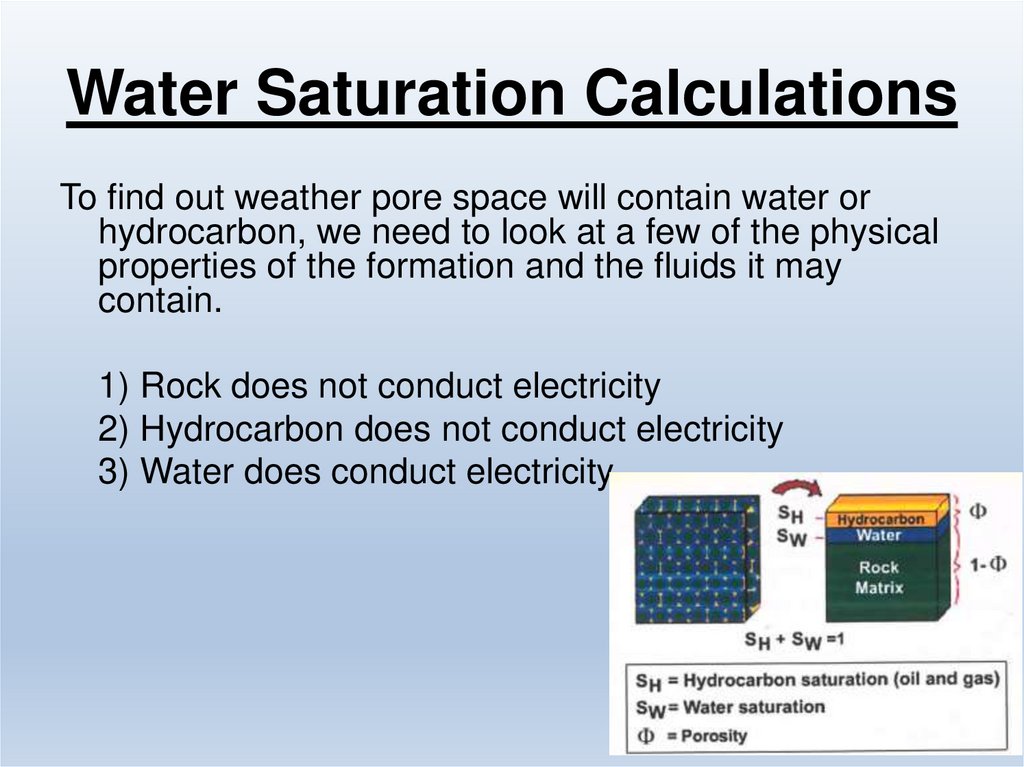
Water Saturation CalculationsTo find out weather pore space will contain water or
hydrocarbon, we need to look at a few of the physical
properties of the formation and the fluids it may
contain.
1) Rock does not conduct electricity
2) Hydrocarbon does not conduct electricity
3) Water does conduct electricity
25.
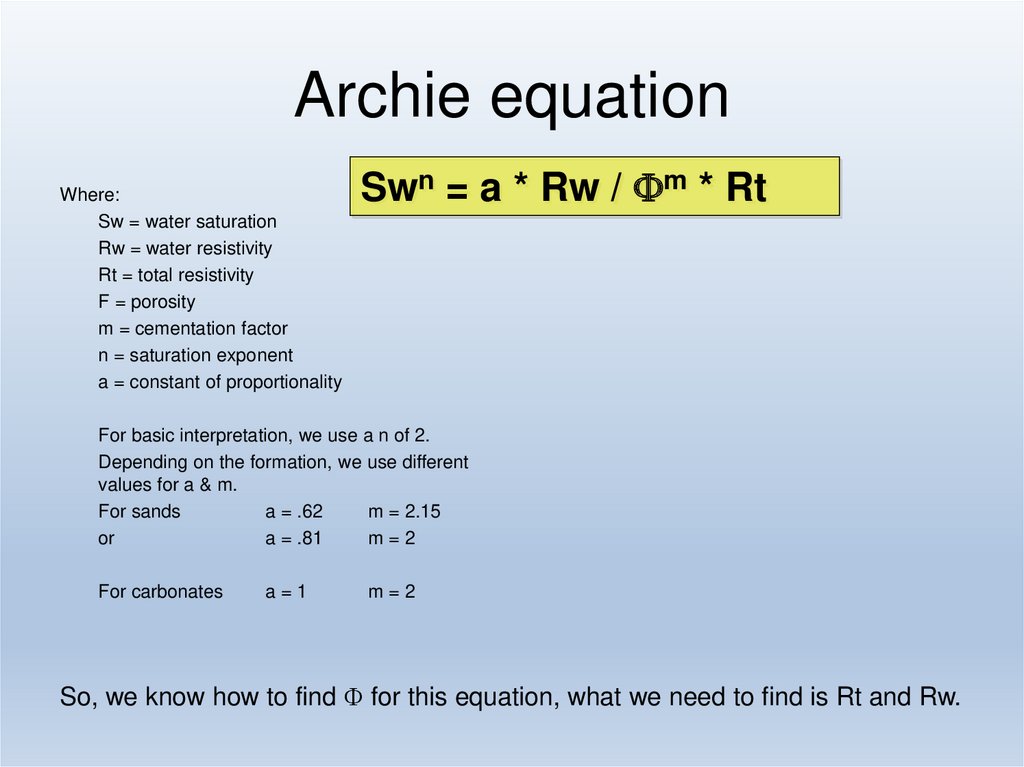
Archie equationWhere:
Sw = water saturation
Rw = water resistivity
Rt = total resistivity
F = porosity
m = cementation factor
n = saturation exponent
a = constant of proportionality
Swn = a * Rw / Fm * Rt
For basic interpretation, we use a n of 2.
Depending on the formation, we use different
values for a & m.
For sands
a = .62
m = 2.15
or
a = .81
m=2
For carbonates
a=1
m=2
So, we know how to find F for this equation, what we need to find is Rt and Rw.
26.
Resistivty ToolsResistivity tools are tools that directly or indirectly
measure the resistivity of a formation. Tools that
measure this directly are generally called
Laterolog tools, and tools that induce current to
flow in the formation are called Induction tools.
Overlaying in
shale
The resistivity of the formation, if read deep
enough to eliminate any effects of the borehole
and invasion, is then the Rt in the Archie equation.
Generally, we use the deepest reading of the
induction or laterolog tool to estimate Rt.
Following order in
permeable zones
27.
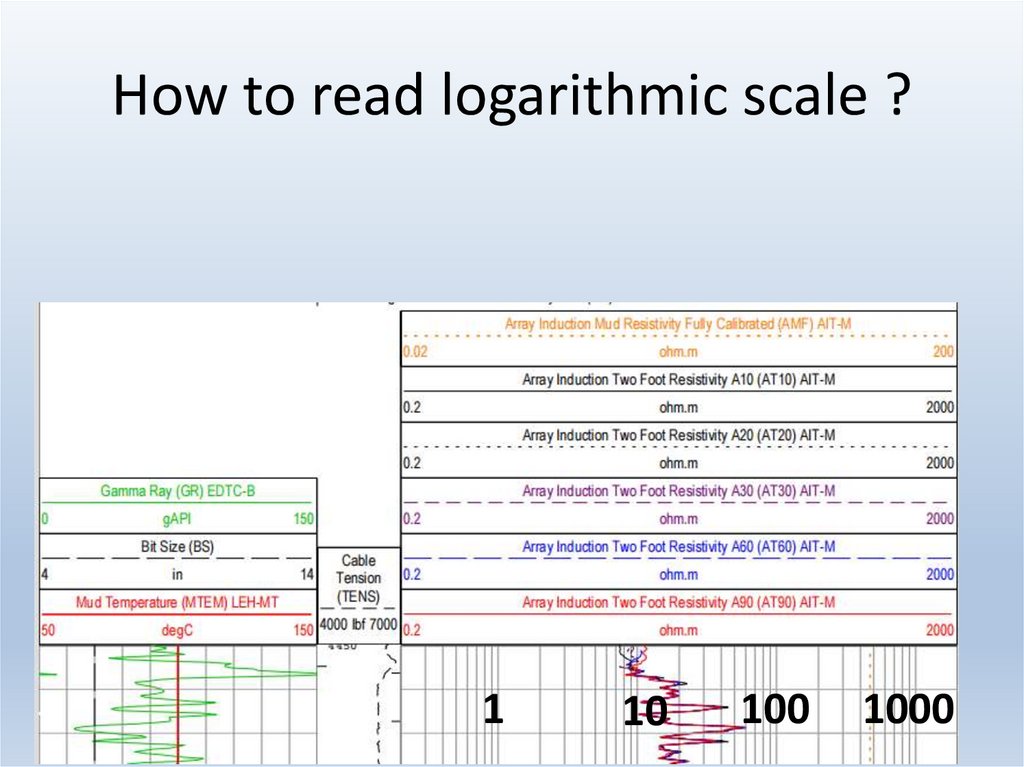
How to read logarithmic scale ?1
10
100
1000
28.
Formation Water ResistivityChart book (if you know salinity and
temperature).
By using actual water sample from the
well
One more method can be used if there is
a clean, 100% wet zone present nearby.
In this case (using the Archie equation)
Swn = a * Rw / Fm * Rt
Sw=1
Rw = Fm * Rt
29.
Quick Look Method for EvaluatingWireline Logs
1) Pick out all the zones that are not shale using the GR
2) Use the porosity log to pick the zones in step 1 that are porous
Sandstone - use the density log if possible
- eliminate all zones with <9% porosity
Carbonate
- use the neutron and density porosity's
- eliminate all zones with <3% porosity
3) For zones left from step 2, pick the zones that are permeable using the SP (and / or any of the
other methods)
4) From the zones left from step 3, pick out the zones with high resistivity. These should be your
Hydrocarbon bearing zones.
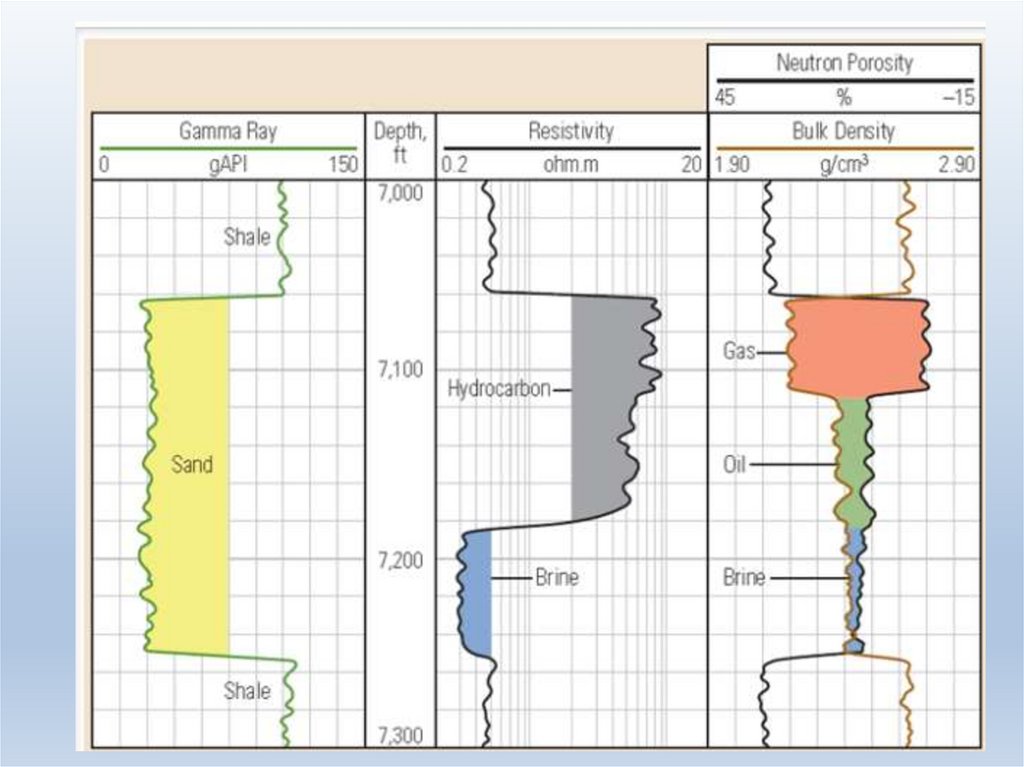
5) We now have our zones of interest. The Neutron and Density (or neutron/sonic) logs can be used
to identify gas zones (cross over).
6) Water Saturation Calculations
for sands
Sw =
(.62 * Rw)/(F2.15 * Rt)
for carbonates
Sw =
(1 * Rw) / (F2 * Rt)
30.
Will it Produce ??In Sandstones
If Sw > 0.35
Usually no water will be produced; only
hydrocarbon.
If Sw = 0.6 - 1.0
The Zone will produce only water.
In Carbonates with Vugy Porosity
If Sw = 0.1
The zone will produce only
hydrocarbon.
If Sw = 0.35 - 1.0 The zone will produce only water.
31.
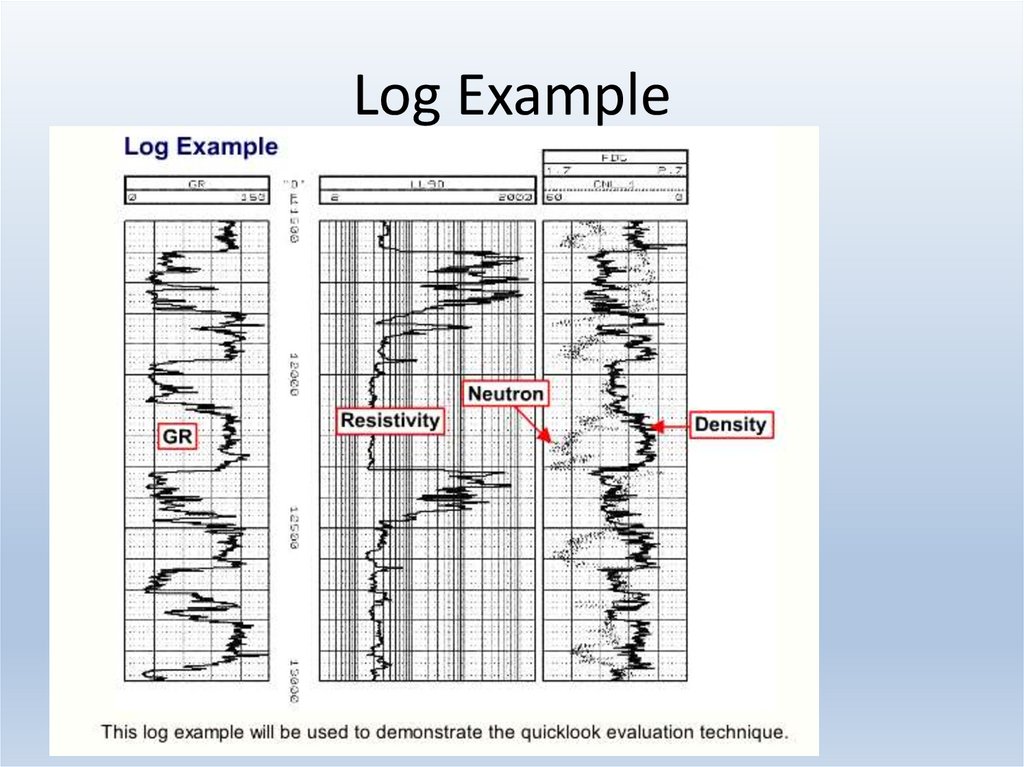
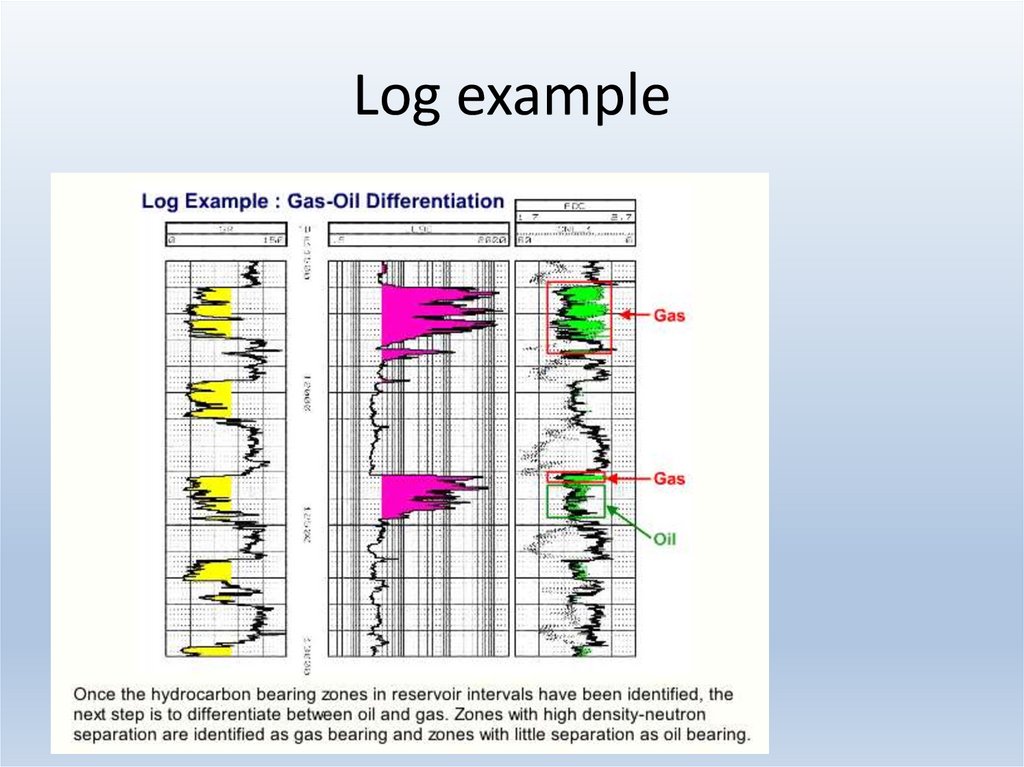
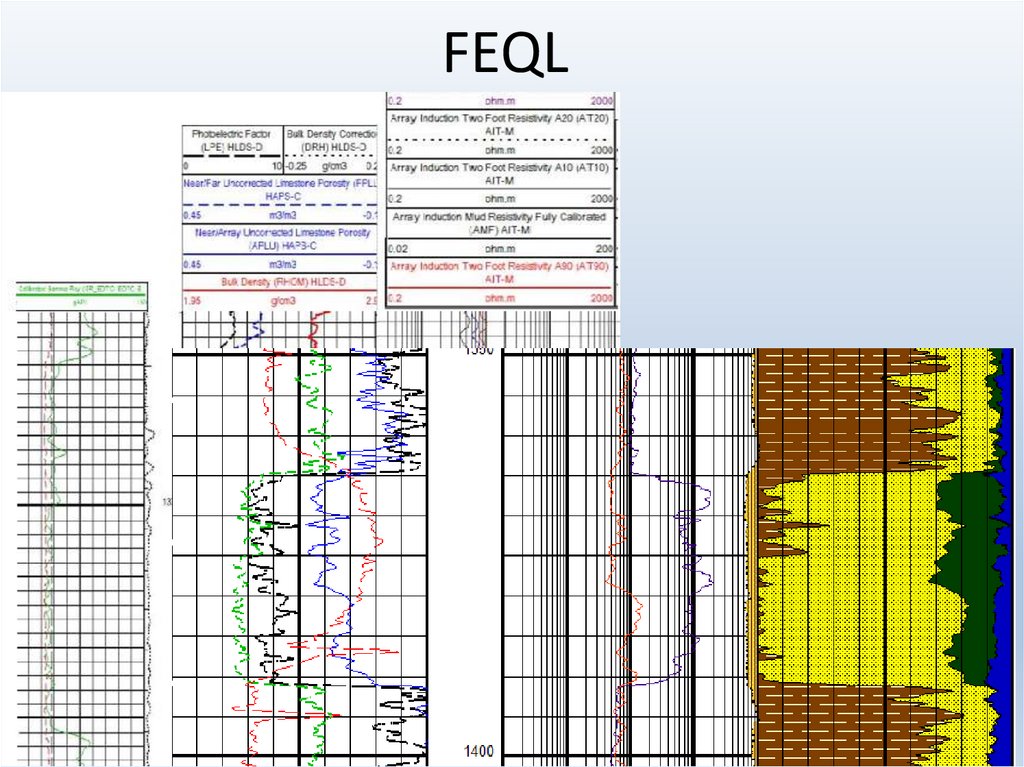
Log Example32.
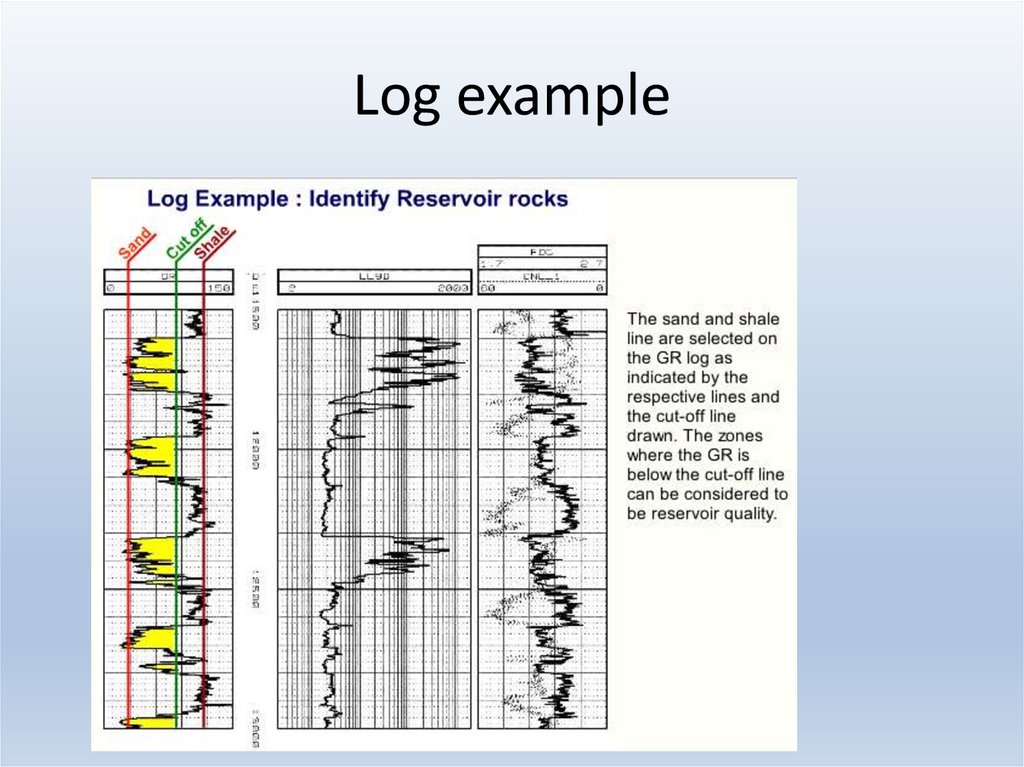
Log example33.
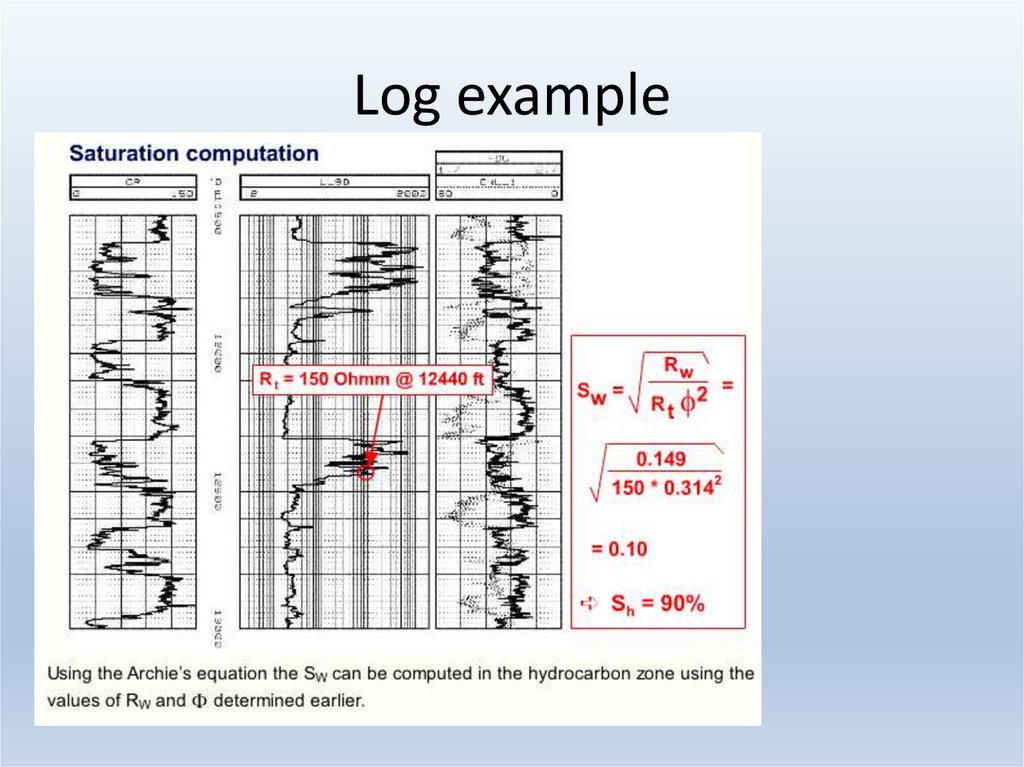
Log example34.
Log exampleLog example
35.
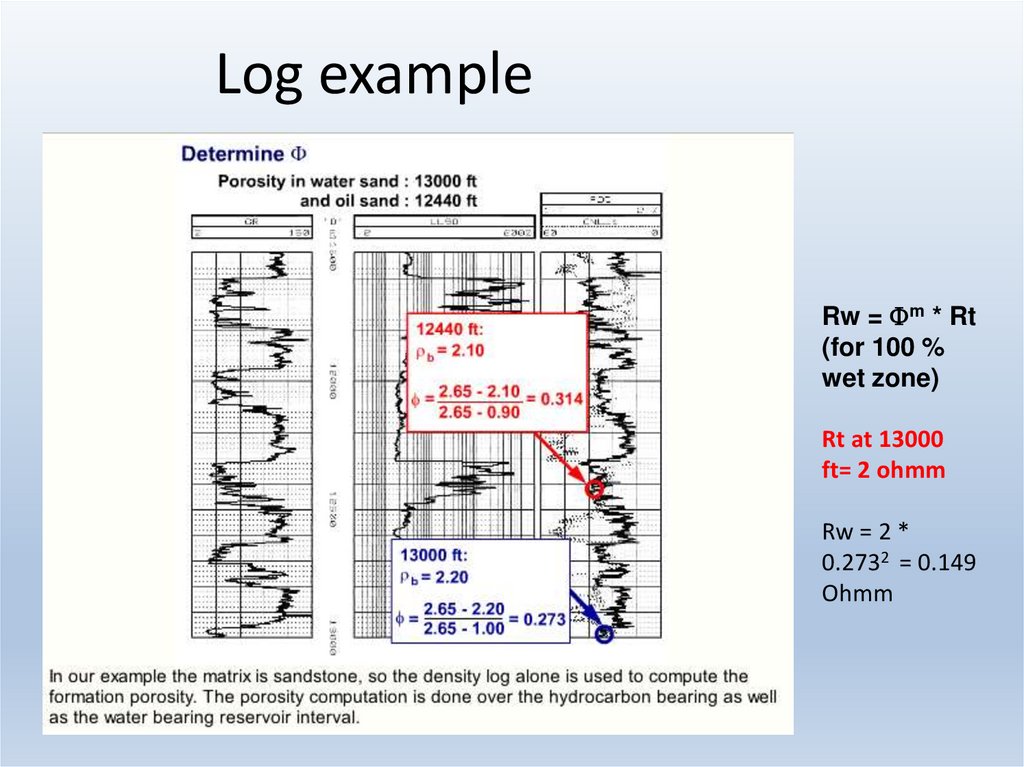
Log exampleRw = Fm * Rt
(for 100 %
wet zone)
Rt at 13000
ft= 2 ohmm
Rw = 2 *
0.2732 = 0.149
Ohmm
36.
Log example37.
38.
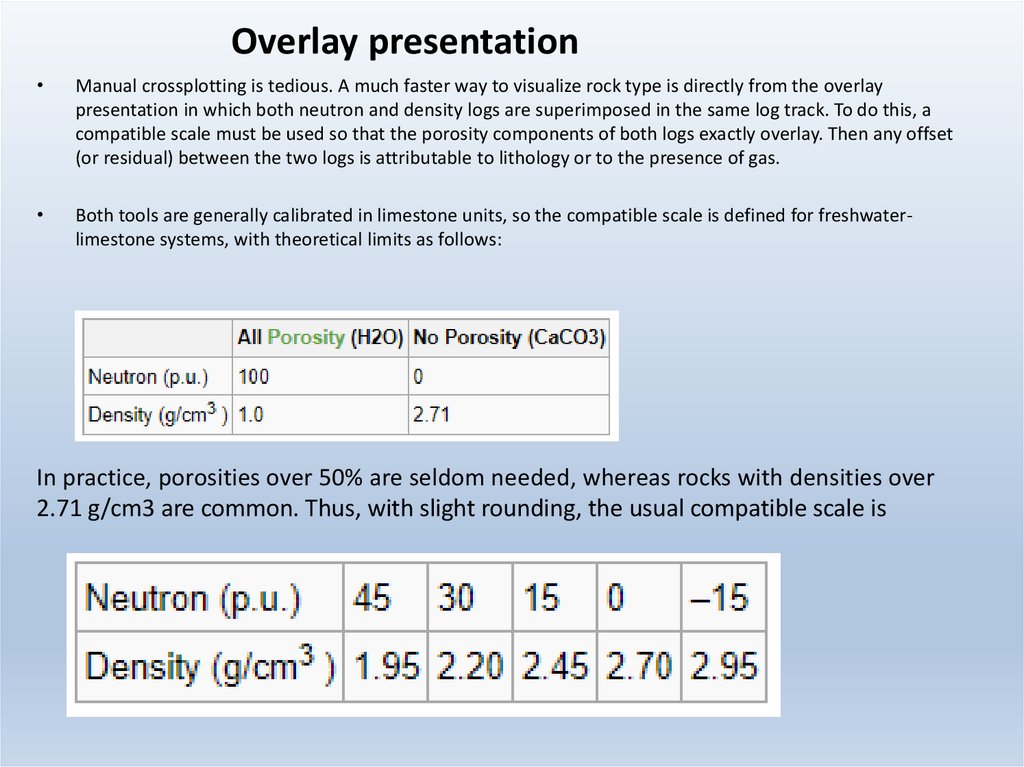
Overlay presentationManual crossplotting is tedious. A much faster way to visualize rock type is directly from the overlay
presentation in which both neutron and density logs are superimposed in the same log track. To do this, a
compatible scale must be used so that the porosity components of both logs exactly overlay. Then any offset
(or residual) between the two logs is attributable to lithology or to the presence of gas.
Both tools are generally calibrated in limestone units, so the compatible scale is defined for freshwaterlimestone systems, with theoretical limits as follows:
In practice, porosities over 50% are seldom needed, whereas rocks with densities over
2.71 g/cm3 are common. Thus, with slight rounding, the usual compatible scale is