


 ecology
Similar presentations:


")


Forests, agriculture and climate
1. Forests, Agriculture, and Climate
2. Forestry and Agriculture as a Percent of Total Greenhouse Gas Emissions
Fossil fuel supply5%
Waste
3%
Building
8%
Power Supply
21%
Power Supply
Industry
Forestry
Transport
13%
Agriculture
Transport
Industry
19%
Agriculture
14%
Building
Fossil fuel supply
Waste
Forestry
17%
Source: Figure adapted from UN Framework Convention on Climate Change , UNFCCC 2007
3. Sources and Flows of Greenhouse Gases
Figure source: World Resource Institute (WRI), can be accessed at http://cait.wri.org/figures.php?page=/World-FlowChart4. Designated Functions of Forests, 2010
Unknown16%
Other
7%
Production
29%
Production
Protection of soil and water
Conservation of biodiversity
Social services
Multiple use
Other
Multiple use
24%
Unknown
Conservation of
biodiversity
12%
Protection of soil
and water
8%
Social services
4%
Source: Global Forest Resources Assessment, by Food and Agriculture Organization of the United Nations, FAO 2010
5. Forests as Carbon Stocks and Carbon Fluxes
(1 tonne Carbon equivalent = 3.667 tonnes CO2) per yearSource: CIFOR, World Agroforestry Centre and USAID 2009 Forest and climate change toolbox [PowerPoint presentation].
Available fromhttp://www.cifor.cgiar.org/fctoolbox/.
6.
7. a. Annual Net Flux of Carbon to the Atmosphere from Land Use Change, South America, Africa, and Asia: 1850-2005
1000,0800,0
Flux (Tg C/Year)
600,0
S+C America
400,0
Trop.Africa
S+SE Asia
200,0
1850
1856
1862
1868
1874
1880
1886
1892
1898
1904
1910
1916
1922
1928
1934
1940
1946
1952
1958
1964
1970
1976
1982
1988
1994
2000
0,0
-200,0
Year
Source: Houghton, R. A. 2008. “Carbon flux to the atmosphere from land-use changes: 1850-2005”. Oak Ridge National Laboratory,
Data are accessible at http://cdiac.ornl.gov/trends/landuse/houghton/houghton.html
8. b. Annual Net Flux of Carbon to the Atmosphere from Land Use Change, Europe, China, Former USSR, and USA: 1850-2005
1000,0800,0
Flux (Tg C/Year)
600,0
Europe
400,0
China
Frmr USSR
USA
200,0
1850
1856
1862
1868
1874
1880
1886
1892
1898
1904
1910
1916
1922
1928
1934
1940
1946
1952
1958
1964
1970
1976
1982
1988
1994
2000
0,0
-200,0
Year
Houghton, R. A. 2008. “Carbon flux to the atmosphere from land-use changes: 1850-2005”. Oak Ridge National Laboratory, Data
are accessible at http://cdiac.ornl.gov/trends/landuse/houghton/houghton.html
9. Social and Ecological Functions of Forests
Tropicalforests,
Cambodia
Unsustainable timber harvest
Traditional forest use
Mangrove
forests,
Thailand
Shrimp farming креветка (мелкая)
Intact ecosystem
Tropical
forests,
Cameroon
Farming
0
500
1000
1500
2000
2500
Sustainable
forestry
3000
3500
4000
Value in dollars per hectare
Source: Costanza, R., et. Al., 1997, “The value of the world's ecosystem services and natural capital” Nature 387.
10. Top Countries with the Largest Forest Area
Source: Global Forest Resources Assessment, by Food and Agriculture Organization of the United Nations, FAO 201011. The World's Forest Coverage
The World's Forest CoverageSource: Global Forest Resources Assessment, by Food and Agriculture Organization of the United Nations, FAO 2010
12. Annual Change in Forest Area by Region, 1990-2010
Source: Global Forest Resources Assessment, by Food and Agriculture Organization of the United Nations, FAO 201013. Annual Change in Forest Area by Country, 2005- 2010
Source: Global Forest Resources Assessment, by Food and Agriculture Organization of the United Nations, FAO 201014.
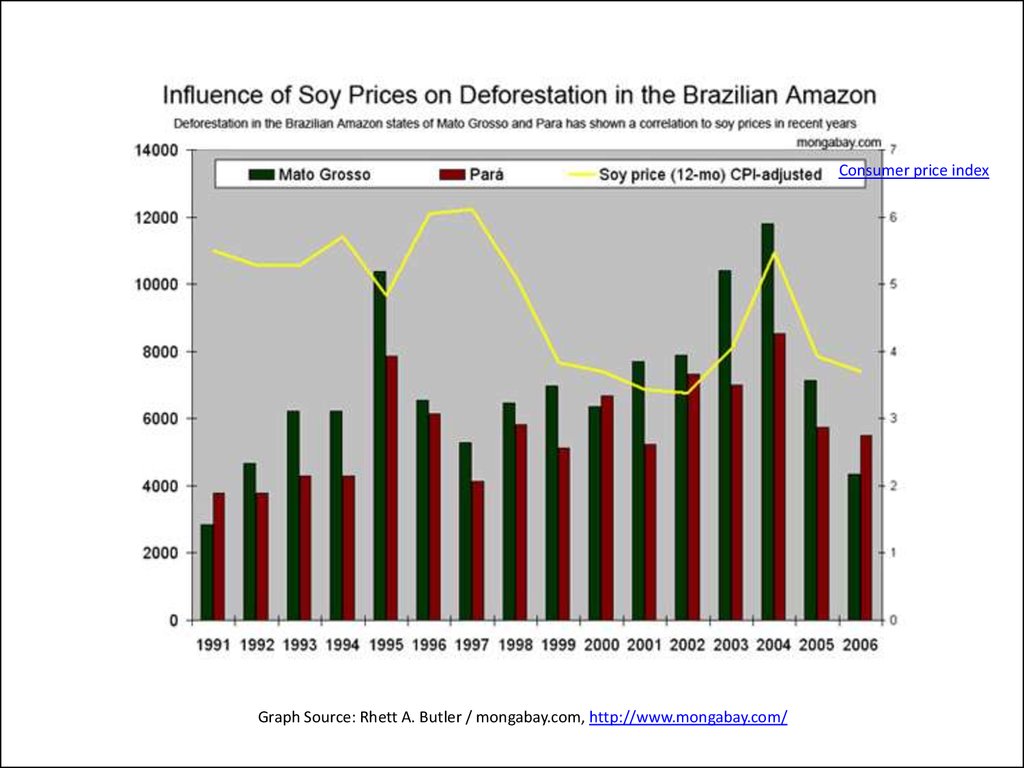
Consumer price indexGraph Source: Rhett A. Butler / mongabay.com, http://www.mongabay.com/
15. Annual REDD Economic Mitigation Potential, 2030
Reducing emission from deforestation and forest degradationSource: IPCC Fourth Assessment Report: Climate Change 2007, Accessible at
http://www.ipcc.ch/publications_and_data/ar4/wg3/en/ch9s9-4-4.html
16. Potential for Carbon Emissions Reduction in Forested Lands
Fraction of total(technical) potential in
Economic potential in 2040
(MtCO2/yr) low
Economic potential in 2040
(MtCO2/yr) high
cost class <20 US$/tCO2
North America
400
820
0.2
Europe
90
180
0.2
Russian Federation
150
300
0.3
Africa
300
875
0.6
OECD Pacific
85
255
0.35
Caribbean, Central and
South America
500
1750
0.6
Non Annex I East Asia
150
400
0.3
Non Annex I South Asia
300
875
0.6
1,975
5,455
Total
Source: Metz et al. 2007a, available at http://www.ipcc.ch/publications_and_data/ar4/wg3/en/ch9s9-4-4.html#table-9-6
17. Global Greenhouse Gas Emissions from Agriculture
кишечныйOrg. fertilizer
Source: World Resource Institute (WRI), accessed 2011
18. Agricultural Greenhouse Gas Emissions by Region Projected to 2020: Developed Nations
GHG emissions in Agriculture (Mt CO2eq./yr)2000
OECD NA
W Eur
1000
FSU
C&U Eur
OECD Pac
0
1990
1995
2000
2005
2010
2015
2020
Source: Smith et al. 2007, 6-28.
Note:; E Asia: developing countries of East Asia; Organization for Economic Co-operation and Development (OECD) Pac: OECD
countries of the Paci c Region; C&E Eur: Central and Eastern Europe; FSU: Former Soviet Union; W Eur: Western Europe; OECD
NA, OECD countries of North America
Organization for Economic Co-operation and Development.
19. Agricultural Greenhouse Gas Emissions by Region, Projected to 2020: Developing Nations
GHG emissions in Agriculture (Mt CO2eq./yr)6000
5000
4000
ME&NA
SSAfrica
3000
S Asia
LA&C
E Asia
2000
1000
0
1990
1995
2000
2005
2010
2015
2020
Source: Smith et al. 2007, 6-28.
Note: ME&NA: Middle East and North Africa; SS Africa: Sub-Saharan Africa; S. Asia: developing countries of South Asia; LA&C:
Latin America and The Caribbean; E Asia: developing countries of East Asia; OECD Pac: OECD countries of the Paci c Region; C&E
Eur: Central and Eastern Europe; FSU: Former Soviet Union; W Eur: Western Europe; OECD NA, OECD countries of North America