


 http://www.climate-change-guide.com/global-warming-potential-definition.html")
 http://www.climate-change-guide.com/global-warming-potential-definition.html")


")
")


 ecology
Similar presentations:


Trace gas fluxes in Permafrost
1. Trace gas fluxes in Permafrost
Svetlana EvgrafovaInstitute of Forest Russian Academy
of science, Krasnoyarsk
2. History of Earth’s Climate
Earth formed ~4.6 billion years ago
Originally very hot
Sun’s energy output only 70% of present
Liquid water present ~4.3 billion years
3. History of Earth’s Climate
• Life appeared ~3.8 billion years ago• Photosynthesis began 3.5-2.5 billion years ago
– Produced oxygen and removed carbon dioxide
and methane (greenhouse gases)
– Earth went through periods of cooling (“Snowball
Earth”) and warming
• Earth began cycles of glacial and interglacial
periods ~3 million years ago
4. Earth’s Temperature
SolarSun
Energy
Solar
Energy
The temperature of the earth is directly related to the
energy input from the Sun. Some of the Sun’s energy is
reflected by clouds. Other is reflected by ice. The
remainder is absorbed by the earth.
5. Earth’s Temperature
SunSolar
Energy
Radiation
Cooling
If amount of solar energy absorbed by the earth is
equal to the amount radiated back into space, the
earth remains at a constant temperature.
6. Earth’s Temperature
SunSolar
Energy
Radiation
Cooling
if the amount of solar energy is greater than the
amount radiated, then the earth heats up.
7. Earth’s Temperature
SunSolar
Energy
Radiation
Cooling
If the amount of solar energy is less than the amount
radiated, then the earth cools down.
8. Greenhouse Effect
SunGreenhouse Effect
To a certain degree, the earth acts like a greenhouse. Energy from the Sun penetrates the glass
of a greenhouse and warms the air and objects within the greenhouse. The same glass slows the
heat from escaping, resulting in much higher temperatures within the greenhouse than outside
it.
9. Earth’s Atmospheric Gases
Nitrogen (N2)Oxygen (O2)
NonGreenhouse
Gases
99%
Water (H2O)
Carbon Dioxide (CO2)
Methane (CH4)
Greenhouse
Gases
1%
10. by Laurent Cousineau (Montreal) http://www.climate-change-guide.com/global-warming-potential-definition.html
by Laurent Cousineau (Montreal)http://www.climate-change-guide.com/global-warming-potential-definition.html
A trace gas is a gas that makes up an extremely small portion of a mixture of gases.
When discussing climate change, trace gas refers to any of the less common gases found in the
Earth's atmosphere.
Essentially, nitrogen and oxygen are the most common gases representing about 78.1% and 20.9%
of the Earth's atmosphere respectively.
Hence, every other gas is considered a trace gas.
These include:
carbon dioxide
methane
oxides of nitrogen
ozone
water vapor
ammonia
argon (the most abundant trace gas representing about 0.934% of the Earth's atmosphere)
Despite their very small concentrations, trace gases have several important effects on both the
Earth's weather and climate.
More importantly, many of the gases mentioned above are greenhouse gases responsible for
the greenhouse effect.
11. by Laurent Cousineau (Montreal) http://www.climate-change-guide.com/global-warming-potential-definition.html
by Laurent Cousineau (Montreal)http://www.climate-change-guide.com/global-warming-potential-definition.html
Global Warming Potential Definition
The global warming potential (GWP) of a gas is measure of its total contribution to global
warming.
More specifically, it measures the warming impact from the emission of one unit of a certain
gas when compared to one unit of carbon dioxide.
Carbon dioxide is the reference gas and is thus assigned a value of 1.
The values found below originate from the IPCC’s Fourth Assessment Report in 2007:
GasGWP
Carbon Dioxide 1
Methane 25
Nitrous Oxide 298
Hydrofluorocarbons 140 to 11,700P
Erfluorocarbons 7,390 to 12,200
Sulfur Hexafluoride 22 800
12.
Climate Feedback Definition
A climate feedback is a process that will either amplify or reduce climate forcing.
Climate forcing, also known as radiative forcing, refers to changes in net irradiance between the
different layers of the atmosphere.
These changes in irradiance (the power of electromagnetic radiation per unit area) will either cause
a cooling or warming effect.
Positive Feedback Loops
There are many positive feedback loops that will accelerate global warming.
For example, as more ice melts due to global warming, there will be less sunlight reflected away
(albedo) and consequently, surface temperatures will increase.
Also, global warming will cause more wild fires which will release large amounts of carbon dioxide
into the atmosphere which will in turn cause even more warming via the greenhouse effect.
Yet another example, as global warming melts permafrost in both Northern Canada and Siberia,
huge amounts of methane, a powerfu lgreenhouse gas, will be released into the atmosphere.
In addition, mankind is currently increasing its annual carbon dioxide emissions which will even
further accelerate global warming.
Truly, we need to unite and stop climate change before we hit a point of no return.
13.
Carbon Dioxide Definition
Carbon dioxide (CO2) is the primary anthropogenic greenhouse gasresponsible for global warming.
Although carbon dioxide is a naturally occurring gas, it is also released into the atmosphere as a
result of:
biomass
fossil fuel combustion (as a by-product)
land-use changes
various industrial processes
Moreover, carbon dioxide is given a global warming potential of 1 and all other greenhouse gases
are measured against it.Greenhouse Gases
Carbon Dioxide
Chlorofluorocarbons
Hydrochlorofluorocarbons
Hydrofluorocarbons
Methane
Nitrous Oxide
Ozone
Perfluorocarbons
Sulfur Hexafluoride
Water Vapour
14.
Methane Definition
Methane (CH4) is a hydrocarbon and an important greenhouse gas.
According to the IPCC’s Fourth Assessment Report in 2007, methane has a global warming potential 25
times stronger than carbon dioxide.
In general, methane is produced from:
anaerobic (without oxygen) decomposition of waste in landfills
animal digestion
coal production
decomposition of animal wastes
incomplete fossil fuel combustion
production and distribution of natural gas and petroleum
Positive Feedback Loop
There is an important climate feedback regarding methane gas.
Notably, as temperatures rise worldwide, permafrost in both Northern Canada and Siberia will melt which
will cause huge amounts of methane to be released into the atmosphere.
Since methane is a greenhouse gas, this will cause even more global warming which will further enhance
the melting of permafrost.Greenhouse Gases
15.
16.
17.
Natural sources of atmospheric carbon dioxide include volcanic outgassing, the combustion of organic
matter, wildfires and the respiration processes of living aerobic organisms. Man-made sources of carbon dioxide
include the burning of fossil fuels for heating, power generation and transport, as well as some industrial
processes such as cement making. It is also produced by various microorganisms from fermentation and cellular
respiration. Plants, algae and cyanobacteria convert carbon dioxide to carbohydrates by a process
called photosynthesis.
Atmospheric carbon dioxide plays an integral role in the Earth's carbon cycle whereby carbon dioxide is removed
from the atmosphere by some natural processes such as photosynthesis and deposition of carbonates, to form
limestones for example, and added back to the atmosphere by other natural processes such as respiration and the
acid dissolution of carbonate deposits.
Photosynthetic organisms are photoautotrophs, which means that they are able to synthesize food directly from
CO2 and water using energy from light.
In plants, algae and cyanobacteria, photosynthesis releases oxygen.
Carbon dioxide is converted into sugars in a process called carbon fixation.
Carbon fixation is an endothermic redox reaction, so photosynthesis needs to supply both a source of energy to
drive this process, and the electrons needed to convert CO2 into a carbohydrate. This addition of the electrons is
a reduction reaction. In general outline and in effect, photosynthesis is the opposite of cellular respiration, in
which glucose and other compounds are oxidized to produce CO2 and water, and to release exothermic chemical
energy to drive the organism's metabolism. However, the two processes take place through a different sequence
of chemical reactions and in different cellular compartments.
18.
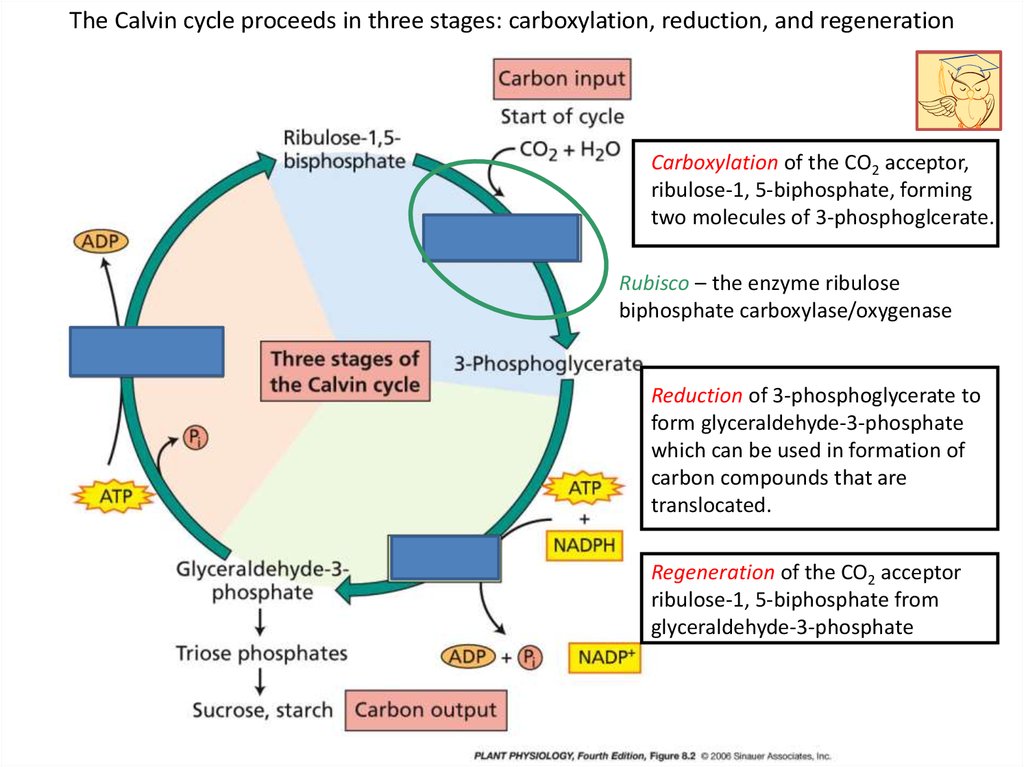
The Calvin cycle proceeds in three stages: carboxylation, reduction, and regenerationCarboxylation of the CO2 acceptor,
ribulose-1, 5-biphosphate, forming
two molecules of 3-phosphoglcerate.
Rubisco – the enzyme ribulose
biphosphate carboxylase/oxygenase
Reduction of 3-phosphoglycerate to
form glyceraldehyde-3-phosphate
which can be used in formation of
carbon compounds that are
translocated.
Regeneration of the CO2 acceptor
ribulose-1, 5-biphosphate from
glyceraldehyde-3-phosphate
19.
20.
21.
22.
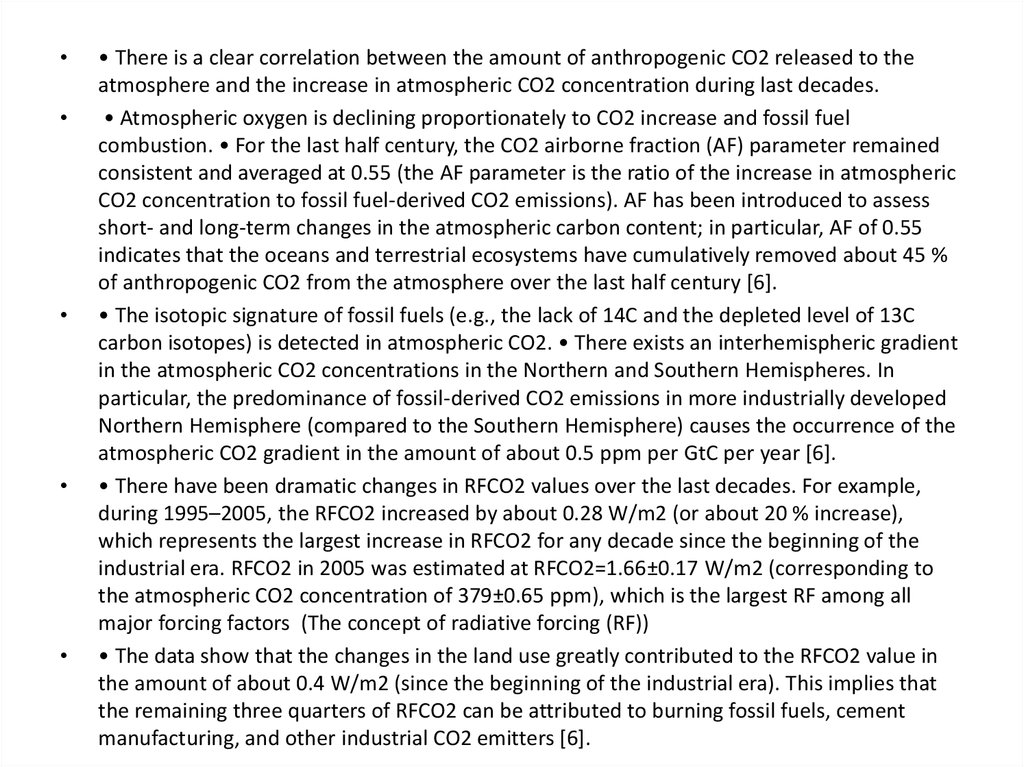
• There is a clear correlation between the amount of anthropogenic CO2 released to the
atmosphere and the increase in atmospheric CO2 concentration during last decades.
• Atmospheric oxygen is declining proportionately to CO2 increase and fossil fuel
combustion. • For the last half century, the CO2 airborne fraction (AF) parameter remained
consistent and averaged at 0.55 (the AF parameter is the ratio of the increase in atmospheric
CO2 concentration to fossil fuel-derived CO2 emissions). AF has been introduced to assess
short- and long-term changes in the atmospheric carbon content; in particular, AF of 0.55
indicates that the oceans and terrestrial ecosystems have cumulatively removed about 45 %
of anthropogenic CO2 from the atmosphere over the last half century [6].
• The isotopic signature of fossil fuels (e.g., the lack of 14C and the depleted level of 13C
carbon isotopes) is detected in atmospheric CO2. • There exists an interhemispheric gradient
in the atmospheric CO2 concentrations in the Northern and Southern Hemispheres. In
particular, the predominance of fossil-derived CO2 emissions in more industrially developed
Northern Hemisphere (compared to the Southern Hemisphere) causes the occurrence of the
atmospheric CO2 gradient in the amount of about 0.5 ppm per GtC per year [6].
• There have been dramatic changes in RFCO2 values over the last decades. For example,
during 1995–2005, the RFCO2 increased by about 0.28 W/m2 (or about 20 % increase),
which represents the largest increase in RFCO2 for any decade since the beginning of the
industrial era. RFCO2 in 2005 was estimated at RFCO2=1.66±0.17 W/m2 (corresponding to
the atmospheric CO2 concentration of 379±0.65 ppm), which is the largest RF among all
major forcing factors (The concept of radiative forcing (RF))
• The data show that the changes in the land use greatly contributed to the RFCO2 value in
the amount of about 0.4 W/m2 (since the beginning of the industrial era). This implies that
the remaining three quarters of RFCO2 can be attributed to burning fossil fuels, cement
manufacturing, and other industrial CO2 emitters [6].
23.
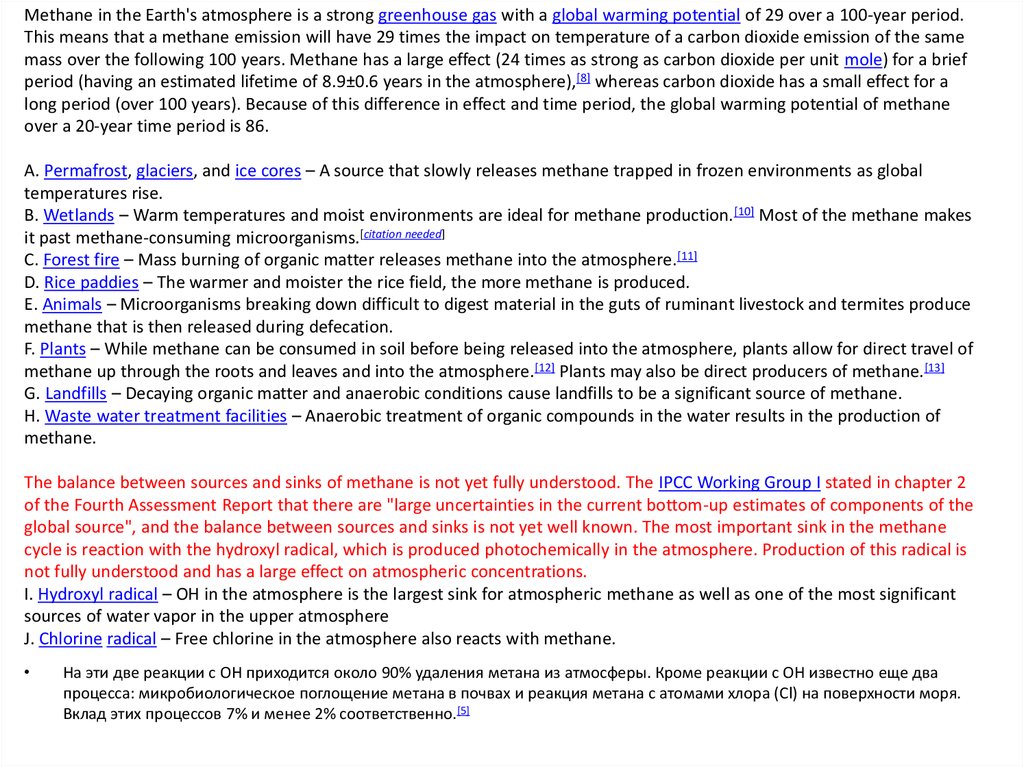
Methane in the Earth's atmosphere is a strong greenhouse gas with a global warming potential of 29 over a 100-year period.This means that a methane emission will have 29 times the impact on temperature of a carbon dioxide emission of the same
mass over the following 100 years. Methane has a large effect (24 times as strong as carbon dioxide per unit mole) for a brief
period (having an estimated lifetime of 8.9±0.6 years in the atmosphere),[8] whereas carbon dioxide has a small effect for a
long period (over 100 years). Because of this difference in effect and time period, the global warming potential of methane
over a 20-year time period is 86.
A. Permafrost, glaciers, and ice cores – A source that slowly releases methane trapped in frozen environments as global
temperatures rise.
B. Wetlands – Warm temperatures and moist environments are ideal for methane production.[10] Most of the methane makes
it past methane-consuming microorganisms.[citation needed]
C. Forest fire – Mass burning of organic matter releases methane into the atmosphere.[11]
D. Rice paddies – The warmer and moister the rice field, the more methane is produced.
E. Animals – Microorganisms breaking down difficult to digest material in the guts of ruminant livestock and termites produce
methane that is then released during defecation.
F. Plants – While methane can be consumed in soil before being released into the atmosphere, plants allow for direct travel of
methane up through the roots and leaves and into the atmosphere.[12] Plants may also be direct producers of methane.[13]
G. Landfills – Decaying organic matter and anaerobic conditions cause landfills to be a significant source of methane.
H. Waste water treatment facilities – Anaerobic treatment of organic compounds in the water results in the production of
methane.
The balance between sources and sinks of methane is not yet fully understood. The IPCC Working Group I stated in chapter 2
of the Fourth Assessment Report that there are "large uncertainties in the current bottom-up estimates of components of the
global source", and the balance between sources and sinks is not yet well known. The most important sink in the methane
cycle is reaction with the hydroxyl radical, which is produced photochemically in the atmosphere. Production of this radical is
not fully understood and has a large effect on atmospheric concentrations.
I. Hydroxyl radical – OH in the atmosphere is the largest sink for atmospheric methane as well as one of the most significant
sources of water vapor in the upper atmosphere
J. Chlorine radical – Free chlorine in the atmosphere also reacts with methane.
На эти две реакции с ОН приходится около 90% удаления метана из атмосферы. Кроме реакции с ОН известно еще два
процесса: микробиологическое поглощение метана в почвах и реакция метана с атомами хлора (Cl) на поверхности моря.
Вклад этих процессов 7% и менее 2% соответственно.[5]
24. Pervasiveness of Life
Snow algae on glacierSierra Nevada, CA
Earth life extraordinarily successful
Natural selection & evolution
--> adaptability
Organisms found EVERYWHERE
glaciers & permafrost
hot springs
hydrothermal vents
desert rocks
clouds
deep sea sediments
soils
25. Five Things You Need to Have Life
1.Stable Environment
be able to adapt to changes
2.
Liquid water
-20˚C to 121˚C
3.
Energy Source
O2 and carbohydrates
oxidant (O2) and reductant (sugars)
4.
Carbon Source
carbohydrates
sometimes different from an energy source
5.
Nutrients
The Biogenic Elements: C, H, N, O, P, S
Trace Nutrients: Ca, Fe, Cu, Zn, vitamins…..
some organisms need more than others
26. Liquid Water
If T below 0˚C, microbes can be foundgrowing between ice crystals or in the
pore spaces of ice.
Microbes can secrete compounds that can
inhibit ice crystal formation.
Soil still contains substantial thin films of
liquid water below 0˚C
27. Carbon Source
CO2organic carbon
autotrophs
heterotrophs
Can combine words for energy and carbon sources:
Name
Energy Source
Carbon Source
Photoheterotroph
Light
Organic C
Photoautotroph
Light
CO2
Chemoorganotroph
Organic (reductant) and Organic C
inorganic chemicals
(oxidant)
Chemoautotroph
Inorganic chemicals
(reductant & oxidant)
CO2
28. The Importance of Oxygen
Oxygen is a potent source of energy (strongest oxidant available)Anaerobic metabolisms don’t produce as much energy (ATP).
Oxygen is also toxic - it is reactive.
- causes damage to DNA
- causes damage to proteins
- causes damage to lipids
- cells must be able to repair this damage
29. Aerobic Metabolisms (Aerobes)
Animals“CH2O”
+ O2 - CO2 + H2O
Manganese
Oxidizers
Mn2+
Iron
Oxidizers
Fe2+ +
O2
--->
Fe2O3 (iron oxide)
chemotrophy
Sulfide
Oxidizers
H2S
O2
--->
H2SO4 (sulfuric acid)
chemotrophy
Methane
Oxidizers
CH4
CO2
chemotrophy
Hydrogen
Oxidizers
2H2 + O2 ---> 2H2O
Arsenic
Oxidizers
AsO3 (arsenite) + O2 ---> AsO4 (arsenate)
+
+
+
O2
O2
--->
--->
MnO4 (manganese oxide)
+
H2O
organotrophy
chemotrophy
???
chemotrophy
30. Anaerobic Metabolisms (Anaerobes)
SulfateReducers
H2SO4 + 4H2 ---> H2S + 4H2O
chemotrophy
Methanogenesis
CO2 + 2H2 ---> CH4 + 2H2O
chemotrophy
-a lot of chemical reactions in the environment are catalyzed
by microorganisms.
-microbes can carry out some “unusual” reactions to make energy
-energy generation results in constant oxidizing and reducing of
compounds: sulfur, iron, manganese, carbon…..
-called biogeochemical cycling.
31. Temperature
TemperatureOne of the most important environmental factors that
affect growth and survival of organisms.
Too hot - proteins denature (think: fried egg - unfolded, coaggulated)
Too cold - membranes and proteins freeze
For every organism, there is a:
minimum T
optimal T (can be 4 or 105˚C)
maximum T
(remember water has to be liquid water)
typical range of growth T is 30-40˚C
32. Growth Temperature
Psychrophile - grows optimally below 15˚C80% of Earth’s biosphere is < 15˚C.
Mesophile - grows optimally between 15-45˚C
Thermophile - grows optimally between 45-80˚C
Hyperthermophiles - grows optimally above 80˚C
ice core
permanently
frozen seawater
McMurdo Sound
Antarctica
33. Extremophiles
What is extreme for one organism is necessary for another.Organisms are all highly adapted to their niches.
Psychrophile - grows optimally below 15˚C
80% of Earth’s biosphere is < 15˚C
34. Microbial Life Runs Planet Earth
BACTERIAHalobacterium
Chromatium
A RCHAEA
Sulfolobus
Thermoproteus
Thermofilum
pSL50
pSL12
pJP27
pJP78
Marine
mesophiles
Agrobacterium
Methanosarcina
Thermoplasma
Methanobacterium
Methanothermus
Methanococcus
Thermococcus
Root
pSL22
mitochondria
Methanospirillum
pSL4
OctSpA1-106
E. coli
Chlorobium
Cytophaga
Bacillus
Clostridium
chloroplasts
Synechoccous
Thermus
Thermomicrobium
Thermotoga
Aquifex
EM17
OctSp92
0 . 1 ch a n g e s p e r n u cl e oti d e
E UCARYA
Microbial diversity is vast.
Number of species astronomical.
<99.9% of microbial species have
been cultured in the lab.
Whole new uncultured lineages.
Almost nothing known about them.
Microbes:
turn CO2 into organic matter
most photosynthesis on the
planet is done by prokaryotes
then turn organic matter back
into CO2
microbial metabolism is incredibly
diverse
35.
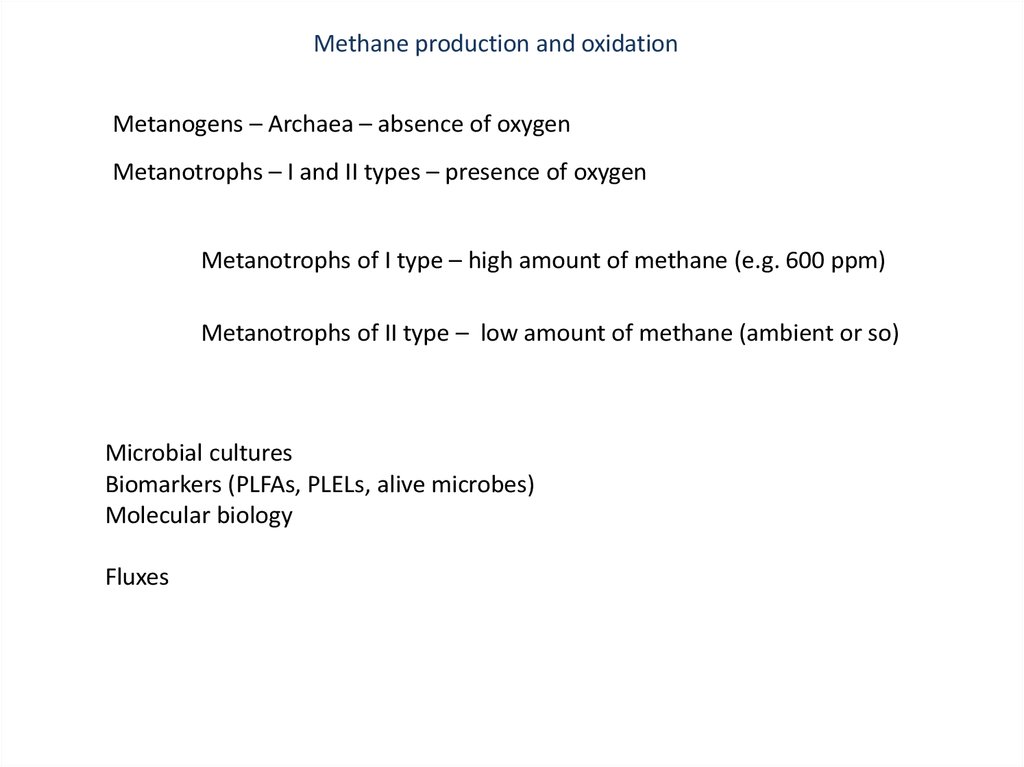
Methane production and oxidationMetanogens – Archaea – absence of oxygen
Metanotrophs – I and II types – presence of oxygen
Metanotrophs of I type – high amount of methane (e.g. 600 ppm)
Metanotrophs of II type – low amount of methane (ambient or so)
Microbial cultures
Biomarkers (PLFAs, PLELs, alive microbes)
Molecular biology
Fluxes
36.
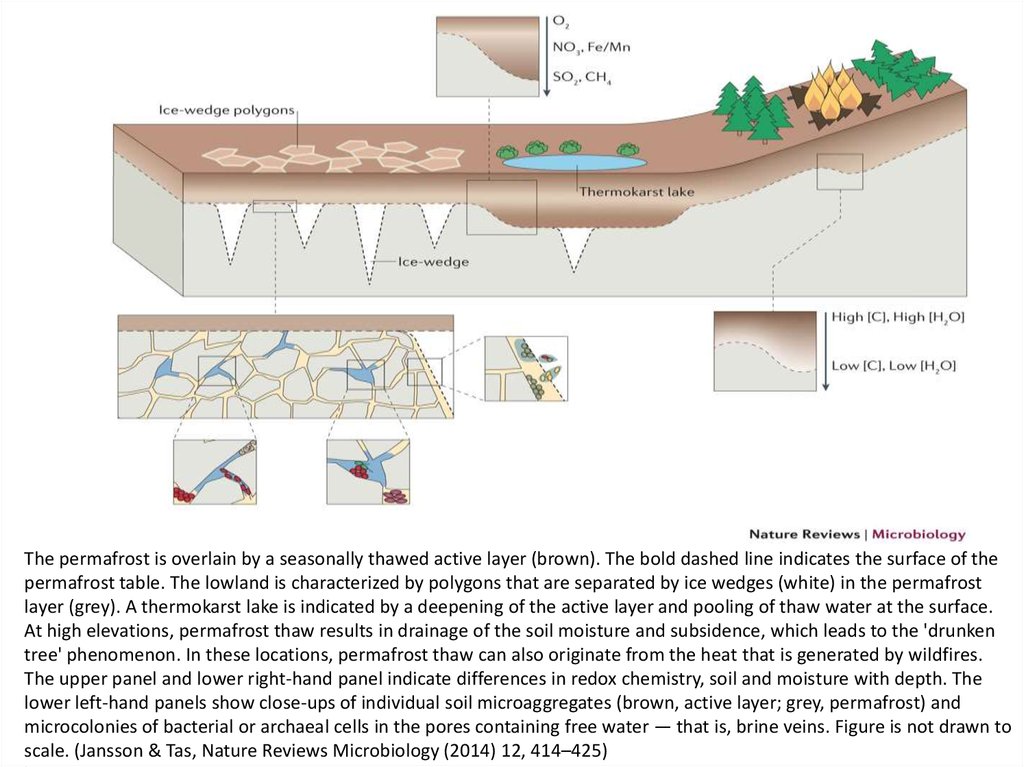
The permafrost is overlain by a seasonally thawed active layer (brown). The bold dashed line indicates the surface of thepermafrost table. The lowland is characterized by polygons that are separated by ice wedges (white) in the permafrost
layer (grey). A thermokarst lake is indicated by a deepening of the active layer and pooling of thaw water at the surface.
At high elevations, permafrost thaw results in drainage of the soil moisture and subsidence, which leads to the 'drunken
tree' phenomenon. In these locations, permafrost thaw can also originate from the heat that is generated by wildfires.
The upper panel and lower right-hand panel indicate differences in redox chemistry, soil and moisture with depth. The
lower left-hand panels show close-ups of individual soil microaggregates (brown, active layer; grey, permafrost) and
microcolonies of bacterial or archaeal cells in the pores containing free water — that is, brine veins. Figure is not drawn to
scale. (Jansson & Tas, Nature Reviews Microbiology (2014) 12, 414–425)
37.
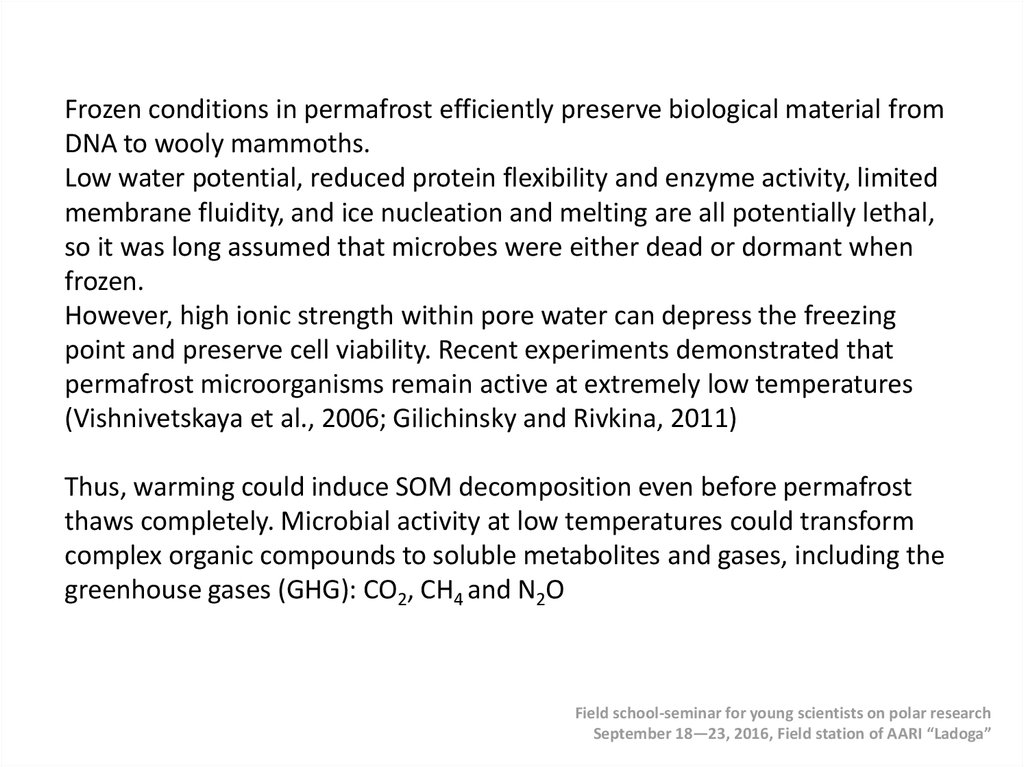
Frozen conditions in permafrost efficiently preserve biological material fromDNA to wooly mammoths.
Low water potential, reduced protein flexibility and enzyme activity, limited
membrane fluidity, and ice nucleation and melting are all potentially lethal,
so it was long assumed that microbes were either dead or dormant when
frozen.
However, high ionic strength within pore water can depress the freezing
point and preserve cell viability. Recent experiments demonstrated that
permafrost microorganisms remain active at extremely low temperatures
(Vishnivetskaya et al., 2006; Gilichinsky and Rivkina, 2011)
Thus, warming could induce SOM decomposition even before permafrost
thaws completely. Microbial activity at low temperatures could transform
complex organic compounds to soluble metabolites and gases, including the
greenhouse gases (GHG): CO2, CH4 and N2O
Field school-seminar for young scientists on polar research
September 18—23, 2016, Field station of AARI “Ladoga”
38.
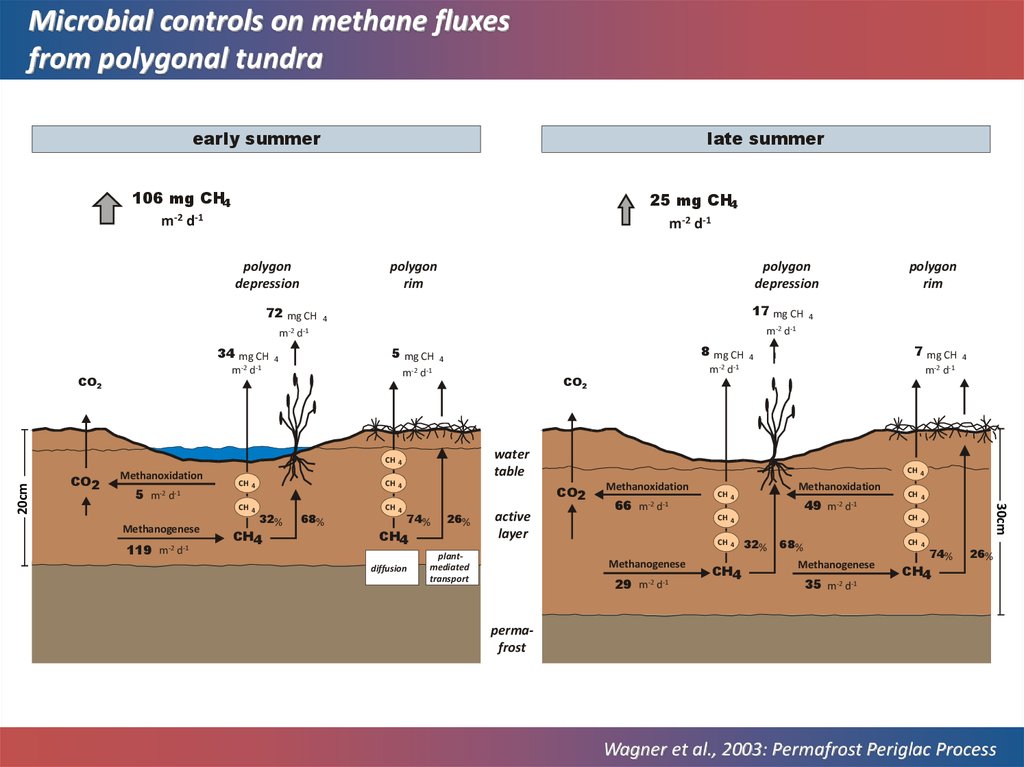
Microbial controls on methane fluxesfrom polygonal tundra
late summer
early summer
106 mg CH4
m-2 d-1
25 mg CH4
m-2 d-1
polygon
depression
polygon
rim
72 mg CH
m-2
34 mg CH
17 mg CH
4
5 mg CH
4
m-2
8 mg CH
4
d-1
5 m-2 d-1
Methanogenese
119 m-2 d-1
CH 4
CH 4
CH 4
CH 4
32%
CH4
68%
7 mg CH
4
water
table
CH 4
CO2
74%
CH4
diffusion
26%
active
layer
plantmediated
transport
4
m-2 d-1
Methanoxidation
66 m-2 d-1
Methanoxidation
CH 4
49 m-2 d-1
CH 4
CH 4
Methanogenese
Methanogenese
29 m-2 d-1
Methanoxidation
CH4
CH 4
30cm
20cm
Methanoxidation
4
m-2 d-1
CO2
CH 4
CO2
polygon
rim
m-2 d-1
d-1
m-2 d-1
CO2
polygon
depression
CH 4
32%
68%
Methanogenese
35 m-2 d-1
CH 4
74%
CH4
26%
permafrost
Wagner et al., 2003: Permafrost Periglac Process
39.
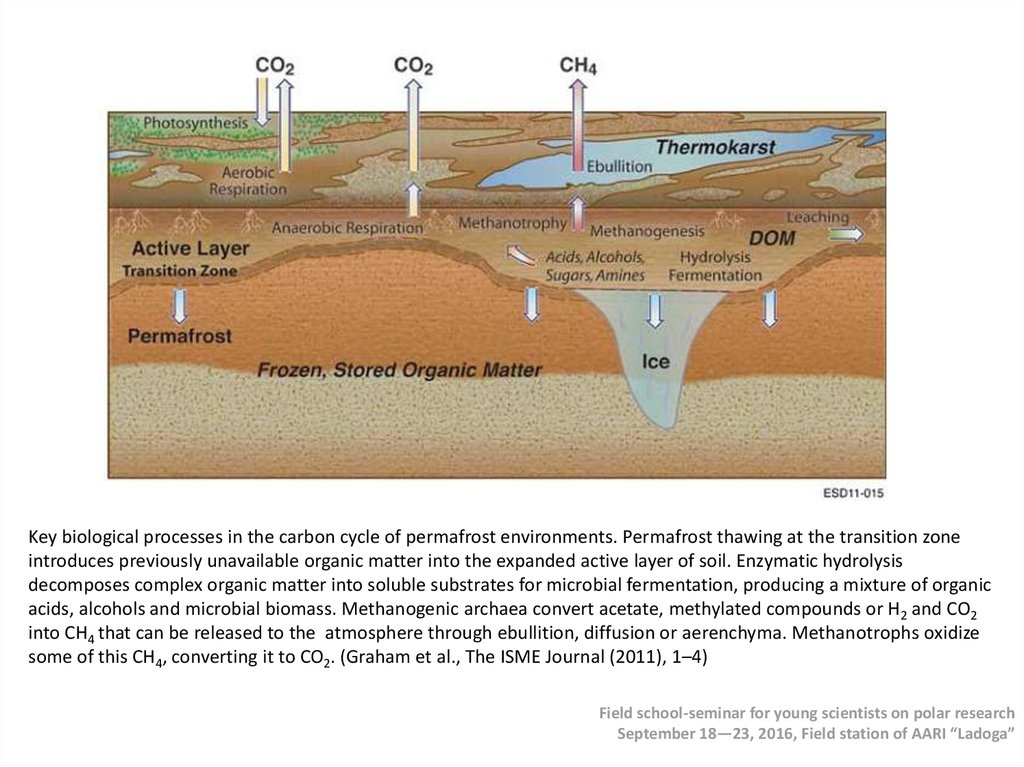
Key biological processes in the carbon cycle of permafrost environments. Permafrost thawing at the transition zoneintroduces previously unavailable organic matter into the expanded active layer of soil. Enzymatic hydrolysis
decomposes complex organic matter into soluble substrates for microbial fermentation, producing a mixture of organic
acids, alcohols and microbial biomass. Methanogenic archaea convert acetate, methylated compounds or H2 and CO2
into CH4 that can be released to the atmosphere through ebullition, diffusion or aerenchyma. Methanotrophs oxidize
some of this CH4, converting it to CO2. (Graham et al., The ISME Journal (2011), 1–4)
Field school-seminar for young scientists on polar research
September 18—23, 2016, Field station of AARI “Ladoga”
40.
41.
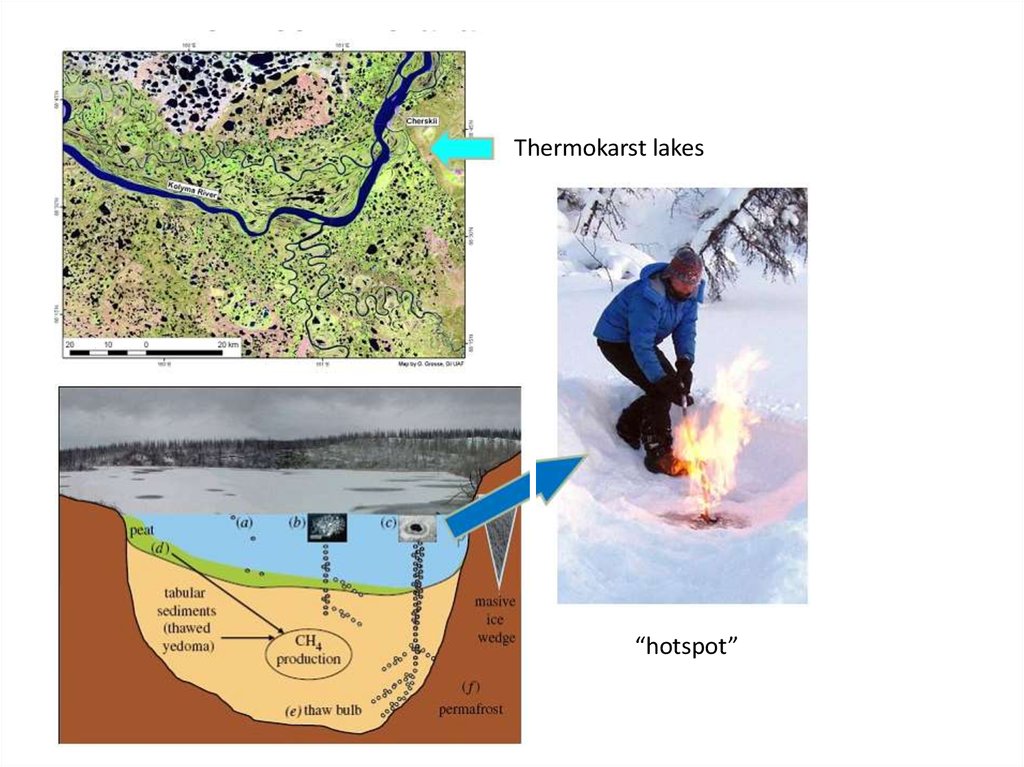
Thermokarst lakes“hotspot”
42.
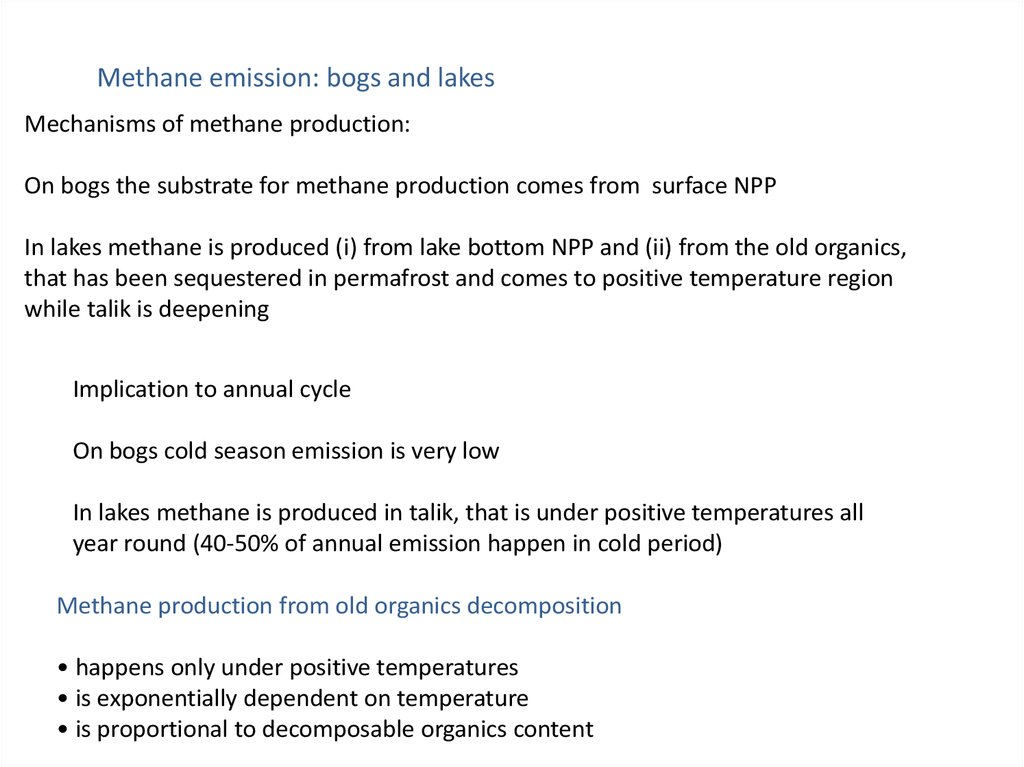
Methane emission: bogs and lakesMechanisms of methane production:
On bogs the substrate for methane production comes from surface NPP
In lakes methane is produced (i) from lake bottom NPP and (ii) from the old organics,
that has been sequestered in permafrost and comes to positive temperature region
while talik is deepening
Implication to annual cycle
On bogs cold season emission is very low
In lakes methane is produced in talik, that is under positive temperatures all
year round (40-50% of annual emission happen in cold period)
Methane production from old organics decomposition
• happens only under positive temperatures
• is exponentially dependent on temperature
• is proportional to decomposable organics content
43.
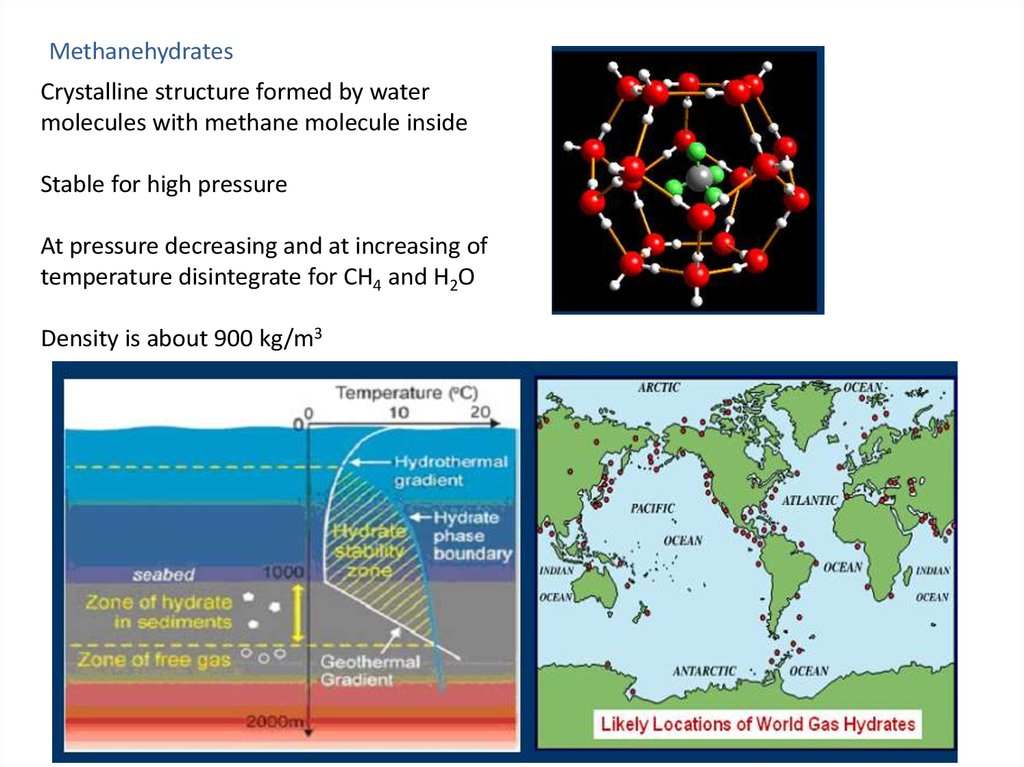
MethanehydratesCrystalline structure formed by water
molecules with methane molecule inside
Stable for high pressure
At pressure decreasing and at increasing of
temperature disintegrate for CH4 and H2O
Density is about 900 kg/m3
44.
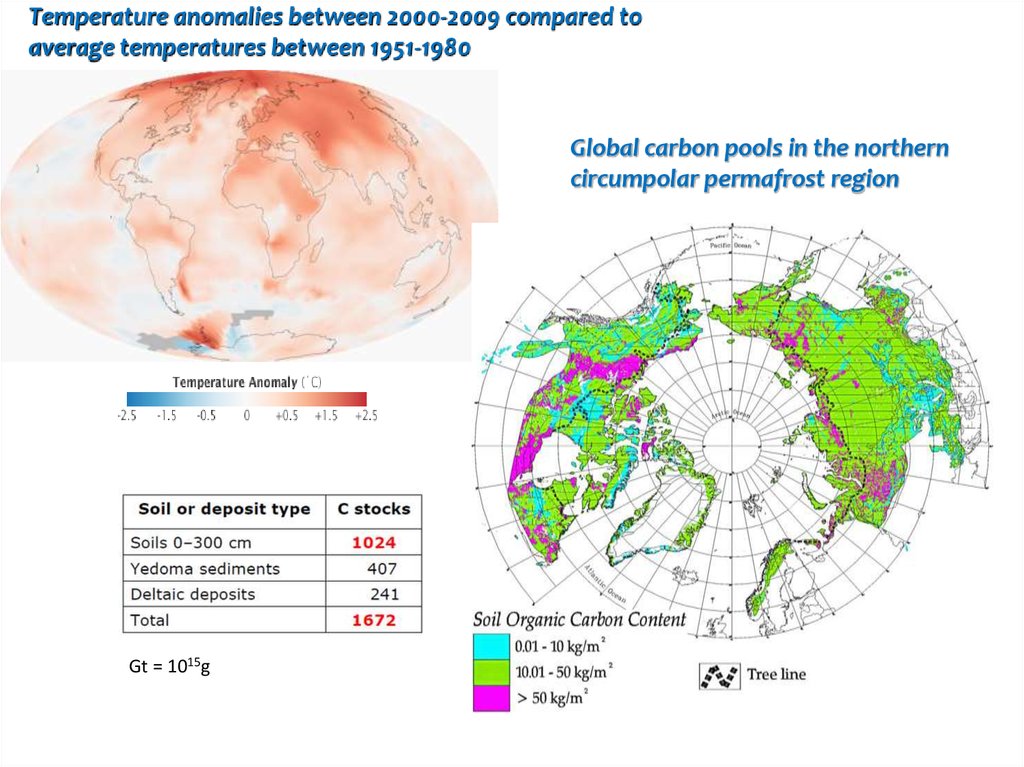
Temperature anomalies between 2000-2009 compared toaverage temperatures between 1951-1980
Global carbon pools in the northern
circumpolar permafrost region
Gt = 1015g
45.
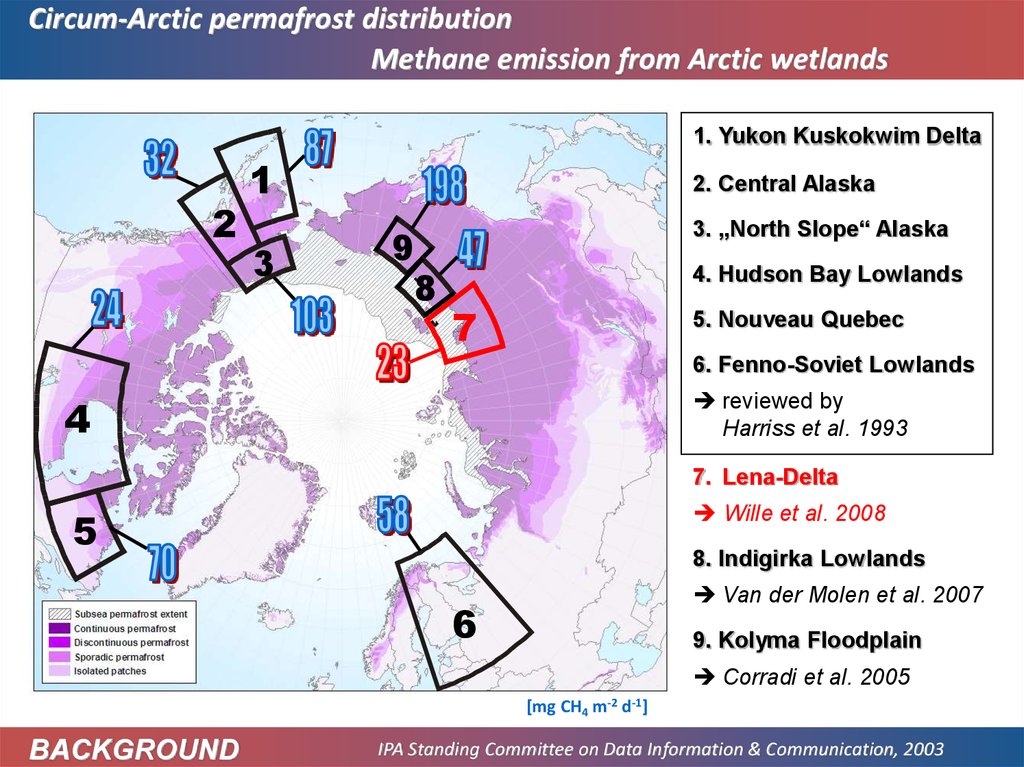
Circum-Arctic permafrost distributionMethane emission from Arctic wetlands
1. Yukon Kuskokwim Delta
2
1
3
2. Central Alaska
9
8
3. „North Slope“ Alaska
4. Hudson Bay Lowlands
7
5. Nouveau Quebec
6. Fenno-Soviet Lowlands
reviewed by
Harriss et al. 1993
4
7. Lena-Delta
Wille et al. 2008
5
8. Indigirka Lowlands
Van der Molen et al. 2007
6
9. Kolyma Floodplain
Corradi et al. 2005
[mg CH4 m-2 d-1]
BACKGROUND
IPA Standing Committee on Data Information & Communication, 2003
46.
Currently, we cannot predict how microbes will use SOM released bypermafrost thawing, or reliably estimate the temperature-dependent
activities of the enzymes they produce to degrade this material.
Current biogeochemical models segregate SOM into conceptual pools with
different mean residence times (Smith et al., 1997).
If most organic matter trapped in permafrost is difficult to degrade because
of its chemical structure (for example, lignin) or its physical structure (for
example, particulates or mineral complexes), then this humus comprises a
recalcitrant pool that will slowly stimulate microbial growth and GHG
production.
Alternatively, if plant litter was rapidly frozen in permafrost, then microbes
could quickly metabolize thawed polymers like cellulose or protein.
Increased temperature may also cause changes in protein structure and
conformation, protein adsorption, altered protein expression and shifts in
microbial populations, which are not currently modeled (Waldrop et al.,
2010; Wallenstein et al., 2011). We might expect soil warming to select for
microbes producing enzymes that degrade SOM more efficiently at higher
temperatures.
Field school-seminar for young scientists on polar research
September 18—23, 2016, Field station of AARI “Ladoga”
47.
Predictions of soil GHG flux include increasingly sophisticated representations ofprocesses in the subsurface carbon cycle , but these models are poorly
parameterized for permafrost regions (Riley et al., 2011).
16S rRNA gene sequence data have identified both hydrogenotrophic and
acetotrophic (methylotrophic) methanogen phylotypes in Arctic tundra samples,
at substantial abundance (Wagner and Liebner, 2010).
The two groups of methanogens differ in their substrates, syntrophic associations
and isotopic fractionation of carbon: it is important to distinguish between the
methanogenic pathways to predict the proportions of CH4 and CO2, as well as
fluxes (Walter et al., 2008).
Changes in methanogen abundance could also confuse estimates of the
temperature and pH response factors.
Eventually, microbial activities will dictate whether permafrost environments will
be a net source or sink of GHG in the coming decades and whether large-scale
feedbacks to regional and global climate will develop because of increased
CO2,N2O and CH4 emissions and vegetation changes in the Arctic.
Field school-seminar for young scientists on polar research
September 18—23, 2016, Field station of AARI “Ladoga”
48.
49.
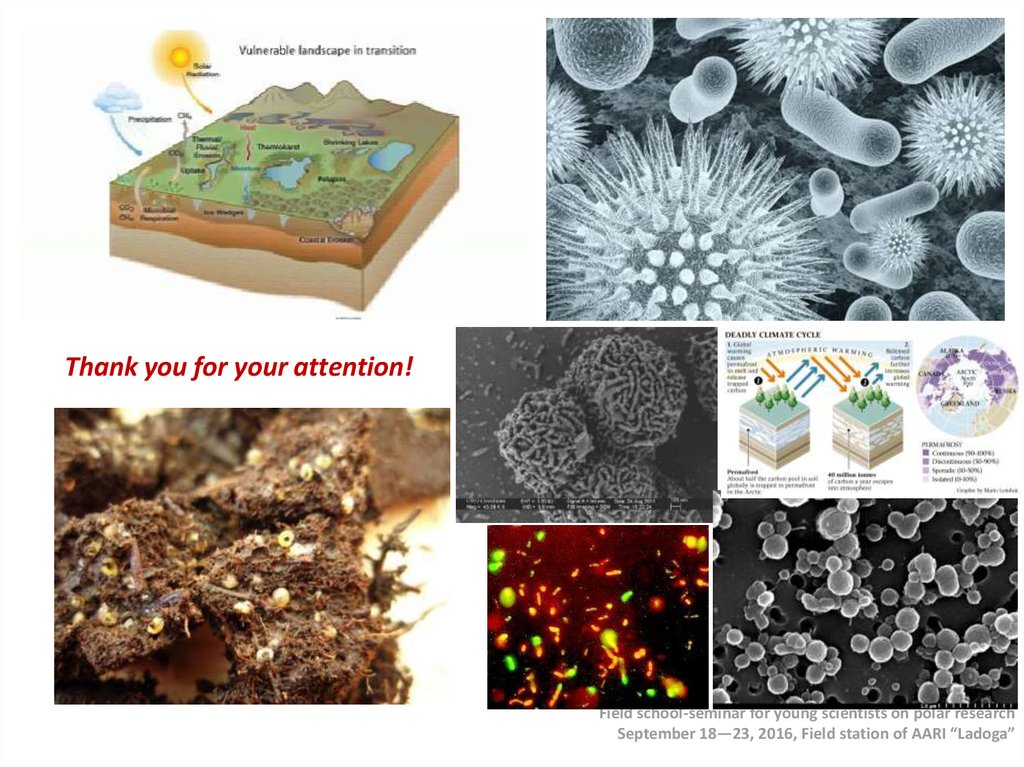
Thank you for your attention!Field school-seminar for young scientists on polar research
September 18—23, 2016, Field station of AARI “Ladoga”
50.
В определении терминов Четвертого оценочного доклада IPCC , "время жизни" имеет несколько значений. Наиболее
подходящим является:
"Время обращения (T) (также называемое глобальным временем жизни в атмосфере) это отношение массы вещества в
хранилище (например, газового компонента в атмосфере) к общей скорости удаления из хранилища S: T = M / S. Для каждого
процесса удаления может быть определено свое время обращения. В биологии почв это называется средним временем
пребывания."Другими словами, время жизни - это среднее время, которое индивидуальная частица проводит в данном блоке.
Оно определяется как размер блока (хранилища) деленный на общую скорость потока частиц в хранилище или из него. Раздел
4.1.4 Третьего оценочного доклада IPCC говорит об этом более подробно.
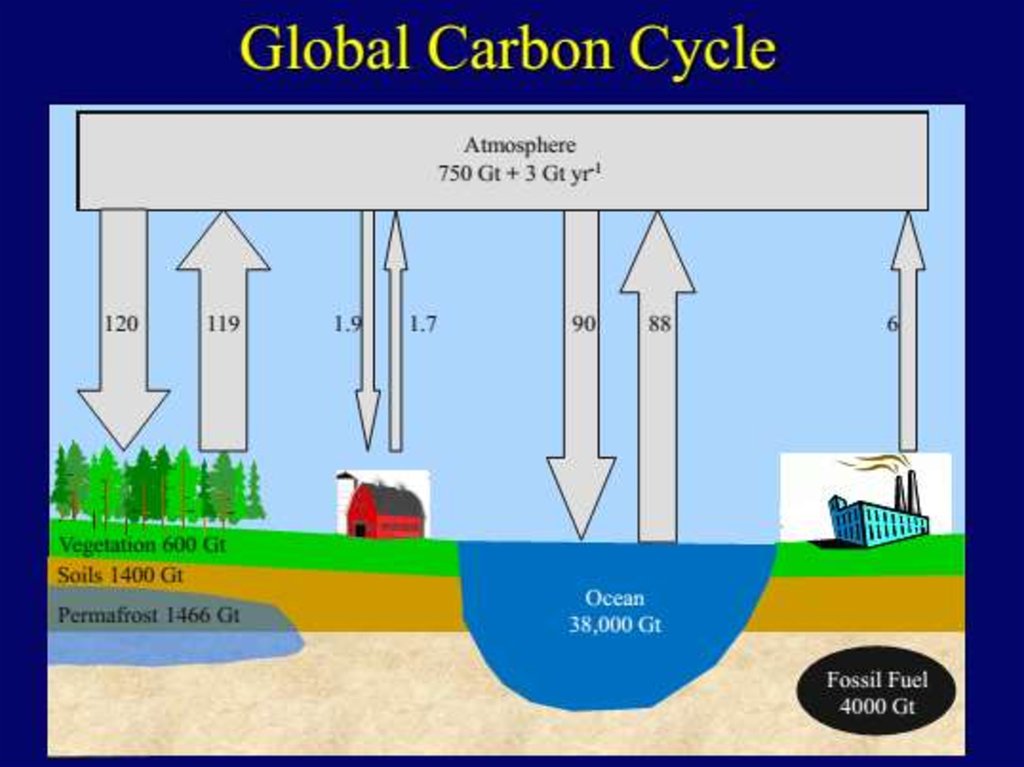
В схеме углеродного цикла, приведенной выше, есть два набора чисел. Черные представляют размеры блоков в гигатоннах
углерода (Гт). Фиолетовые означают потоки (или скорости потоков) в блок или из него в гигатоннах в год (Гт/год).
Небольшой подсчет показывает, что около 200 Гт углерода покидает атмосферу и входит в нее каждый год. Следовательно, в
первом приближении при размере блока 750 Гт можно получить время жизни молекулы СО2 750 Гт/200 Гт в год = примерно 34 года. (Впрочем, более точный подсчет прихода и ухода показывает общий дисбаланс; углерод в атмосфере растет на
примерно 3,3 Гт в год).
Верно, что конкретная молекула СО2 имеет короткое время пребывания в атмосфере. Однако в большинстве случаев, покидая
атмосферу, она просто меняется местами с другой молекулой в океане. То есть потенциал потепления от СО2 не имеет
отношения к времени жизни СО2.
В действительности потенциал потепления определяется тем, как долго избыточный СО2 будет оставаться в атмосфере. СО2
химически инертен и удаляется только за счет биопоглощения и растворения в океане. Биопоглощение (за исключением
образования ископаемого топлива) является углеродно нейтральным: любое растущее дерево когда-нибудь умрет и
разложится, освобождая СО2. (Да, возможен некоторый выигрыш за счет восстановления лесов, но он, по всей вероятности,
невелик по сравнению с эмиссией от ископаемого топлива).
Растворение СО2 в океане происходит быстро, но дело в том, что поверхностный слой океана уже "наполнен", и таким
образом, узким местом является перенос углерода в глубину. Этот перенос в основном осуществляется медленной
циркуляцией с оборотом слоев океана (*3). Такой оборот занимает 500-1000 лет. Следовательно, временной масштаб
потенциала потепления от СО2 не менее 500 лет является вполне обоснованным (См. Четвертый оценочный доклад IPCC
раздел 2.10).
51.
• Источниками углекислого газа в атмосфере Земли являютсявулканические выбросы, жизнедеятельность биосферы, деятельность
человека. Антропогенными источниками являются:
сжигание ископаемого топлива; сжигание биомассы, включая
сведение лесов; некоторые промышленные процессы приводят к
значительному выделению углекислоты (например, производство
цемента). Основными потребителями углекислого газа
являются растения, однако, в состоянии равновесия,
большинство биоценозов за счет гниения биомассы производит
приблизительно столько же углекислого газа, сколько и поглощает.
Антропогенная эмиссия увеличивает концентрацию углекислого газа в
атмосфере, что, предположительно, является главным фактором
изменения климата. Углекислый газ является "долго живущим" в
атмосфере. Согласно современным научным представлениям,
возможность дальнейшего накапливания СО2 в атмосфере ограничена
риском неприемлемых последствий для биосферы и человеческой
цивилизации, в связи с чем его будущий эмиссионный
бюджет является конечной величиной.