


 geography
Similar presentations:


")


Drawing graphic sedimentary logs. Increasing grainsize
1.
Drawing graphic sedimentary logsIncreasing grainsize
14m
Height (at
outcrop)
or depth
(in core)
0m
For many decades, graphic sedimentary logs have been a vital
method of recording and reporting sedimentary successions,
whether they are at outcrop or in the subsurface (core).
Before graphic logs were developed and refined in the 1970s,
sedimentary successions were illustrated by parallel-sided
lithological/stratigraphic columns showing little more than the
lithology. Features such as grain size and sedimentary structures
were described in writing alongside the lithology, so that it was very
difficult to get an understanding of the succession without
laboriously reading long, and often turgid, descriptions.
This changed dramatically with the development of graphic logs
that recorded such characteristics as grain size, sedimentary
structures, palaeocurrent direction and fossil content, as well as the
lithology. For the first time, it was possible to visualise a
sedimentary succession at a glance. As an old English saying goes,
‘a picture is worth a thousand words’ and this is never truer than in
the case of sedimentary logs.
2.
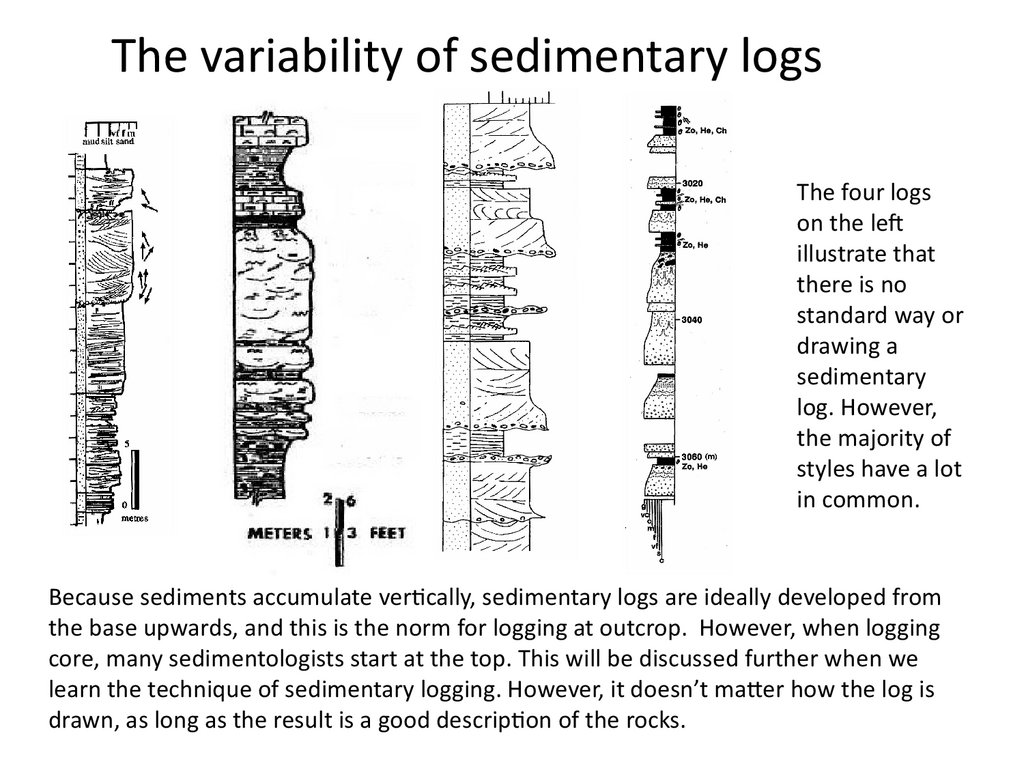
The variability of sedimentary logsThe four logs
on the left
illustrate that
there is no
standard way or
drawing a
sedimentary
log. However,
the majority of
styles have a lot
in common.
Because sediments accumulate vertically, sedimentary logs are ideally developed from
the base upwards, and this is the norm for logging at outcrop. However, when logging
core, many sedimentologists start at the top. This will be discussed further when we
learn the technique of sedimentary logging. However, it doesn’t matter how the log is
drawn, as long as the result is a good description of the rocks.
3.
Sedimentarylogging
The logging sheet on
the right is a typical
sheet used for logging
sedimentary
successions in core or at
outcrop.
This sheet is based on
one developed over
many years by the
sedimentology
specialists at Robertson
Research in North
Wales. As such, it has a
long track record, and
works well for most
kinds of rocks.
4.
The logging sheetThis sheet was designed for
metric wells, and any
outcrops which were
measured in metres. The
spacing between the
horizontal lines is 0.5cm.
The most common logging
scale is 1:50, or 2cm to 1m,
which means that there are
four 0.5cm intervals per
metre. Logs at other scales
can, of course, be drawn.
For example, 1:200 would
be one interval per metre
and 1:20 ten intervals per
metre.
This sheet cannot be used
for logging in feet. This
requires the spacing
between horizontal lines to
be measured in fractions of
an inch, not mm. Such
sheets do, of course, exist.
5.
Typical logging sheet headerThe most important columns on the logging sheet are the depth column and the lithology and
grainsize/sedimentary structures pair.
The first thing, when starting the log, is to annotate the depth scale (or height for outcrops). As discussed, for
a scale of 1:50, there will be four intervals per metre. Write the appropriate depths in the depth column.
When you have done this, check to ensure that you have got it right (any sedimentologist who has spent
much time logging core or at outcrop will have got it wrong at least once!). A logging sheet in portrait
orientation on A4 paper will allow slightly more than 10m to be logged at 1:50. At this scale, 10m of core
should be 20cm long on the paper. Check it before you spend a lot of time drawing a log at the wrong scale!
6.
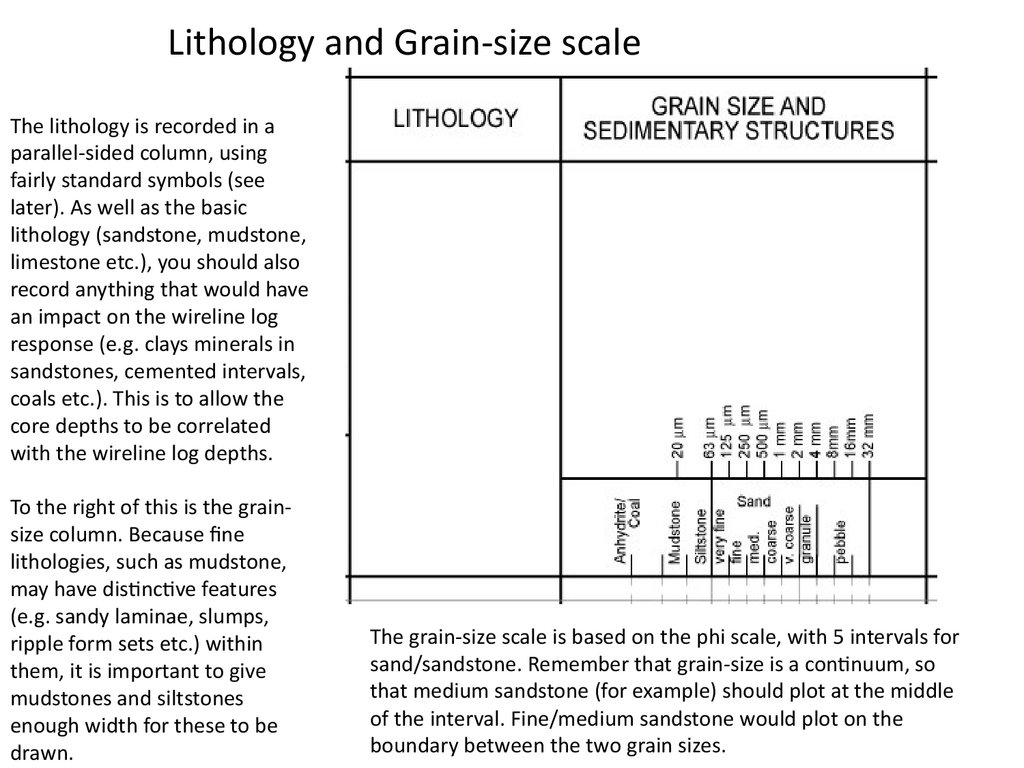
Lithology and Grain-size scaleThe lithology is recorded in a
parallel-sided column, using
fairly standard symbols (see
later). As well as the basic
lithology (sandstone, mudstone,
limestone etc.), you should also
record anything that would have
an impact on the wireline log
response (e.g. clays minerals in
sandstones, cemented intervals,
coals etc.). This is to allow the
core depths to be correlated
with the wireline log depths.
To the right of this is the grainsize column. Because fine
lithologies, such as mudstone,
may have distinctive features
(e.g. sandy laminae, slumps,
ripple form sets etc.) within
them, it is important to give
mudstones and siltstones
enough width for these to be
drawn.
The grain-size scale is based on the phi scale, with 5 intervals for
sand/sandstone. Remember that grain-size is a continuum, so
that medium sandstone (for example) should plot at the middle
of the interval. Fine/medium sandstone would plot on the
boundary between the two grain sizes.
7.
More on the grain-size scaleStrictly speaking, there should
be 4 divisions for siltstone on the
phi scale. However, because it is
impossible to resolve these with
the naked eye, most logging
sheets have relatively narrow
columns for siltstone and
mudstone. Once sediments
become this fine, they generally
consist of a mixture of silt-sized
grains of quartz, feldspar etc.
and finer clay minerals. Because
of this, many sedimentologists
prefer to divide the fine
sediments into argillaceous
siltstone (when the silt is
dominant) and silty mudstone
when the clay minerals are
dominant.
The scale above stops at pebbles
of 32mm (3.2cm) diameter. If
coarser grains exist (for example
in a conglomerate). The scale can
be extended to the right.
As its name suggests, the grain-size scale is for granular sediments.
Any sediments (or other rock types) that do not consist of discrete
grains cannot really be plotted on the grain-size scale. Note that, on
the scale above, anhydrite and coal are given an arbitrary position on
the grainsize scale.
8.
Lithological symbolsThe lithological symbols shown here are not as clear as
they might be. The best version of the logging legend
that I have is, unfortunately, in my office at HeriotWatt, which is inaccessible during the Covid 19 crisis.
On a sedimentary log, it is usual to mark a change of
lithology symbol by a horizontal line at the appropriate
depth.
Note that, as there is only one symbol for sandstone, a
change from, for example, medium sandstone to fine
sandstone is not marked by a horizontal line.
9.
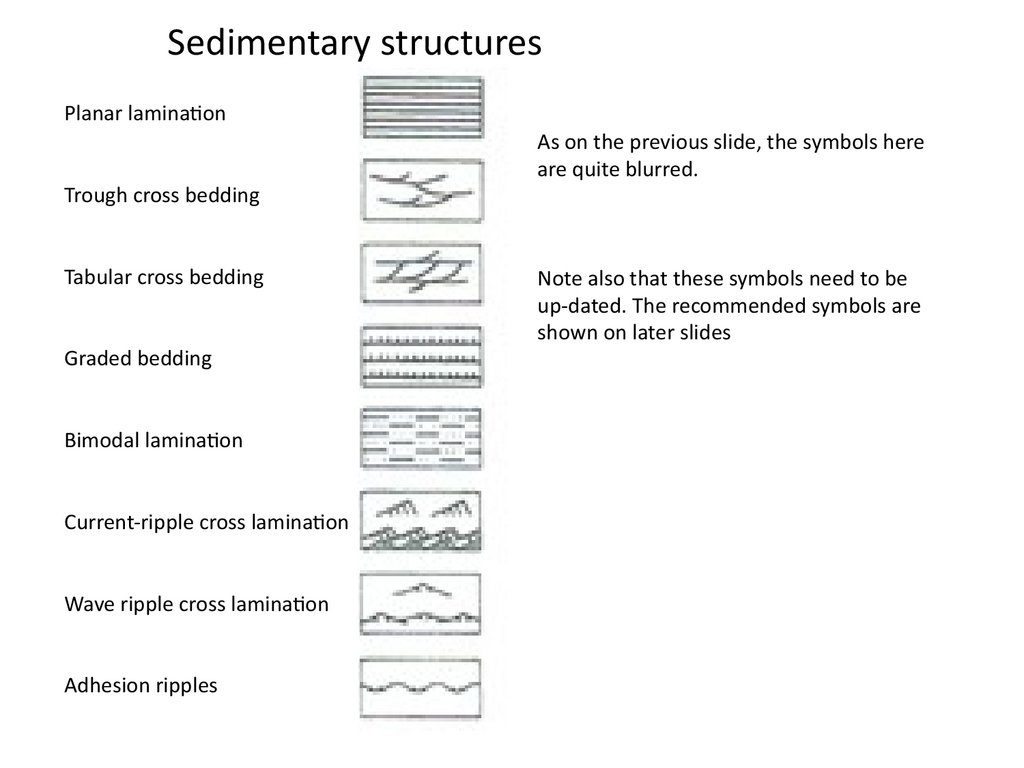
Sedimentary structuresPlanar lamination
As on the previous slide, the symbols here
are quite blurred.
Trough cross bedding
Tabular cross bedding
Graded bedding
Bimodal lamination
Current-ripple cross lamination
Wave ripple cross lamination
Adhesion ripples
Note also that these symbols need to be
up-dated. The recommended symbols are
shown on later slides
10.
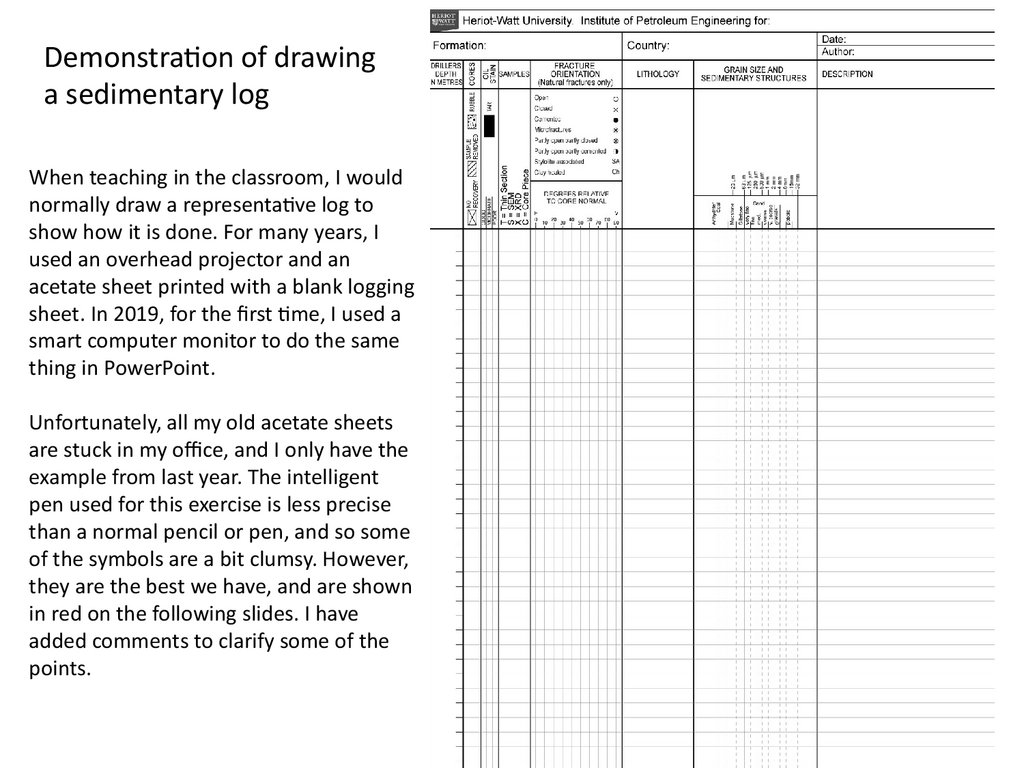
Demonstration of drawinga sedimentary log
When teaching in the classroom, I would
normally draw a representative log to
show how it is done. For many years, I
used an overhead projector and an
acetate sheet printed with a blank logging
sheet. In 2019, for the first time, I used a
smart computer monitor to do the same
thing in PowerPoint.
Unfortunately, all my old acetate sheets
are stuck in my office, and I only have the
example from last year. The intelligent
pen used for this exercise is less precise
than a normal pencil or pen, and so some
of the symbols are a bit clumsy. However,
they are the best we have, and are shown
in red on the following slides. I have
added comments to clarify some of the
points.
11.
Let’s lookfirst at the
grain-size
curve, bed
bases etc.,
and the
lithology
column
Irregular calcite nodules.
Several nodules can be shown
as being calcitic by a single I
and multiple arrows.
Angular mudstone intraclasts
(shown in the lithology column
because they would have an
impact on GR)
Interval cemented by calcite
(shown as upper case I)
Erosive bases can be shown
dipping to the left or right
(see red images on the
right). The lower image is
generally used, as the
erosive nature is more
obvious (the upper image
can look a bit too much like
upwards-coarsening).
Erosive bed base cuts down by about 40cm
Top of this bed is marked by current ripples
It is not always necessary to completely fill in
the lithology (though it will have to be done for
final presentation!). The arrows here indicate
that the lithology symbols should continue.
Top of bed shows upwards-fining over several cms
Again, solid line marks change in lithology
Sandstone symbols. Note also solid line at top and bottom.
Silty mudstone/shale symbol (rows of dashes)
Gradational bed top – does not extend across column
Sharp bed base – extends right across grain-size column
12.
Now for thesedimentary
structures
Pebbles
Rounded sandstone clast
Angular mudstone intraclasts
(also shown in lithology column)
Rippled upper surface of sandstone bed
Compound structures – deformed cross
lamination, laminae cut by burrows etc.
Horizontal and vertical burrows
Deformed sandstone laminae in argillaceous siltstone
Climbing ripple cross lamination (one
ripple shown climbing over another).
The length and vertical spacing of the lines can be
used to illustrate the clarity of planar lamination.
In this case, there are distinct laminae at the base,
becoming less clear upwards
Planar lamination (they should be drawn a bit
straighter than this!)
The two dots indicate laminae of coarser sediment (in this
case flat lamination and cross lamination) in finer sediment.
Current ripple cross lamination
13.
More onsedimentary
structures,
etc.
For correct truncation,
draw upper surface (1)
first, then lower surface
(2). See also comments
below.
Current ripple cross lamination
Wave ripple cross lamination
The brackets round the ripple symbol indicate
that the cross lamination is indistinct
Coal – draw as black in both columns
Stop laminae before both sides of the grainsize
interval. If they touch both sides (as on the
lower 2/3), the interval looks like it consists of
several beds, not a single laminated bed.
Rootlets
Tabular cross bedding with planar foresets
Tabular cross bedding with curved foresets
Trough cross bedding
Upper surface cuts the
lower surface - OK. See
also the two diagrams at
extreme top right.
Upper surface is
truncated by the lower
surface – geologically
impossible!
14.
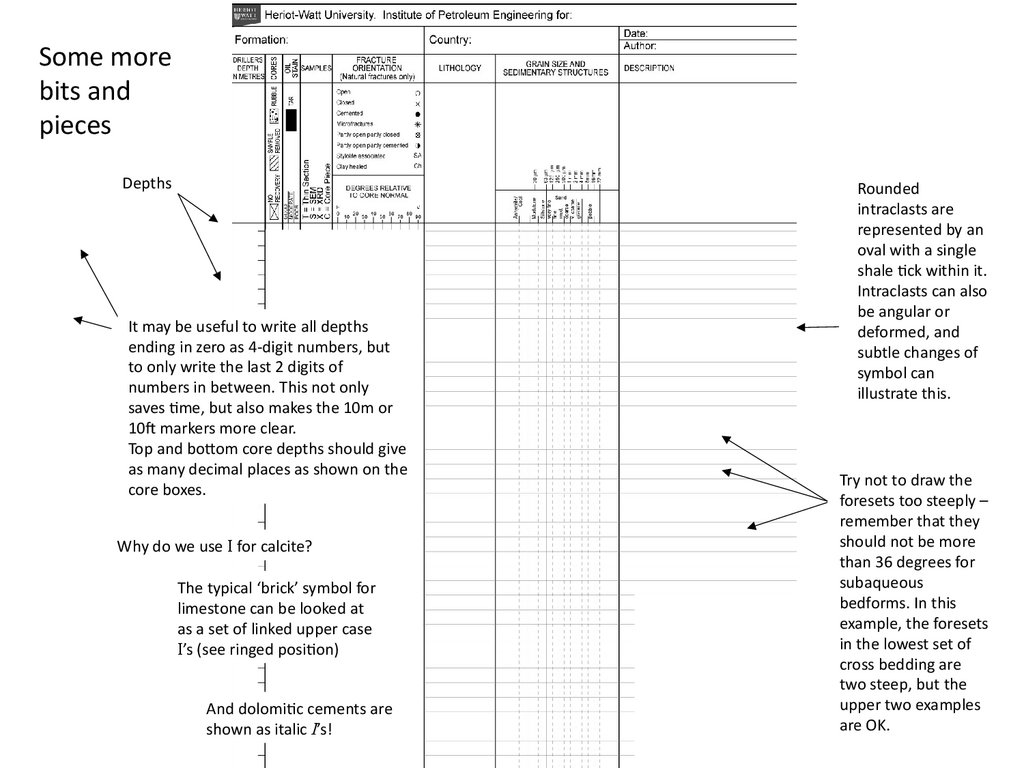
Some morebits and
pieces
Depths
It may be useful to write all depths
ending in zero as 4-digit numbers, but
to only write the last 2 digits of
numbers in between. This not only
saves time, but also makes the 10m or
10ft markers more clear.
Top and bottom core depths should give
as many decimal places as shown on the
core boxes.
Why do we use I for calcite?
The typical ‘brick’ symbol for
limestone can be looked at
as a set of linked upper case
I’s (see ringed position)
And dolomitic cements are
shown as italic I’s!
Rounded
intraclasts are
represented by an
oval with a single
shale tick within it.
Intraclasts can also
be angular or
deformed, and
subtle changes of
symbol can
illustrate this.
Try not to draw the
foresets too steeply –
remember that they
should not be more
than 36 degrees for
subaqueous
bedforms. In this
example, the foresets
in the lowest set of
cross bedding are
two steep, but the
upper two examples
are OK.
15.
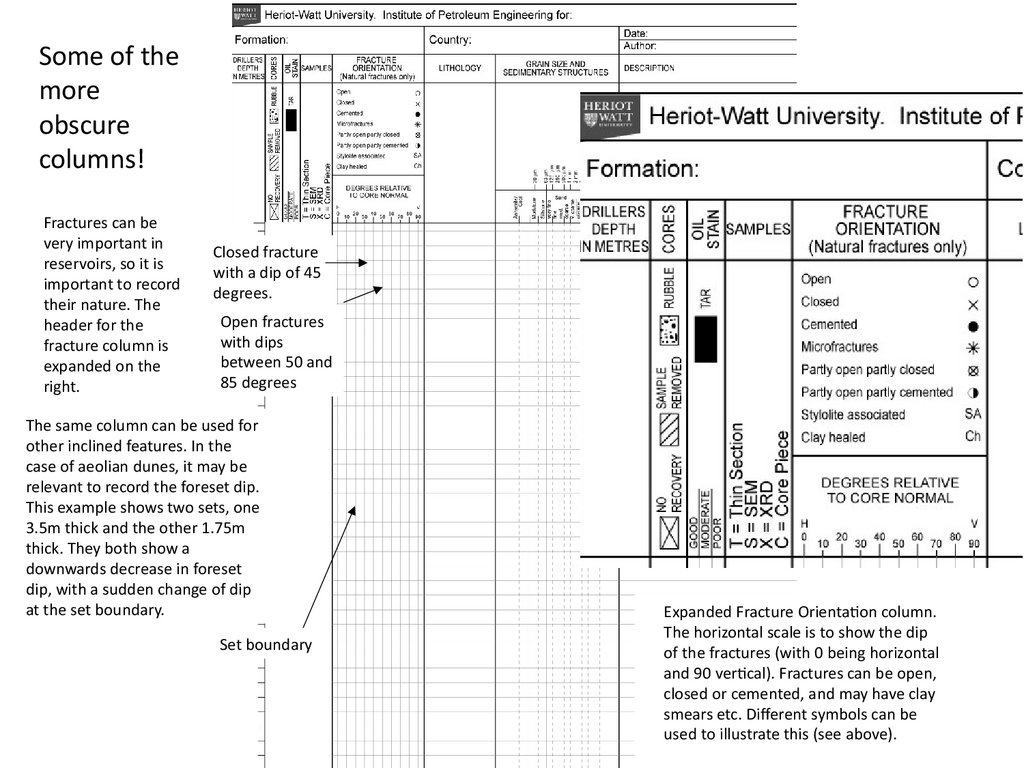
Some of themore
obscure
columns!
Fractures can be
very important in
reservoirs, so it is
important to record
their nature. The
header for the
fracture column is
expanded on the
right.
Closed fracture
with a dip of 45
degrees.
Open fractures
with dips
between 50 and
85 degrees
The same column can be used for
other inclined features. In the
case of aeolian dunes, it may be
relevant to record the foreset dip.
This example shows two sets, one
3.5m thick and the other 1.75m
thick. They both show a
downwards decrease in foreset
dip, with a sudden change of dip
at the set boundary.
Set boundary
Expanded Fracture Orientation column.
The horizontal scale is to show the dip
of the fractures (with 0 being horizontal
and 90 vertical). Fractures can be open,
closed or cemented, and may have clay
smears etc. Different symbols can be
used to illustrate this (see above).
16.
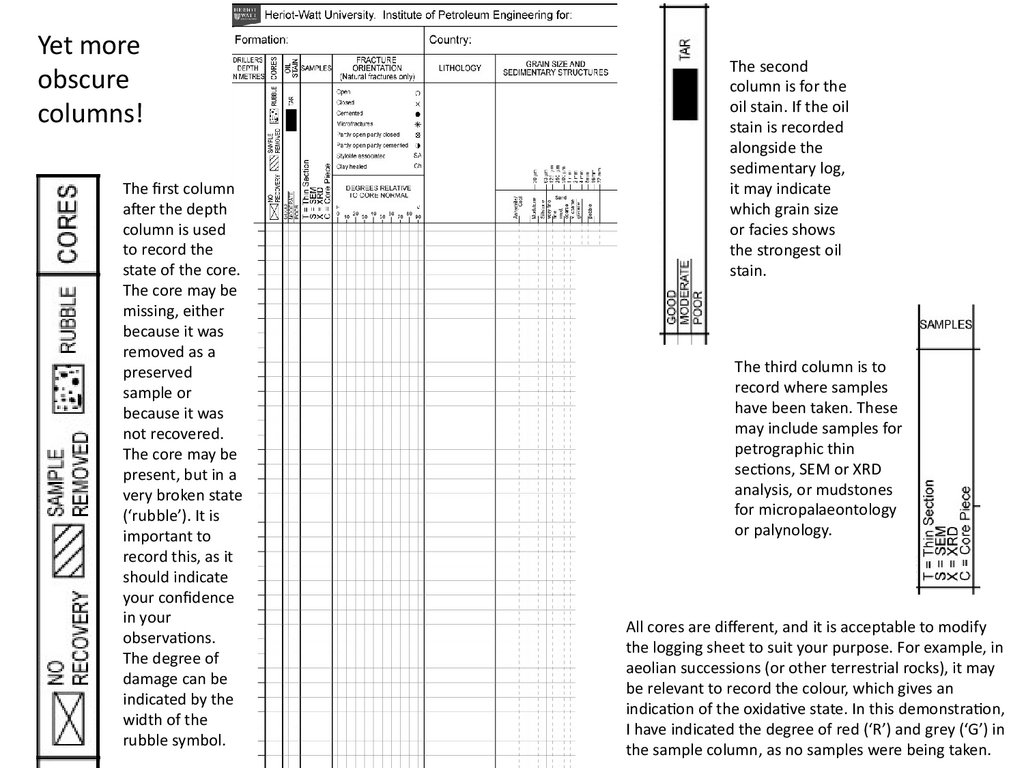
Yet moreobscure
columns!
The first column
after the depth
column is used
to record the
state of the core.
The core may be
missing, either
because it was
removed as a
preserved
sample or
because it was
not recovered.
The core may be
present, but in a
very broken state
(‘rubble’). It is
important to
record this, as it
should indicate
your confidence
in your
observations.
The degree of
damage can be
indicated by the
width of the
rubble symbol.
The second
column is for the
oil stain. If the oil
stain is recorded
alongside the
sedimentary log,
it may indicate
which grain size
or facies shows
the strongest oil
stain.
The third column is to
record where samples
have been taken. These
may include samples for
petrographic thin
sections, SEM or XRD
analysis, or mudstones
for micropalaeontology
or palynology.
All cores are different, and it is acceptable to modify
the logging sheet to suit your purpose. For example, in
aeolian successions (or other terrestrial rocks), it may
be relevant to record the colour, which gives an
indication of the oxidative state. In this demonstration,
I have indicated the degree of red (‘R’) and grey (‘G’) in
the sample column, as no samples were being taken.
17.
All of this wasdrawn very
rapidly to
illustrate the
techniques of
logging.
The resulting log was
very untidy, but it
hopefully illustrates what
you need to know to
produce your own log.
Good luck!