


")


 with Ohio University EM Model and Flight Measurements")


")
")


")


")


")


")


")


")


 electronics
Similar presentations:


Summary of Approach Simulations to Assess VHF Compatibility for GLS/ILS/VOR
1. Summary of Approach Simulations to Assess VHF Compatibility for GLS/ILS/VOR
Matt Harris, Kira Hein10/11/2016
2. Overview
• Summary of Issue• Simulation Description
• Scenarios
• Results
3. Summary of Issue
• Several navigation aids share the same VHF spectrum (108 – 118 MHz)• VDB – VHF Data Broadcast for GLS
• VOR – VHF Omnidirectional Range
• ILS – Instrument Landing System Localizer
• VHF Comm/Data – Voice Communication and VHF Data Link
• Airborne navigation and landing equipment must be able to operate with minimum desired signal
• with undesired signals much stronger at adjacent channels than the desired signal
• Current ILS, VOR, VDB specification requires compatibility with -46 dB D/U at 75 kHz adjacent and beyond
• Airborne antenna gain variation is allowed to be 7 to 15+ dB, specified in the horizontal direction
4. Summary of Issue, Continued
• Aircraft installation contributes to D/U limits• Antenna gain variation due to difference in direction to desired / undesired
• Antenna gain variation is limited to ~15dB in the horizontal
• Installed antenna gain at low elevations can be overcome by reduced transmission loss
• Mismatch loss variation due to difference in frequency of desired / undesired
• Mismatch loss can vary by 6dB for the worst combination of distant frequencies
• Mismatch loss negligible at close frequency separation
• Signal-in-space D/U must have margin for aircraft installation
• Receiver D/U limit plus installation contribution
• Results in more stringent signal-in-space D/U limit (+10dB?, +15 dB?, +20 dB?)
• Can required D/U performance be constrained with VDB siting constraints?
5. Simulation Overview and Purpose
• Model nav aid transmitters, including transmission loss (ILS, VOR, VDB)• Model aircraft on approach, including aircraft antenna patterns (VOR antenna)
• For each scenario of desired / undesired, determine D/U power levels vs. VDB location (rough precision)
• Can a receiver specification be feasibly determined?
• Does the full installation gain variation margin apply for all cases?
• Can any credit for relative location of transmitters be taken?
Could Study
Studied
Not Studied
Desired \ Undesired
VDB
VDB
VOR
ILS Overfly
ILS Far End
VOR
ILS Far End
VHF Comm/Data
N/A
VHF Comm/Data
6. Simulation Description
1. Simulate Aircraft on Approach• 3 degrees, 2.25 degrees (full scale low), 1.35 degrees (minimum service coverage)
• 2 mile runway length
2. Simulate Airborne Receive Antenna Patterns
• No airborne pattern (signal-in-space power level)
• Boeing VOR antenna pattern from scale model measurements
3. Simulate VHF Nav Aids and Transmit Antenna Patterns
ILS near, ILS far, VDB grid, VOR grid
ILS antenna pattern and power levels calibrated with other data
VDB simplistic model calibrated against other higher fidelity models
VOR simplistic model (compared with flight data)
VOR/VDB > 80m from aircraft path
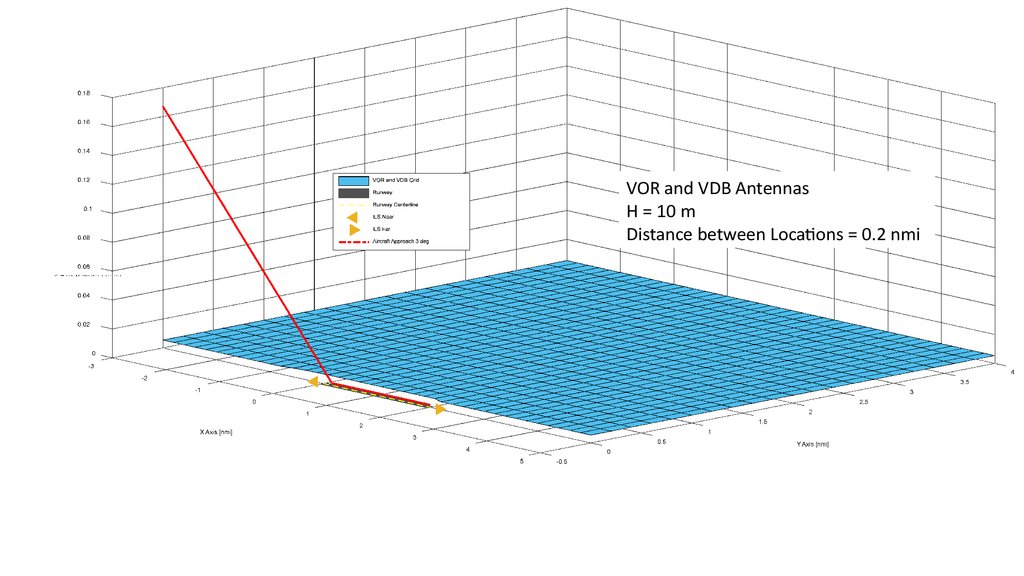
7. 1. Simulate Aircraft on Approach (not to scale)
VDB / VOR Grid Area (8 NM x 4 NM)Antenna on 3-degree Approach, TCH=60ft, H = 10ft above runway during rollout
2.25-degree Path (full scale low on 3-degree)
1.35-degree Path (minimum service coverage)
80m VDB/VOR exclusion
ILS Near
D=305m,
H=3m
2 NM
D=305m,
H=3m
ILS Far
8.
VOR and VDB AntennasH = 10 m
Distance between Locations = 0.2 nmi
9.
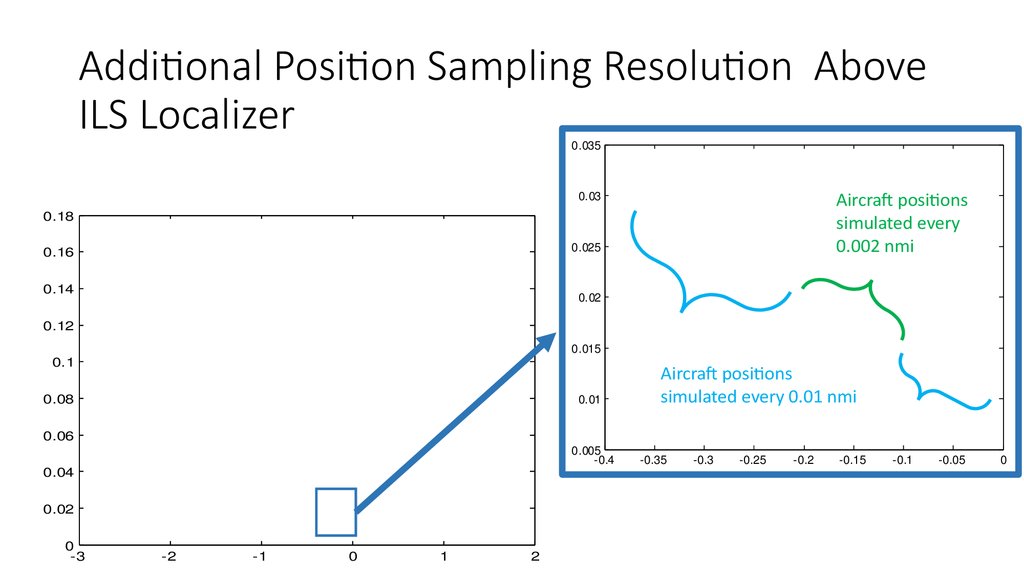
Additional Position Sampling Resolution AboveILS Localizer
0.035
Aircraft positions
simulated every
0.002 nmi
0.03
0.18
0.025
0.16
0.14
0.02
0.12
0.015
0.1
0.08
0.01
0.06
0.005
0.4
0.04
0.02
0
3
2
1
0
1
2
Aircraft positions
simulated every 0.01 nmi
0.35
0.3
0.25
0.2
0.15
0.1
0.05
0
10. 2. Simulate Airborne Antenna Patterns
• Simulate no Airborne Antenna Pattern• Provides Signal-In-Space Desired / Undesired ratio (SIS D/U)
• Accounts for transmission loss for actual transmitter locations
• Boeing VOR antenna pattern from scale model measurements
• Proprietary installed patterns will not be published or shared
• Measurements smoothed from 0.1 degree resolution to reduce spikes
• Spikes believed to be an artifact of the scale model measurement setup
• average of nearest values +/- 0.1 degrees
• Max and min values in a [3-degree] az/el window were determined
• Selected higher gain pattern for undesired, lower gain for desired signal
• Difference in D/U with and without antenna pattern
11. 3. Simulate VHF Nav Aids and Transmit Patterns
• ILS LOC• VOR
• VDB
12. 1. Simulate ILS LOC Signal Strength
60dBmpeak
ILS Localizer Antenna Pattern
Source: Stefan Müller and Felix Butsch and Helmut
Günzel, “Investigation of GBAS frequency protection
requirements at third adjacent channel and beyond,” DFS
Deutche Flugsicherung GmbH, Version 0.10, 13.11.2015
ILS Path Loss 1/r Behavior within ½ Far Field
(One-Half Far Field Boundary ~ 2700 feet)
Source: Orville Nyhous letter to RTCA SC-159 WG4 VDB ad-hoc team,
“Computation of Received Signal Levels in the Near Field Region of a Localizer
(LOC)”, May 2016 – Picture from Van Valkenburg, M. E., Reference Data for
Engineers: Radio, Electronics, Computer, and Communications, Eighth Edition,
SAMS, Prentice Hall, 1993, Page 32-7.
13. ILS Signal Strength Equation
• FSPL(distance < 822.7611 m)= 10*log10(distance) + 20*log10(108 MHz) – 147.55 + 29.1527
• FSPL(distance >822.7611 m)
= 20*log10(distance) + 20*log10(108 MHz) – 147.5
• SignaldBW = PTx + Gain from Antenna Pattern (Relative to Main Beam)
+ Main Beam Gain + FSPL - 30
• SignaldBW = 47 dBm + Gain from Antenna Pattern + 13 dB + FSPL - 30
14. Simulated Approach Height vs. LOC Distance
Comparing simulated antennaheights with heights above LOC
antenna simulated by Jules Hermen
on next slides
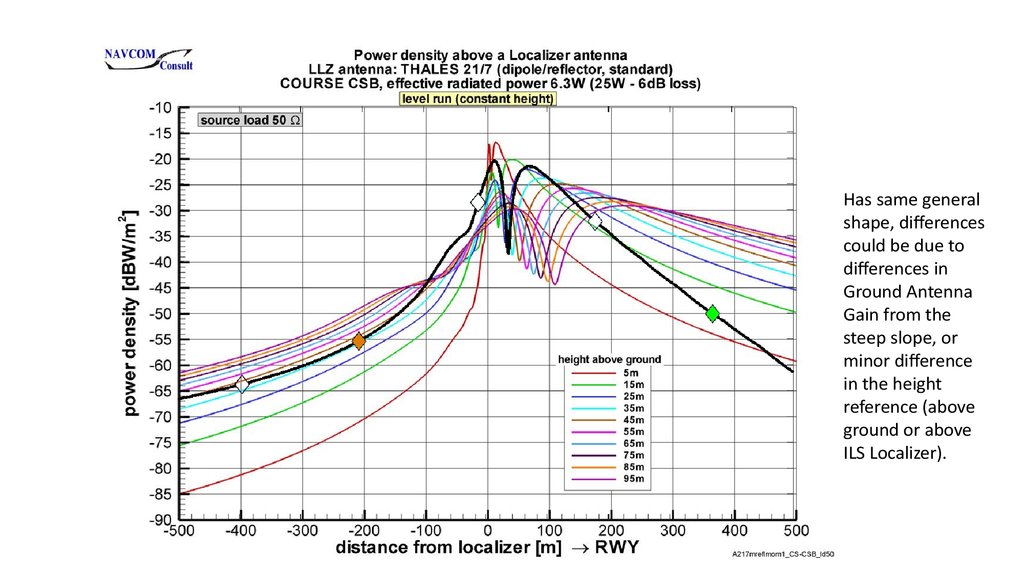
15.
Has same generalshape, differences
could be due to
differences in
Ground Antenna
Gain from the
steep slope, or
minor difference
in the height
reference (above
ground or above
ILS Localizer).
16. Recreating Navcom ILS overflight plots with Simplified Model
Peak near ILS LOC antenna(@100’ height above LOC):
Navcom = -25dBm
Simplified Model = -22dBm
0
5
5 m
15 m
25 m
35 m
45 m
55 m
65 m
75 m
85 m
95 m
10
15
20
Signal in Space [dBW]
25
30
35
40
45
50
55
60
65
70
Due to a jump in the traced
Transmitter gain antenna
75
80
85
90
500
400
300
200
100
0
100
200
300
Distance from Localizer Heading Towards Runway [m]
400
500
17. 2. Simulate VDB Signal Strength
• VDB simplified model• Simulated as omnidirectional with transmit power of 47 dBm (50W)
• No transmission losses assumed, path loss simulated as 1/r2
• Matches Ohio University model fairly well (ignoring fades)
18. Compare Simple VDB Model (Red) with Ohio University EM Model and Flight Measurements
Signal Strength (dBm)HPOL Antenna Performance (2,000 ft) (E1 Tx = 60 ft)
20
40
60
80
0
5
10
15
20
25
30
OU Model
VPOL Antenna Performance (2,000 ft) (E1 Tx = 60 ft)
Signal Strength (dBm)
Flight Data
Simplified Model
20
40
60
80
0
5
10
15
20
Distance to VDB Tx (NM)
25
30
From: Skidmore, Wilson, Dickinson, Nyhus, “The LAAS VHF Data Broadcast Modeling, Siting, Flight Inspection, and Flight Test Results”, ION GPS 2001, Salt Lake City, Utah
19. Comparing HPOL Results
20. Difference OU HPOL Sim and Simple Model
Matches roughly well within +/-5dB, not accounting for fades up to 18 dBThese simulation results will only work as a guideline for validation - actual VDB levels must be used in practice
21. 3. Simulate VOR Signal Strength
• VOR simplified modelSimulated as +6dB gain below 60 degrees elevation, -3dB above 60 degrees
No transmission losses assumed, path loss simulated as 1/r2
Transmit power set to 50 dBm (100W) for D/U calculations
Compared with Bremen flight inspection, setting power to 200W, SIS power
levels using this simple model result in SIS power levels ~15dB too high
22. Compare Simple VOR Model with Bremen Flight Inspection Measurements
• The EIRP is set as 53 dBm (200W) to match Bremen VOR
power
• Ground Antenna Gain is
simulated as:
• -4 dB in the Cone of Silence
(elevation > 60 degrees)
• 6 dB elsewhere
• FSPL = 20*log10(distancemeter) +
20*log10(117.45 MHz) – 147.55
• Signal Strength (dBW/m2) =
EIRP (dBm) + GainGroundAntenna –
FSPL – 30
23. Bremen test data vs Simulated VOR Signal (No Simulated Aircraft Antenna)
27 Approach, Go Around – VOR overflight at 50’27 Approach Go Around – VOR overflight at 400’
24. Bremen test data vs Simulated VOR Signal (No Simulated Aircraft Antenna)
09 Approach – VOR overflight at 400’27 Approach – No VOR overflight
25. Transmit Simplified Models Summary
1. ILS LOC• Simplified model based on NavCom gain vs. el and 1/R, 1/R 2 losses
• Matches well with other NavCom results, but may be a few dB too high for close overflights
2. VDB
• Simplified model is isotropic
• Does not account for up to 15dB fades in real life
• Actual SIS power levels will be accounted for during inspection
3. VOR
• Simplified model has 10dB reduced gain above 60 degrees
• Produces power levels that are about 15dB higher than flight inspection results
• 15dB increase in undesired VOR coincidentally covers lack of VDB fade modeling
26. D/U Simulation Results
27. D/U Simulation Scenarios
1. VDB Desired / ILS Near Undesired2. VDB Desired / ILS Far Undesired
3. VDB Desired / VOR Undesired (and VOR / VDB)
28. VDB Desired / ILS Near Undesired
VDB Location Grid and ILS Near Stable LocationScatter plots for VDB Location
29. Formulas
• EIRPVDB = 47 dBm [1]• EIRPILS in the main beam = 60 dBm [1]
• Gtransmitter,VDB = 0 dB (Isotropic Antenna)
• FSPLILS,D > 822 m = 20*log10(D) + 20*log10(108) – 147.55
• Frequency for the undesired chosen to yield the smaller FSPL
• FSPLILS,D < 822 m = 10*log10(D) + 20*log10(108) – 147.55 + 29.15
• FSPLVDB = 20*log10(D) + 20*log10(117.95) – 147.55
• Frequency for the desired chosen to yield the bigger FSPL
• PVDB = EIRPVDB + Gtransmitter,VDB + GReceiver,VDB – FSPLVDB
• PILS = EIRPILS + Gtransmitter,ILS + GReceiver,ILS – FSPLILS
• D/U = PVDB – PILS
[1] Source: Stefan Müller and Felix Butsch and Helmut Günzel, “Investigation of GBAS frequency protection requirements at third adjacent channel and beyond,” DFS Deutche Flugsicherung GmbH, Version 0.10, 13.11.2015
30. Explanation on the Scatter plots
• Each circle corresponds with a GBAS antenna location.• If the dot is green then no VDB antenna location causes the D/U for
that GBAS location to go below the threshold.
• If VDB antenna locations cause the D/U to go below the threshold
then the color corresponds with the worst case.
• If the color is not green, the size of the dot corresponds with how
many times a VDB antenna on the grid was less than the threshold.
• The color bar on the right only appears if there is a GBAS antenna
location that is not green.
31. Full A/C Flight Path
32. FPA = 1.35 degrees (lower edge of coverage)
• Plot 1 : Plots of the D/U vs. Position• Plot 2 : Scatterplot of Threshold = -46
• Plot 3 : Scatterplot of Threshold = -59
• Plot 4 : Scatterplot of Threshold = -67
1
2
3
4
Threshold = the limit of the D/U required to be tolerable at the receiver input
33. 1.35 Degrees, No Antenna , U = ILS Near
34. 1.35 Degrees, Boeing VOR , U = ILS Near
35. FPA = 2.25 degrees (full scale low)
• Plot 1 : Plots of the D/U• Plot 2 : Scatterplot of Threshold = -46
• Plot 3 : Scatterplot of Threshold = -59
• Plot 4 : Scatterplot of Threshold = -67
1
2
3
4
Threshold = the limit of the D/U required to be tolerable at the receiver input
36. 2.25 Degrees, No Antenna , U = ILS Near
37. 2.25 Degrees, Boeing VOR , U = ILS Near
38. FPA = 3 degrees (On Glideslope)
• Plot 1 : Plots of the D/U• Plot 2 : Scatterplot of Threshold = -46
• Plot 3 : Scatterplot of Threshold = -59
• Plot 4 : Scatterplot of Threshold = -67
1
2
3
4
Threshold = the limit of the D/U required to be tolerable at the receiver input
39. 3 Degrees, No Antenna , U = ILS Near
40. 3 Degrees, Boeing VOR , U = ILS Near
41. A/C Flight Path to 200 ft
42. FPA = 1.35 degrees (Lowest Coverage)
• Plot 1 : Plots of the D/U• Plot 2 : Scatterplot of Threshold = -46
• Plot 3 : Scatterplot of Threshold = -59
• Plot 4 : Scatterplot of Threshold = -67
1
2
3
4
Threshold = the limit of the D/U required to be tolerable at the receiver input
43. 1.35 Degrees, No Antenna, U = ILS Near
44. 1.35 Degrees, Boeing VOR, U = ILS Near
45. FPA = 2.25 degrees (Full Scale Low)
• Plot 1 : Plots of the D/U• Plot 2 : Scatterplot of Threshold = -46
• Plot 3 : Scatterplot of Threshold = -59
• Plot 4 : Scatterplot of Threshold = -67
1
2
3
4
Threshold = the limit of the D/U required to be tolerable at the receiver input
46. 2.25 Degrees, No Antenna, U = ILS Near
47. 2.25 Degrees, Boeing VOR, U = ILS Near
48. FPA = 3 degrees (On Glideslope)
• Plot 1 : Plots of the D/U• Plot 2 : Scatterplot of Threshold = -46
• Plot 3 : Scatterplot of Threshold = -59
• Plot 4 : Scatterplot of Threshold = -67
1
2
3
4
Threshold = the limit of the D/U required to be tolerable at the receiver input
49. 3 Degrees, No Antenna, U = ILS Near
50. 3 Degrees, Boeing VOR, U = ILS Near
51. Summary VDB / ILS Near D/U
• Antenna Gain Variation Contribution to worst case D/U at the receiverinput is <<15dB for Boeing VOR antenna
• Worst D/U with Boeing VOR antenna is within 3dB of SIS D/U for any VDB location
• Comparable results for other similar VOR antennas
• Even adding mismatch loss variation would only increase D/U by ~10dB
• This result should be invariant with corrections for real SIS power levels
• Antenna gain variation contribution is only a function of transmitter directions
• VDB overflight = closer to VDB, ILS overflight = VDB not lower antenna gain
• SIS D/U for aircraft above 200 feet HAT is never less than -15 dB
• Even adding 10dB margin for VOR antenna and mismatch variation, and 20 dB for model
simplicity, the VDB/ILS Near D/U above 200 feet is within -46dB
52. VDB Desired / ILS Far Undesired
VDB Location Grid and ILS Far Stable LocationScatter plots for VDB Location
53. Formulas
• EIRPVDB = 47 dBm [1]• EIRPILS in the main beam = 60 dBm [1]
• GTransmitter,VDB = 0 dB (Isotropic Antenna)
• FSPLILS,D > 822 m = 20*log10(D) + 20*log10(108 MHz) – 147.55
• FSPLILS,D < 822 m = 10*log10(D) + 20*log10(108 MHz) – 147.55 + 29.15
• FSPLVDB = 20*log10(D) + 20*log10(117.95 MHz) – 147.55
• PVDB = EIRPVDB + GTransmitter,VDB + GReceiver,VDB – FSPLVDB
• PILS = EIRPILS + GTransmitter,ILS + GReceiver,ILS – FSPLILS
• D/U = PVDB – PILS
[1] Source: Stefan Müller and Felix Butsch and Helmut Günzel, “Investigation of GBAS frequency protection requirements at third adjacent channel and beyond,” DFS Deutche Flugsicherung GmbH, Version 0.10, 13.11.2015
54. Full A/C Flight Path
55. 1.35 Degrees, No Antenna, U = ILS Far
56. 2.25 Degrees, No Antenna, U = ILS Far
57. 3 Degrees, No Antenna, U = ILS Far
58. A/C Flight Path to 200 ft
59. 1.35 Degrees, No Antenna, U = ILS Far
60. 2.25 Degrees, No Antenna, U = ILS Far
61. 3 Degrees, No Antenna, U = ILS Far
62. Summary VDB / ILS Far D/U
• Antenna Gain Variation Contribution to worst case D/U at the receiver inputis <<15dB for Boeing VOR antenna
• Worst D/U with Boeing VOR antenna is within 3dB of SIS D/U for any VDB location
Comparable results for other similar VOR antennas
Even adding mismatch loss variation would only increase D/U by ~10dB
Takeoff heading away from ILS Far using LOC antenna not studied
Takeoff heading away from ILS Far using VOR antenna should be similar
• This result should be invariant with corrections for real SIS power levels
• Antenna gain variation contribution is only a function of transmitter directions
• VDB overflight = closer to VDB
• SIS D/U for aircraft above 200 feet HAT is never less than 0 dB
• Even adding 21dB margin for antenna and mismatch variation, and 20 dB for VDB fades, the
VDB/ILS Far D/U above 200 feet is within -46dB for approaches to 200ft
• SIS D/U for aircraft below 200 feet HAT is only less than 0 dB within ~0.5 miles from
Localizer
63. VDB Desired / VOR Undesired
VDB Location Grid and VOR Location GridScatter plots for VDB Location and VOR Location
64. Assumptions
• VOR antenna is 10 meters above the ground• VDB antenna is 10 meters above the ground
• The airplane height above threshold = 60 ft
• The airborne antenna is 10 ft above the ground once the aircraft is rolling on the runway
• The runway is 2 nmi long
• The grid extends 3 nmi out from both ends of the runway and 4 nmi out from one side
• The aircraft’s flight path begins 3 nmi ground distance from the runway end
• The VDB positions are every 0.2 nmi
• The aircraft steps 0.01 nmi
• The VDB positions less than 80 m from the aircraft flight path were moved in the Y direction so that there
is 80 m separation
• The Undesired VOR had a frequency of 108.025 MHz.
• The Desired VDB had a frequency of 117.95 MHz.
65. Formulas
• EIRPVDB = 47 dBm [1]• EIRPVOR = 50 dBm [1]
• GTransmitter,VDB = 0 dB (Isotropic Antenna)
• GTransmitter,VOR = -4 dB in the “cone of silence” [1]
6 dB elsewhere
• FSPLVOR = 20*log10(D) + 20*log10(108) – 147.55
• FSPLVDB = 20*log10(D) + 20*log10(117.95) – 147.55
• PVDB = EIRPVDB + GTransmitter,VDB + GReceiver,VDB – FSPLVDB
• PVOR = EIRPVOR + GTransmitter,VOR + GReceiver,VOR – FSPLVOR
• D/Points = PVDB – PVOR
[1] Source: Stefan Müller and Felix Butsch and Helmut Günzel, “Investigation of GBAS frequency protection requirements at third adjacent channel and beyond,” DFS Deutche Flugsicherung GmbH, Version 0.10, 13.11.2015
66. Full A/C Flight Path
67. 1.35 Degrees, No Antenna, Points = VDB
Note: The size for locations with the number of cases greater that 25 are clipped to improve readability68. 1.35 Degrees, No Antenna, Points = VOR
Note: The size for locations with the number of cases greater that 25 are clipped to improve readability69. 2.25 Degrees, No Antenna , Points = VDB
Note: The size for locations with the number of cases greater that 25 are clipped to improve readability70. 2.25 Degrees, No Antenna , Points = VOR
Note: The size for locations with the number of cases greater that 25 are clipped to improve readability71. 3 Degrees, No Antenna , Points = VDB
Note: The size for locations with the number of cases greater that 25 are clipped to improve readability72. 3 Degrees, No Antenna , Points = VOR
Note: The size for locations with the number of cases greater that 25 are clipped to improve readability73. A/C Flight Path to 200 ft
74. 1.35 Degrees, No Antenna , Points = VDB
A/C Flight Path to 200 ft1.35 Degrees, No Antenna , Points = VDB
Note: The size for locations with the number of cases greater that 25 are clipped to improve readability
75. 1.35 Degrees, No Antenna , Points = VOR
A/C Flight Path to 200 ft1.35 Degrees, No Antenna , Points = VOR
Note: The size for locations with the number of cases greater that 25 are clipped to improve readability
76. 2.25 Degrees, No Antenna , Points = VDB
A/C Flight Path to 200 ft2.25 Degrees, No Antenna , Points = VDB
Note: The size for locations with the number of cases greater that 25 are clipped to improve readability
77. 2.25 Degrees, No Antenna , Points = VOR
A/C Flight Path to 200 ft2.25 Degrees, No Antenna , Points = VOR
Note: The size for locations with the number of cases greater that 25 are clipped to improve readability
78. 3 Degrees, No Antenna , Points = VDB
A/C Flight Path to 200 ft3 Degrees, No Antenna , Points = VDB
Note: The size for locations with the number of cases greater that 25 are clipped to improve readability
79. 3 Degrees, No Antenna , Points = VOR
A/C Flight Path to 200 ft3 Degrees, No Antenna , Points = VOR
Note: The size for locations with the number of cases greater that 25 are clipped to improve readability
80. Summary VDB / VOR
• Antenna Gain Variation Contribution to worst case D/U at the receiverinput is <<15dB for Boeing VOR antenna
• Worst D/U with Boeing VOR antenna is within 4dB of SIS D/U for any VDB
location
• Comparable results for other similar VOR antennas
• Even adding mismatch loss variation would only increase D/U by ~10dB
• This result should be invariant with corrections for real SIS power levels
• Antenna gain variation contribution is only a function of transmitter directions
• VDB overflight = closer to VDB, VOR overflight = VDB not lower gain
• SIS D/U for aircraft above 200 feet HAT is never less than 0 dB
• Even adding 21dB margin for antenna and mismatch variation, and 20 dB for VDB fades, the
VDB/ILS Far D/U above 200 feet is within -46dB for approaches to 200ft
• SIS D/U for aircraft below 200 feet HAT is only less than 0 dB within ~0.5 miles
from Localizer