


 medicine
Similar presentations:


Compare means (paremetric tests)
1.
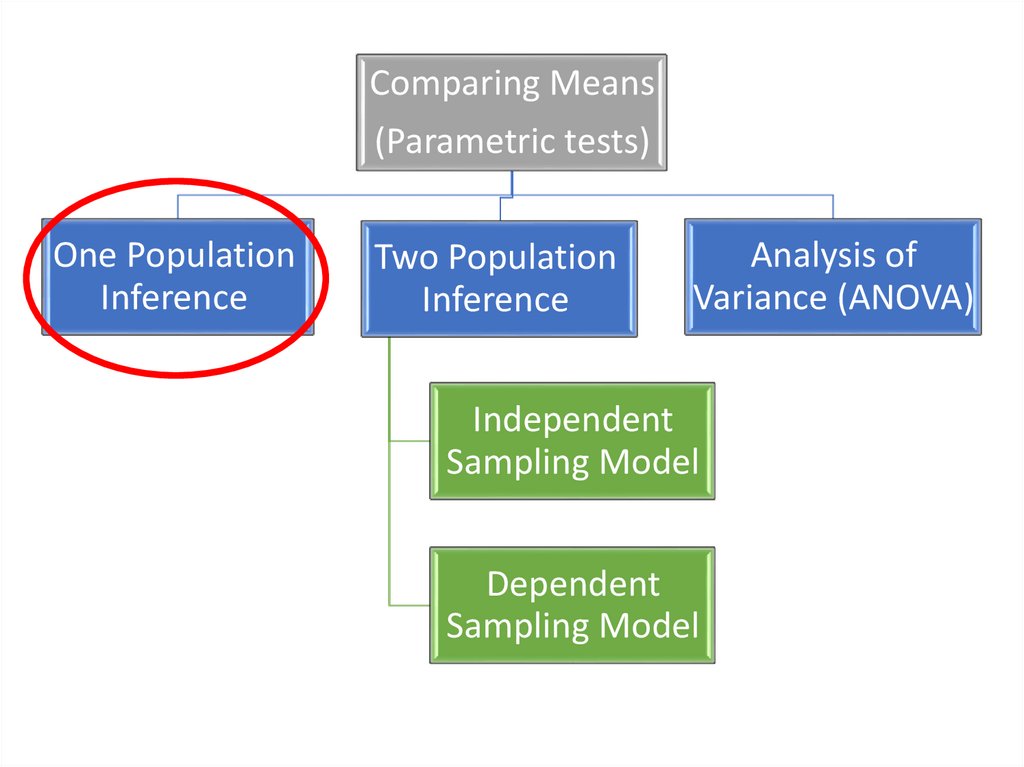
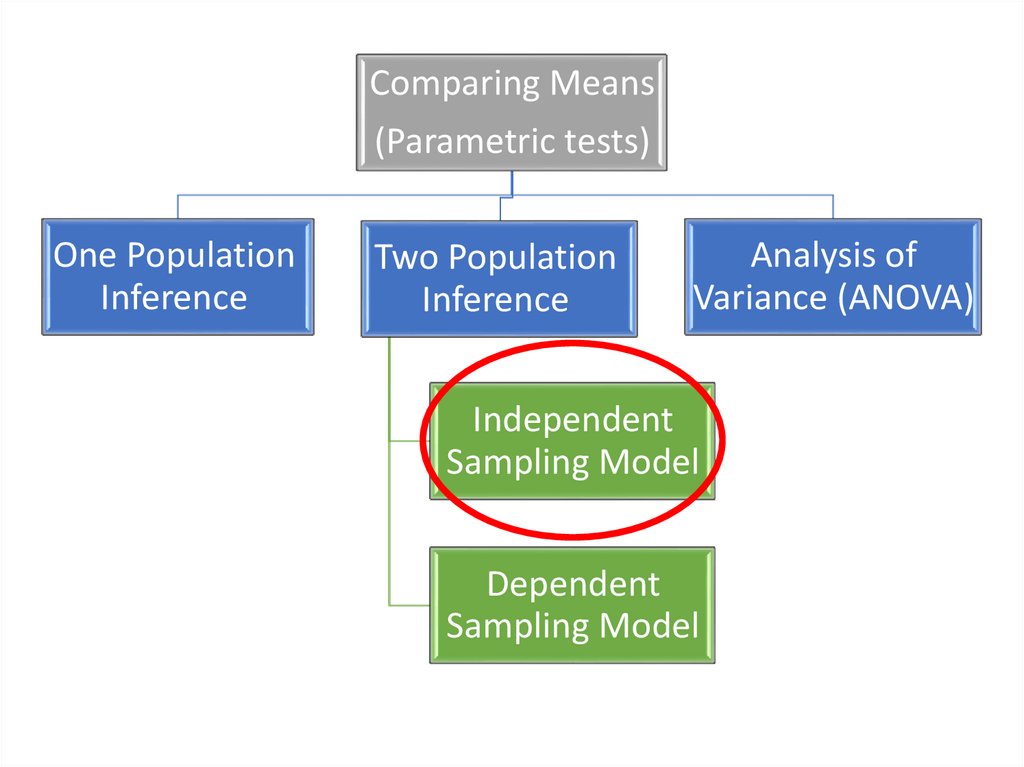
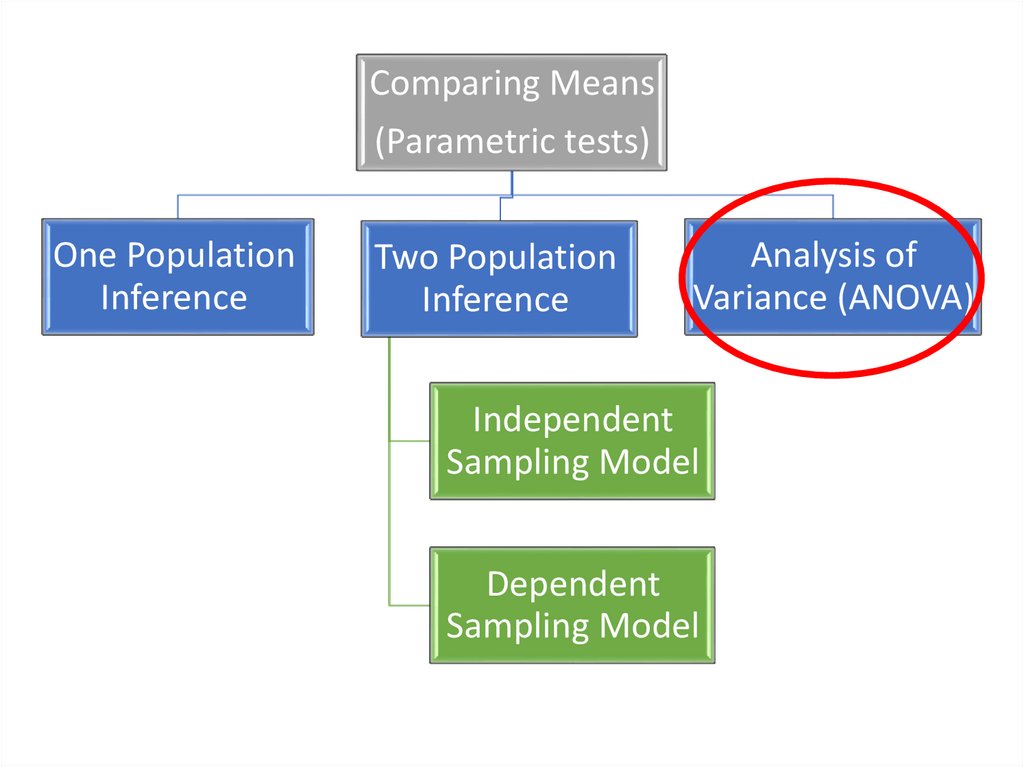
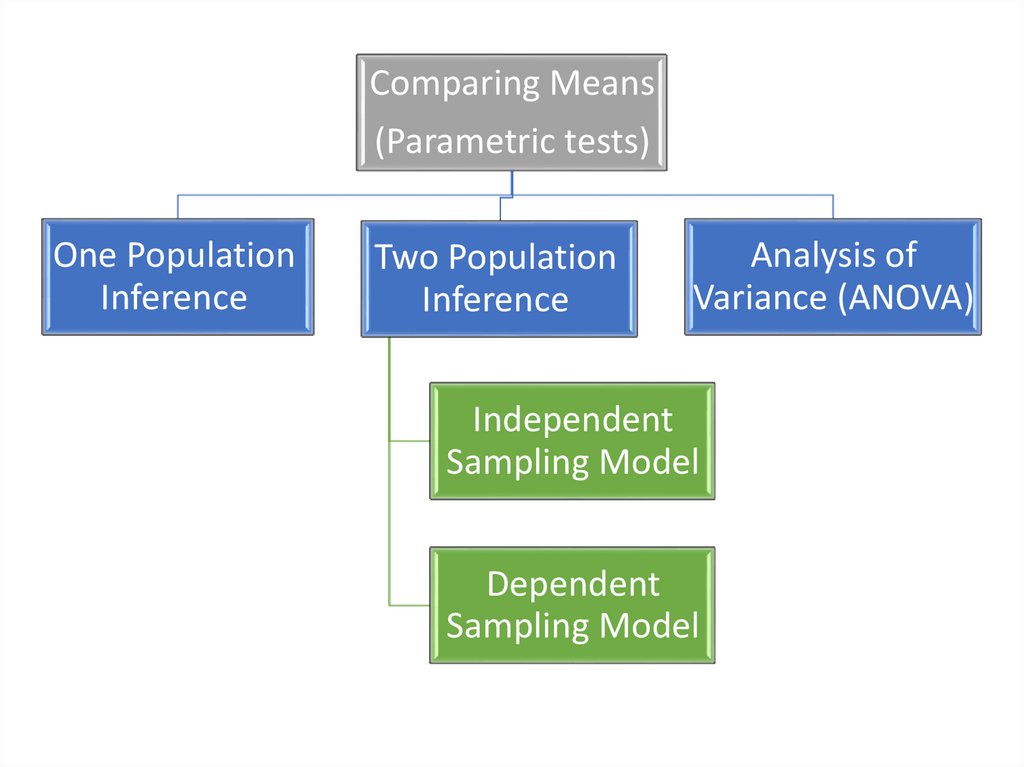
Comparing Means(Parametric tests)
One Population
Inference
Two Population
Inference
Analysis of
Variance (ANOVA)
Independent
Sampling Model
Dependent
Sampling Model
2.
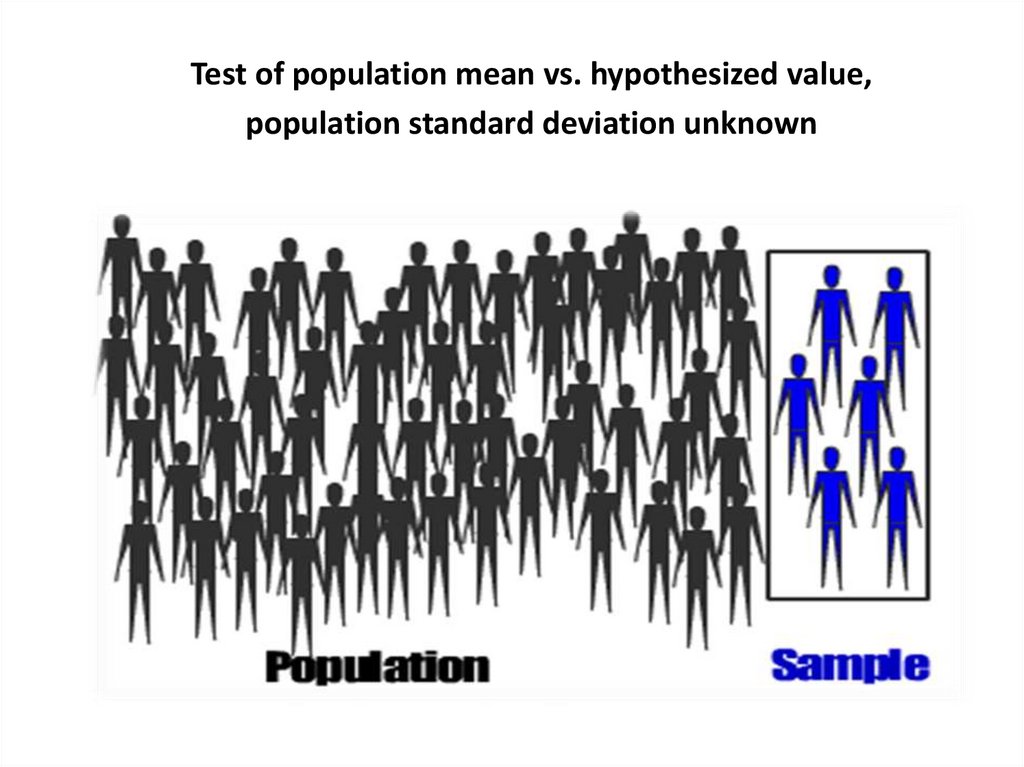
Test of population mean vs. hypothesized value,population standard deviation unknown
3.
4.
5.
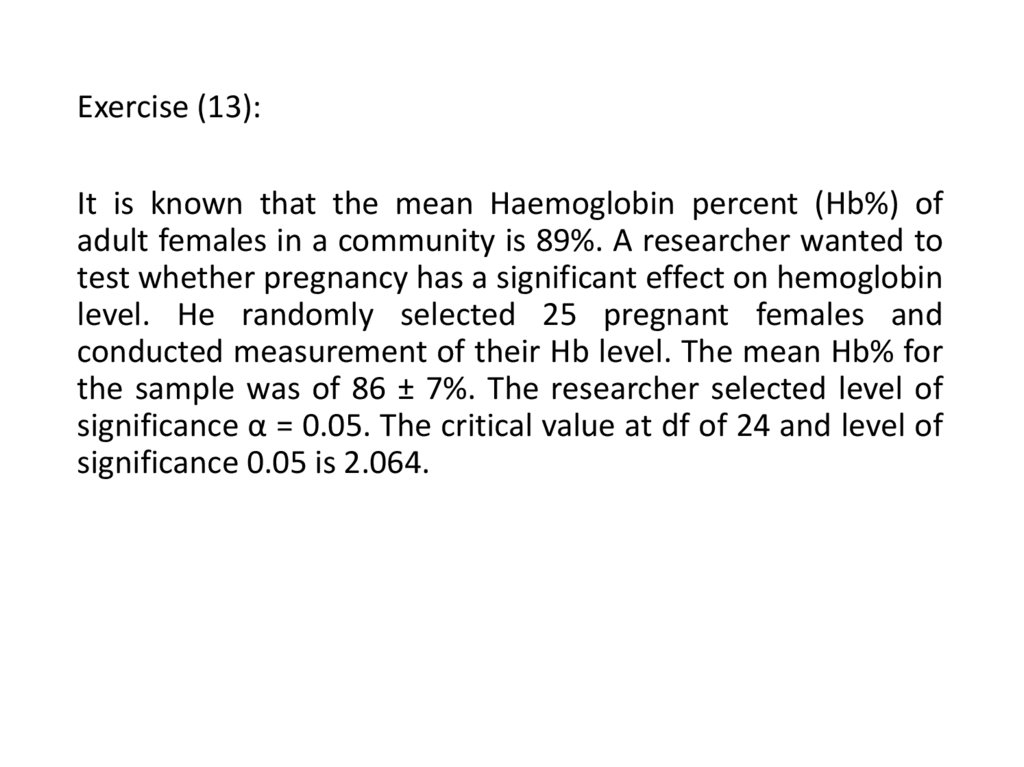
Exercise (13)6.
Exercise (13):It is known that the mean Haemoglobin percent (Hb%) of
adult females in a community is 89%. A researcher wanted to
test whether pregnancy has a significant effect on hemoglobin
level. He randomly selected 25 pregnant females and
conducted measurement of their Hb level. The mean Hb% for
the sample was of 86 ± 7%. The researcher selected level of
significance α = 0.05. The critical value at df of 24 and level of
significance 0.05 is 2.064.
7.
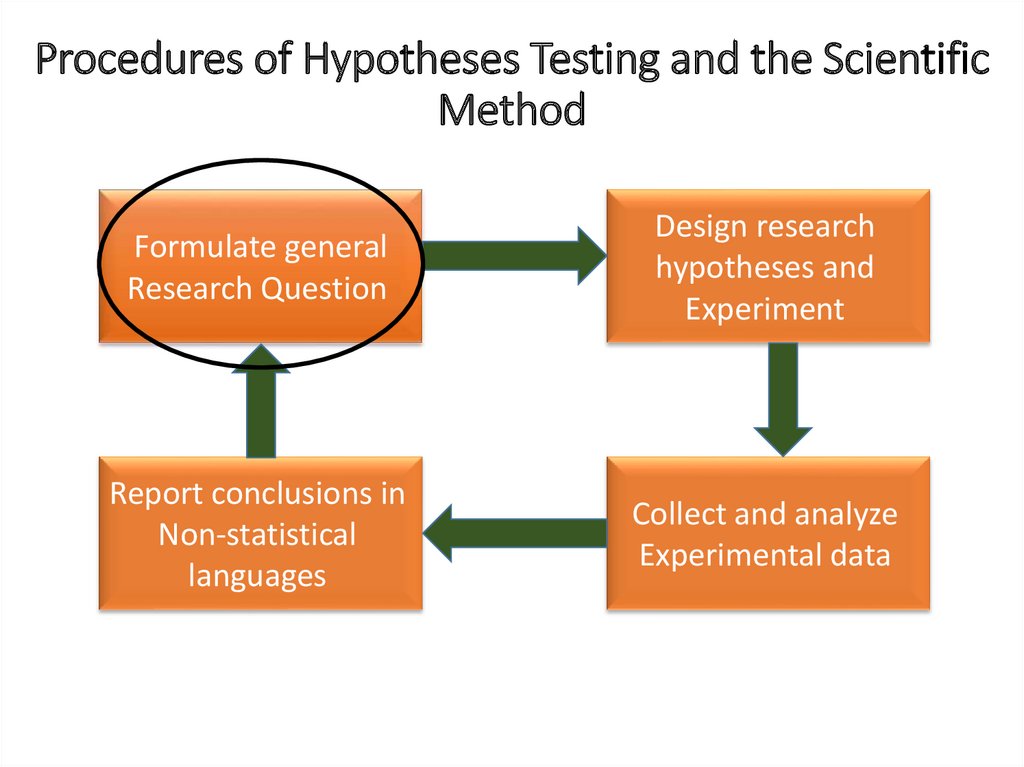
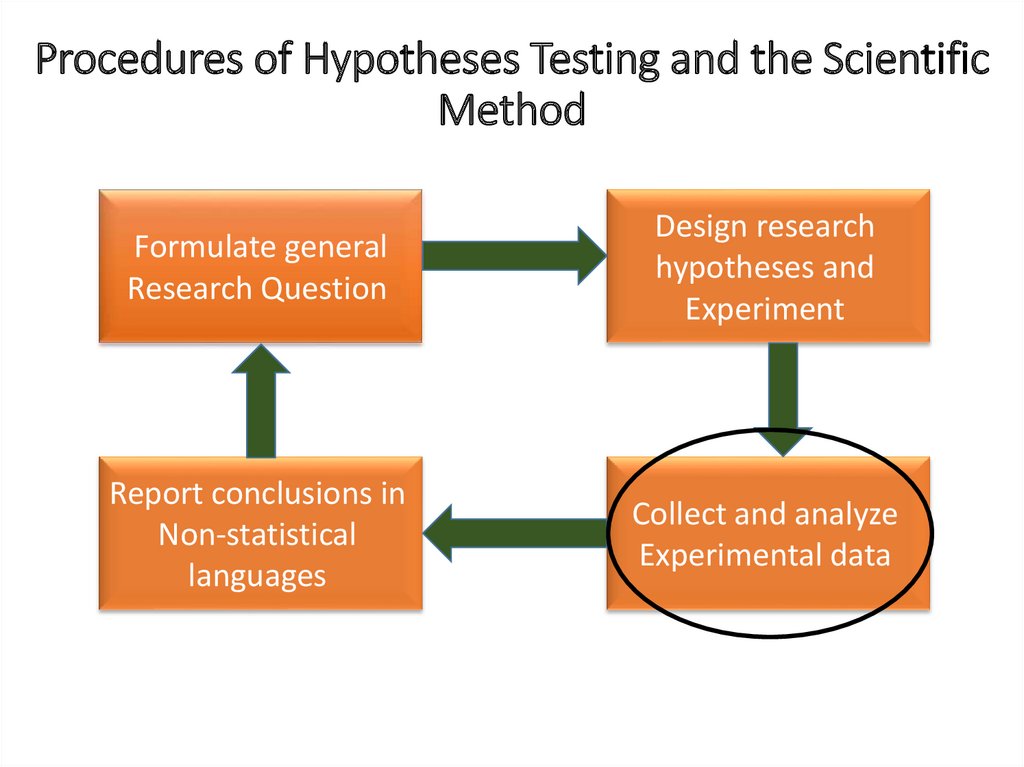
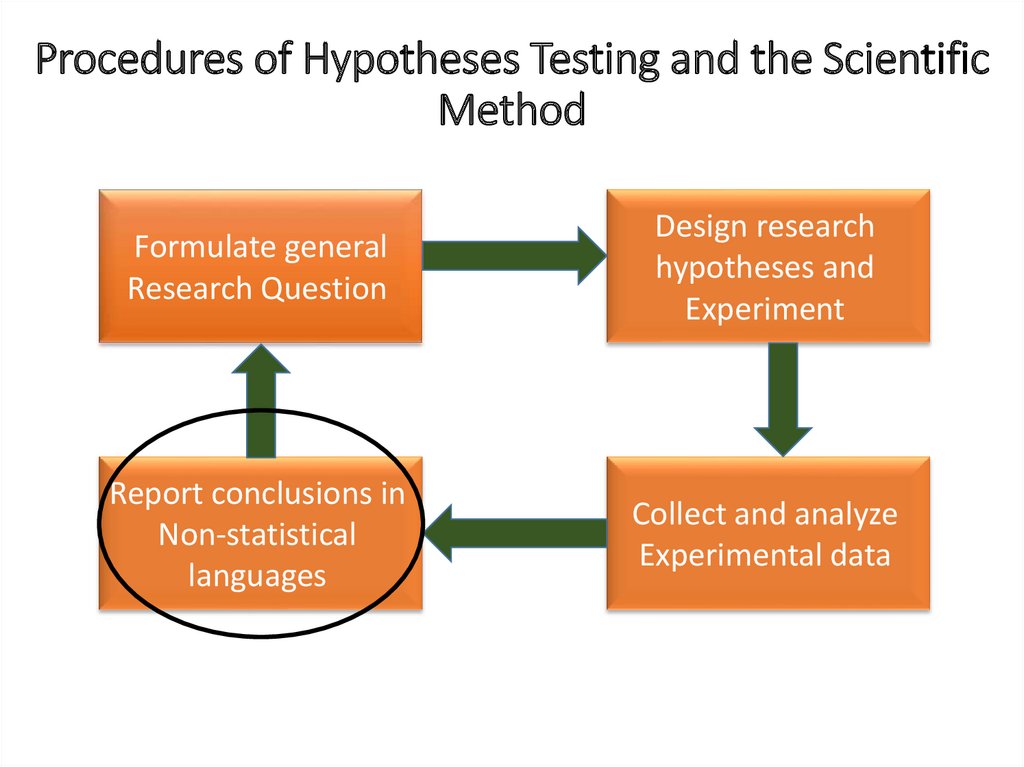
Procedures of Hypotheses Testing and the ScientificMethod
Formulate general
Research Question
Design research
hypotheses and
Experiment
Report conclusions in
Non-statistical
languages
Collect and analyze
Experimental data
8.
I. Formulate general Research QuestionDoes pregnancy have significant effect on mean Hb%?
9.
I. Formulate general Research QuestionDoes pregnancy have significant effect on mean Hb%?
10.
Procedures of Hypotheses Testing and the ScientificMethod
Formulate general
Research Question
Design research
hypotheses and
Experiment
Report conclusions in
Non-statistical
languages
Collect and analyze
Experimental data
11.
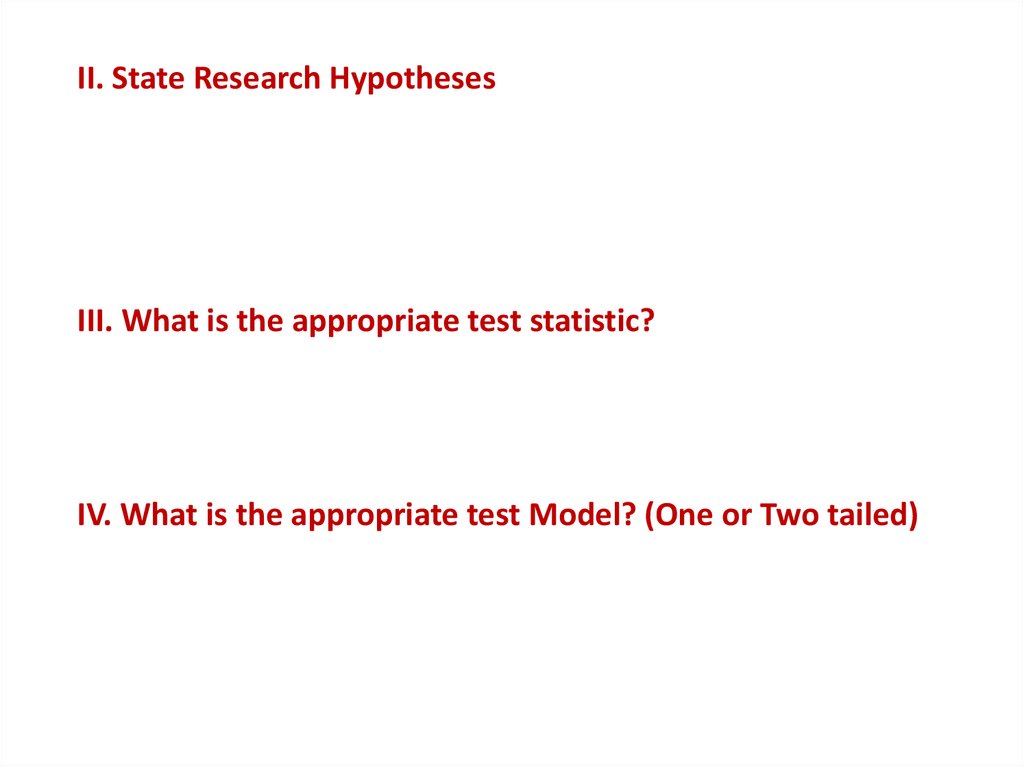
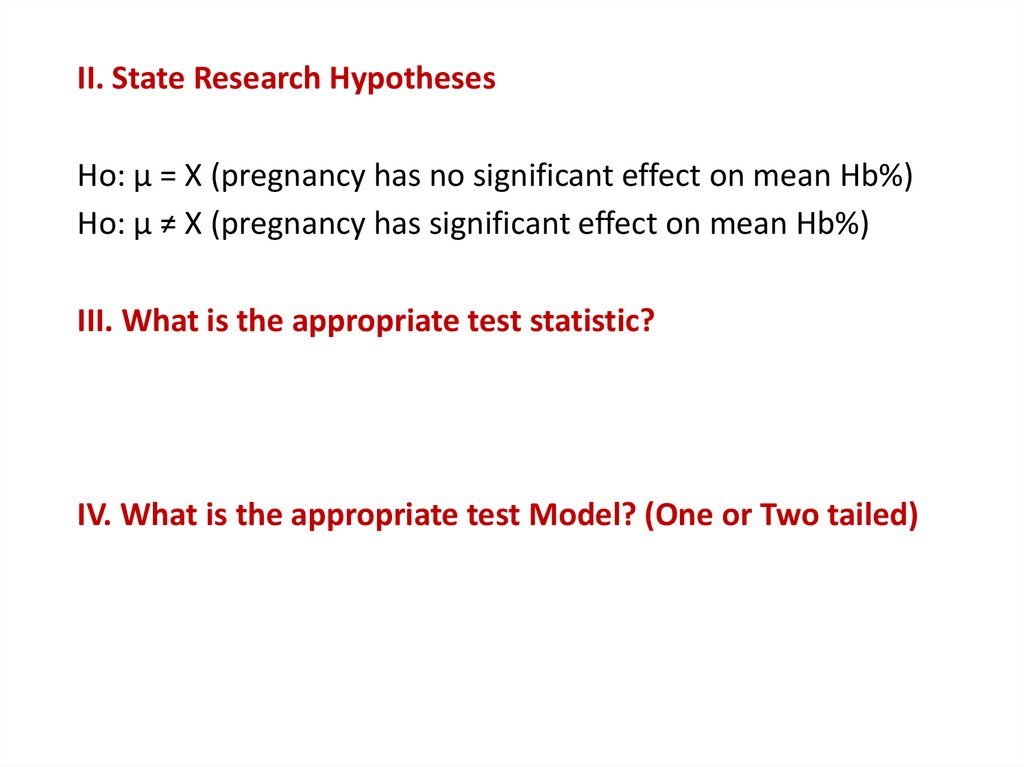
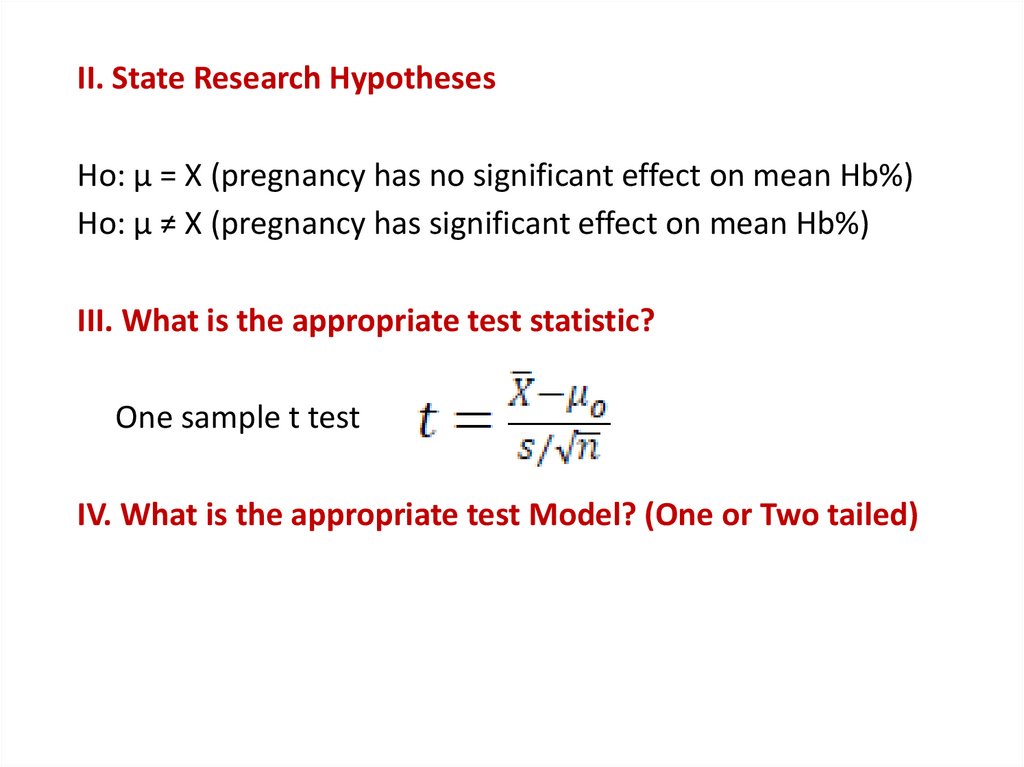
II. State Research HypothesesHo: µ = X (pregnancy has no significant effect on mean Hb%)
Ho: µ ≠ X (pregnancy has significant effect on mean Hb%)
III. What is the appropriate test statistic?
One sample t test
IV. What is the appropriate test Model? (One or Two tailed)
Two Tailed Test Model
12.
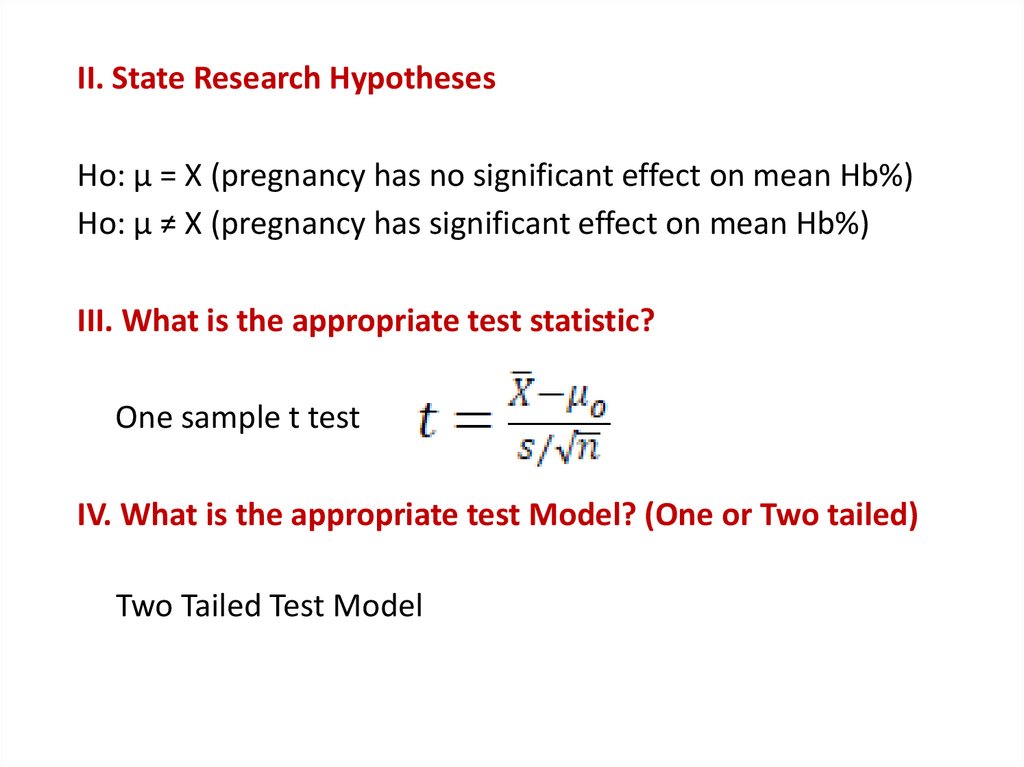
II. State Research HypothesesHo: µ = X (pregnancy has no significant effect on mean Hb%)
Ho: µ ≠ X (pregnancy has significant effect on mean Hb%)
III. What is the appropriate test statistic?
One sample t test
IV. What is the appropriate test Model? (One or Two tailed)
Two Tailed Test Model
13.
II. State Research HypothesesHo: µ = X (pregnancy has no significant effect on mean Hb%)
Ho: µ ≠ X (pregnancy has significant effect on mean Hb%)
III. What is the appropriate test statistic?
One sample t test
IV. What is the appropriate test Model? (One or Two tailed)
Two Tailed Test Model
14.
II. State Research HypothesesHo: µ = X (pregnancy has no significant effect on mean Hb%)
Ho: µ ≠ X (pregnancy has significant effect on mean Hb%)
III. What is the appropriate test statistic?
One sample t test
IV. What is the appropriate test Model? (One or Two tailed)
Two Tailed Test Model
15.
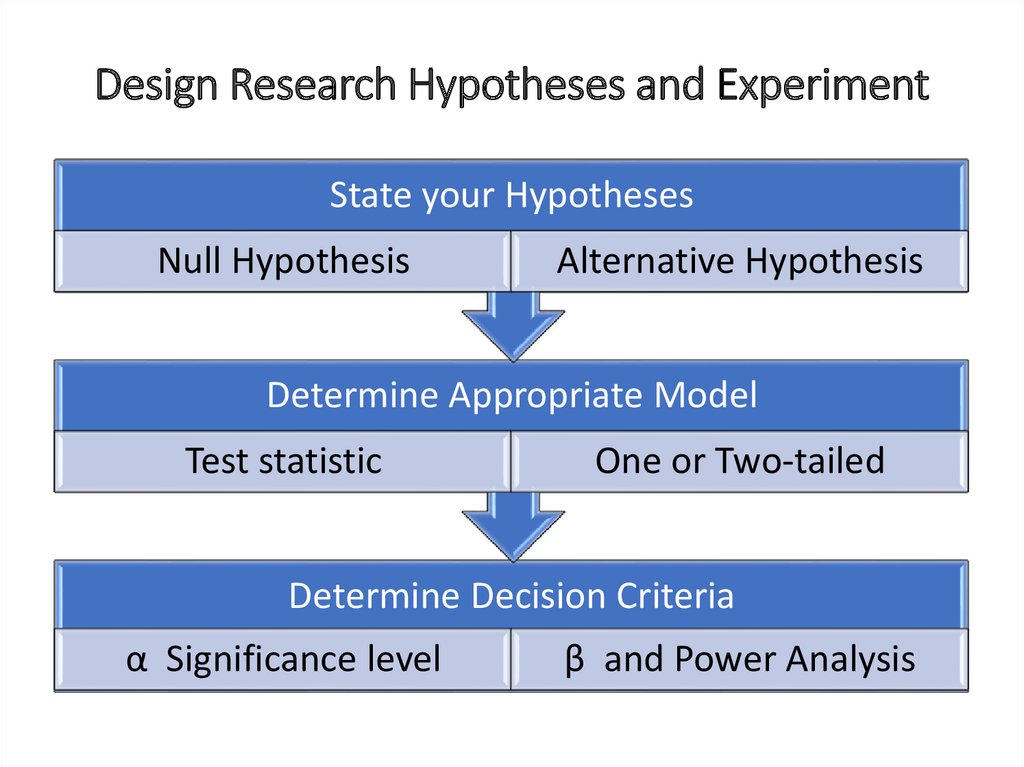
Design Research Hypotheses and ExperimentState your Hypotheses
Null Hypothesis
Alternative Hypothesis
Determine Appropriate Model
Test statistic
One or Two-tailed
Determine Decision Criteria
α Significance level
β and Power Analysis
16.
Procedures of Hypotheses Testing and the ScientificMethod
Formulate general
Research Question
Design research
hypotheses and
Experiment
Report conclusions in
Non-statistical
languages
Collect and analyze
Experimental data
17.
V. Calculate test statisticVI. Make a Decision regarding Research Hypotheses
(Specify the Decision Method)
Reject Null Hypothesis Ho
Test statistic (t=2.14) > critical value (2.064)
18.
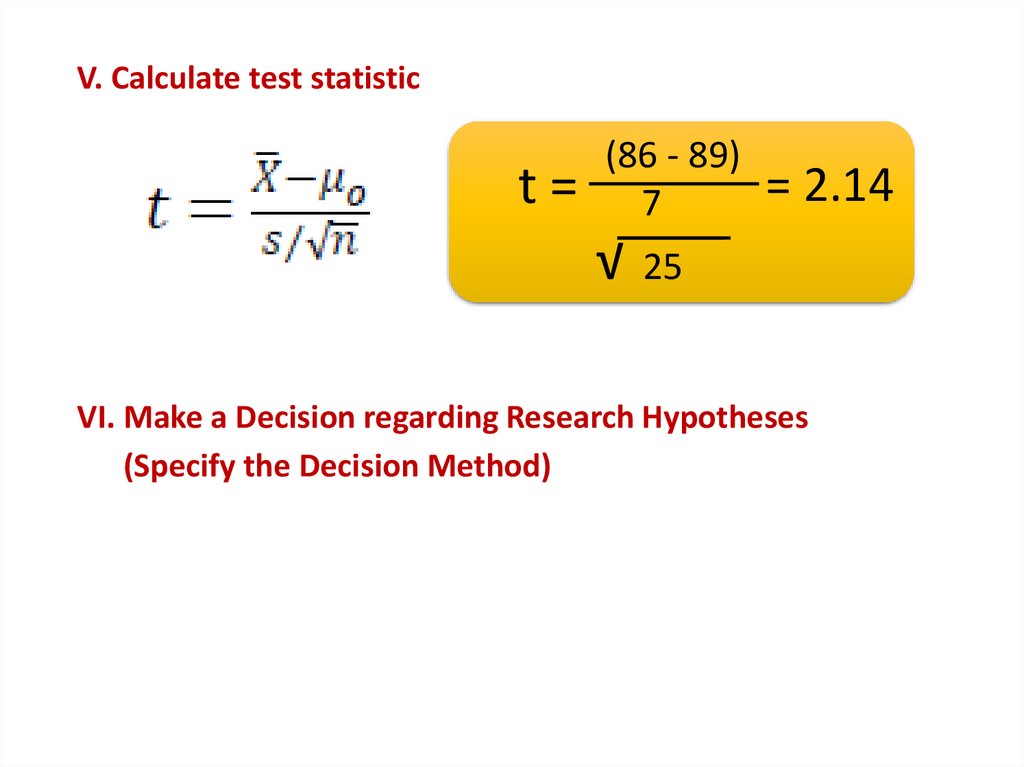
V. Calculate test statistict=
(86 - 89)
7
√
= 2.14
25
VI. Make a Decision regarding Research Hypotheses
(Specify the Decision Method)
Reject Null Hypothesis Ho
Test statistic (t=2.14) > critical value (2.064)
19.
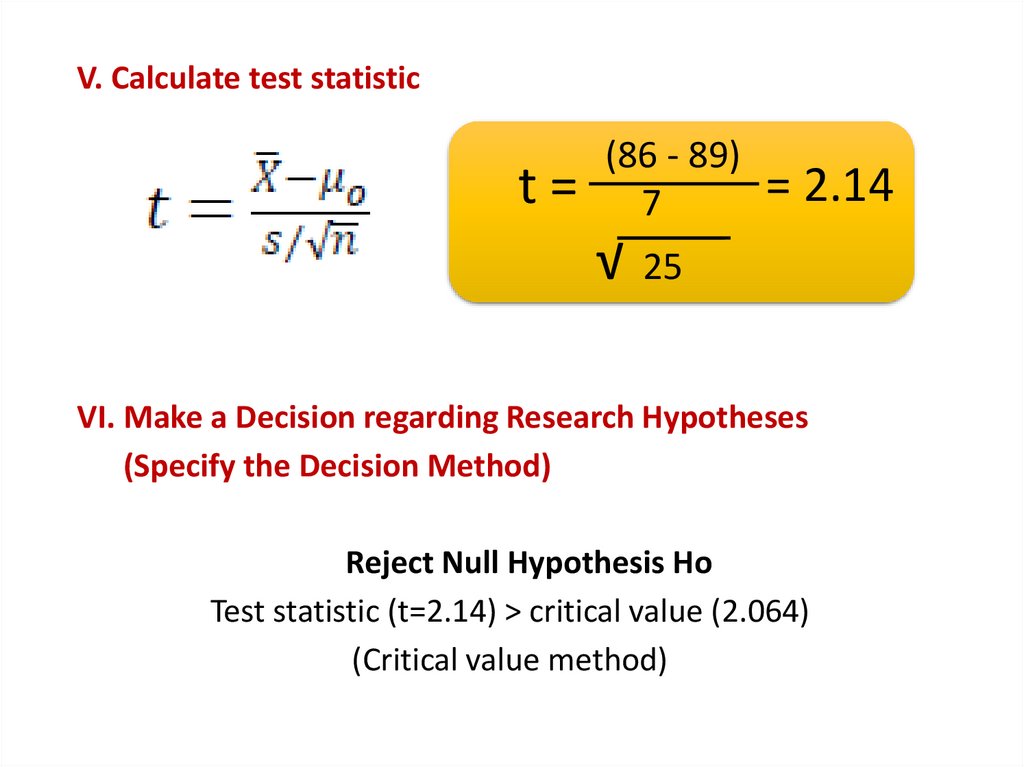
V. Calculate test statistict=
(86 - 89)
7
√
= 2.14
25
VI. Make a Decision regarding Research Hypotheses
(Specify the Decision Method)
Reject Null Hypothesis Ho
Test statistic (t=2.14) > critical value (2.064)
(Critical value method)
20.
Collect and Analyze Experimental DataCollect and verify data
Conduct Experiment
Check for outliers
Determine test statistic and/or p-value
Compare to critical value
Compare to α
Make a decision about H0
Reject H0 & support Ha
Fail to Reject Ho
21.
22.
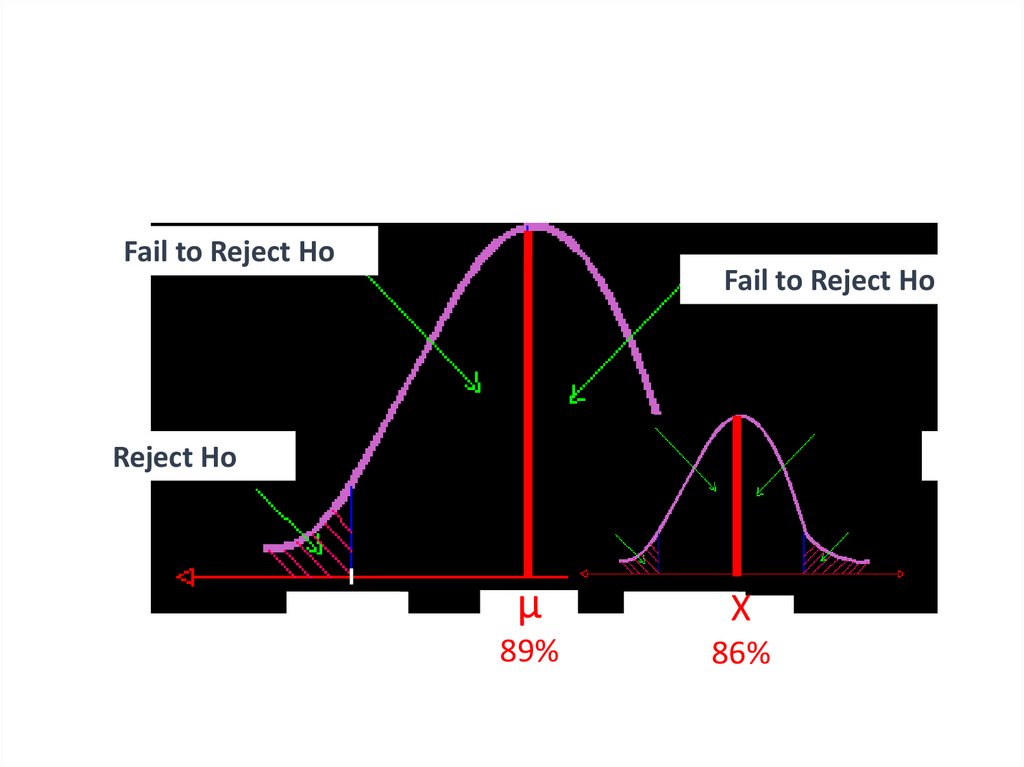
Fail to Reject HoFail to Reject Ho
Reject Ho
Reject Ho
-1.96
µ
89%
+1.96
X
86%
23.
Procedures of Hypotheses Testing and the ScientificMethod
Formulate general
Research Question
Design research
hypotheses and
Experiment
Report conclusions in
Non-statistical
languages
Collect and analyze
Experimental data
24.
VII. Report a conclusionPregnancy has a significant effect on mean Hb%.
The mean Hb% of pregnant females (86%) was significantly
lower than the mean Hb% of adult females in the
community (89%).
25.
VII. Report a conclusionPregnancy has a significant effect on mean Hb%.
The mean Hb% of pregnant females (86%) was significantly
lower than the mean Hb% of adult females in the
community (89%).
26.
Comparing Means(Parametric tests)
One Population
Inference
Two Population
Inference
Analysis of
Variance (ANOVA)
Independent
Sampling Model
Dependent
Sampling Model
27.
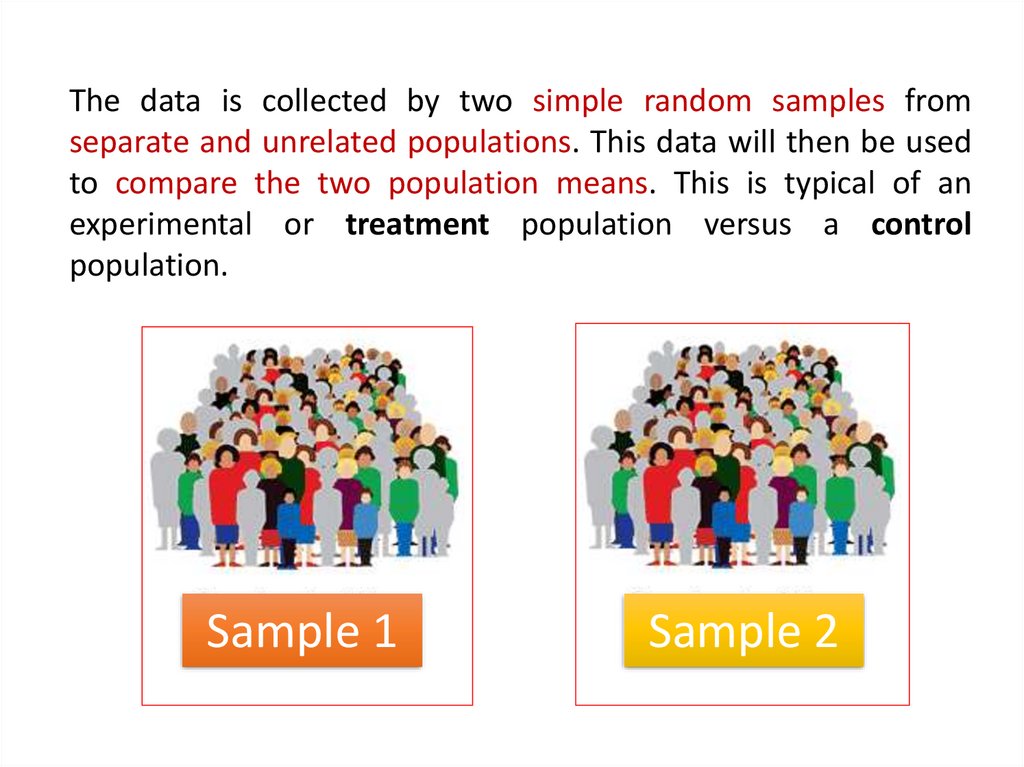
The data is collected by two simple random samples fromseparate and unrelated populations. This data will then be used
to compare the two population means. This is typical of an
experimental or treatment population versus a control
population.
Sample 1
Sample 2
28.
Sample 1n1
X1
S1
Sample 2
n2
X2
S2
29.
Exercise (14)30.
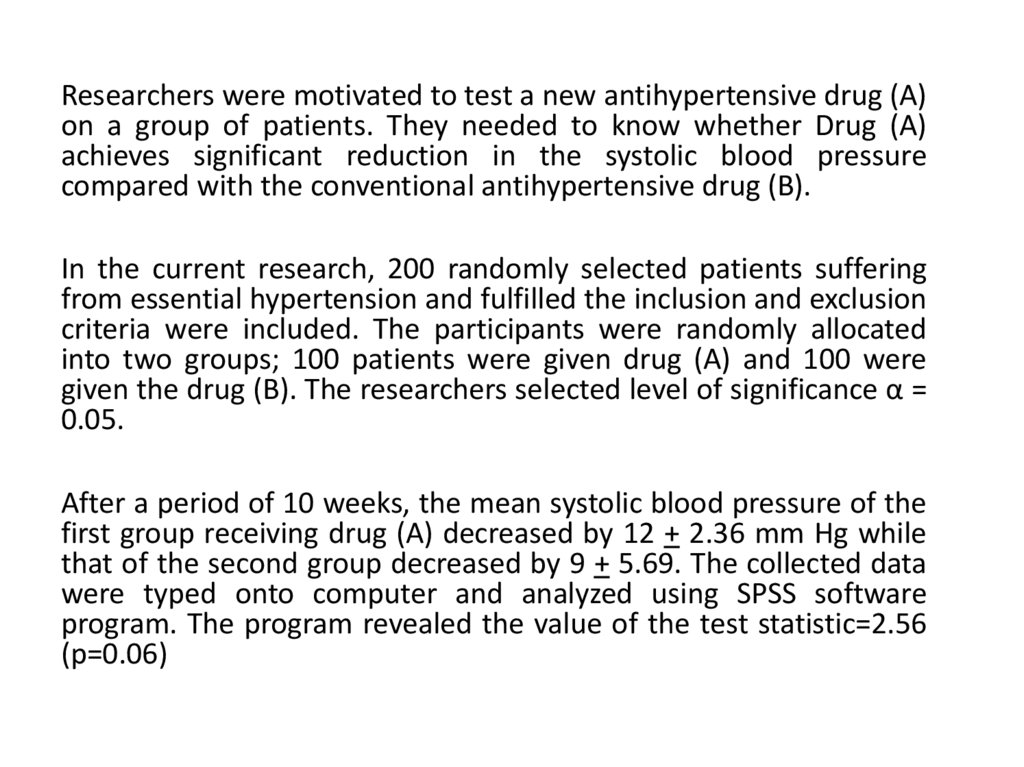
Researchers were motivated to test a new antihypertensive drug (A)on a group of patients. They needed to know whether Drug (A)
achieves significant reduction in the systolic blood pressure
compared with the conventional antihypertensive drug (B).
In the current research, 200 randomly selected patients suffering
from essential hypertension and fulfilled the inclusion and exclusion
criteria were included. The participants were randomly allocated
into two groups; 100 patients were given drug (A) and 100 were
given the drug (B). The researchers selected level of significance α =
0.05.
After a period of 10 weeks, the mean systolic blood pressure of the
first group receiving drug (A) decreased by 12 + 2.36 mm Hg while
that of the second group decreased by 9 + 5.69. The collected data
were typed onto computer and analyzed using SPSS software
program. The program revealed the value of the test statistic=2.56
(p=0.06)
31.
Procedures of Hypotheses Testing and the ScientificMethod
Formulate general
Research Question
Design research
hypotheses and
Experiment
Report conclusions in
Non-statistical
languages
Collect and analyze
Experimental data
32.
I. Formulate general Research QuestionDoes pregnancy have significant effect on mean Hb%?
33.
I. Formulate general Research QuestionIs there any significant difference in the mean reduction of
systolic blood pressure achieved by drug (A) and drug (B)?
34.
Procedures of Hypotheses Testing and the ScientificMethod
Formulate general
Research Question
Design research
hypotheses and
Experiment
Report conclusions in
Non-statistical
languages
Collect and analyze
Experimental data
35.
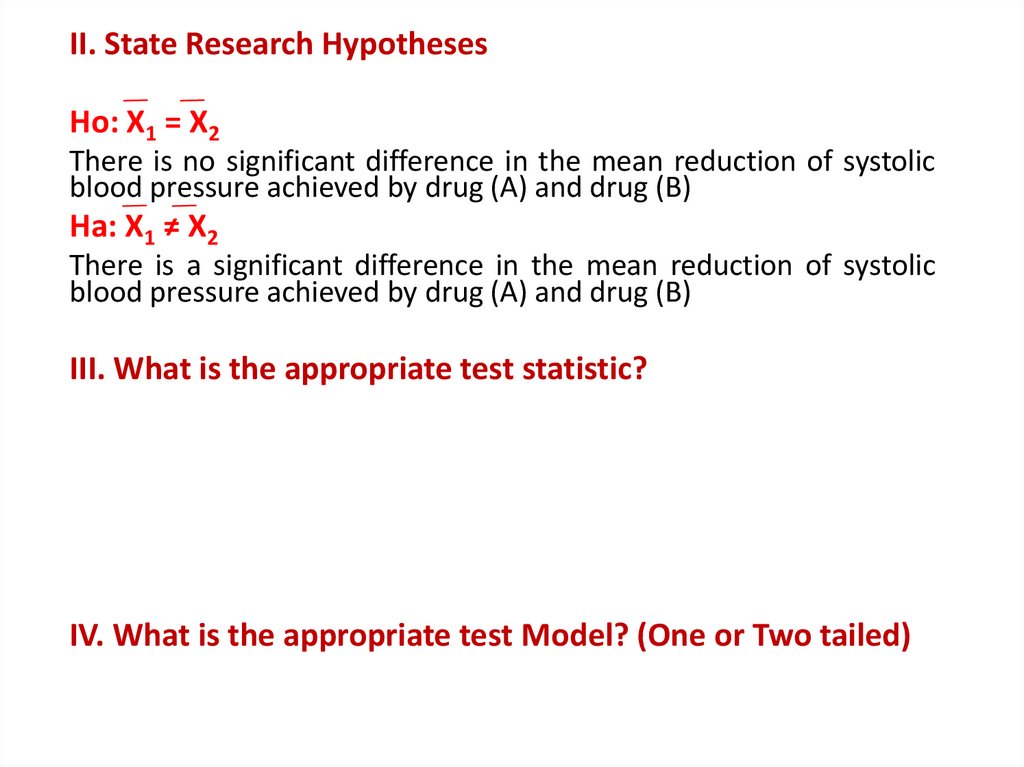
II. State Research HypothesesHo: X1 = X2
There is no significant difference in the mean reduction of systolic
blood pressure achieved by drug (A) and drug (B)
Ha: X1 ≠ X2
There is a significant difference in the mean reduction of systolic
blood pressure achieved by drug (A) and drug (B)
III. What is the appropriate test statistic?
Two Independent sample t test
IV. What is the appropriate test Model? (One or Two tailed)
Two Tailed Test Model
36.
II. State Research HypothesesHo: X1 = X2
There is no significant difference in the mean reduction of systolic
blood pressure achieved by drug (A) and drug (B)
Ha: X1 ≠ X2
There is a significant difference in the mean reduction of systolic
blood pressure achieved by drug (A) and drug (B)
III. What is the appropriate test statistic?
Two Independent sample t test
IV. What is the appropriate test Model? (One or Two tailed)
Two Tailed Test Model
37.
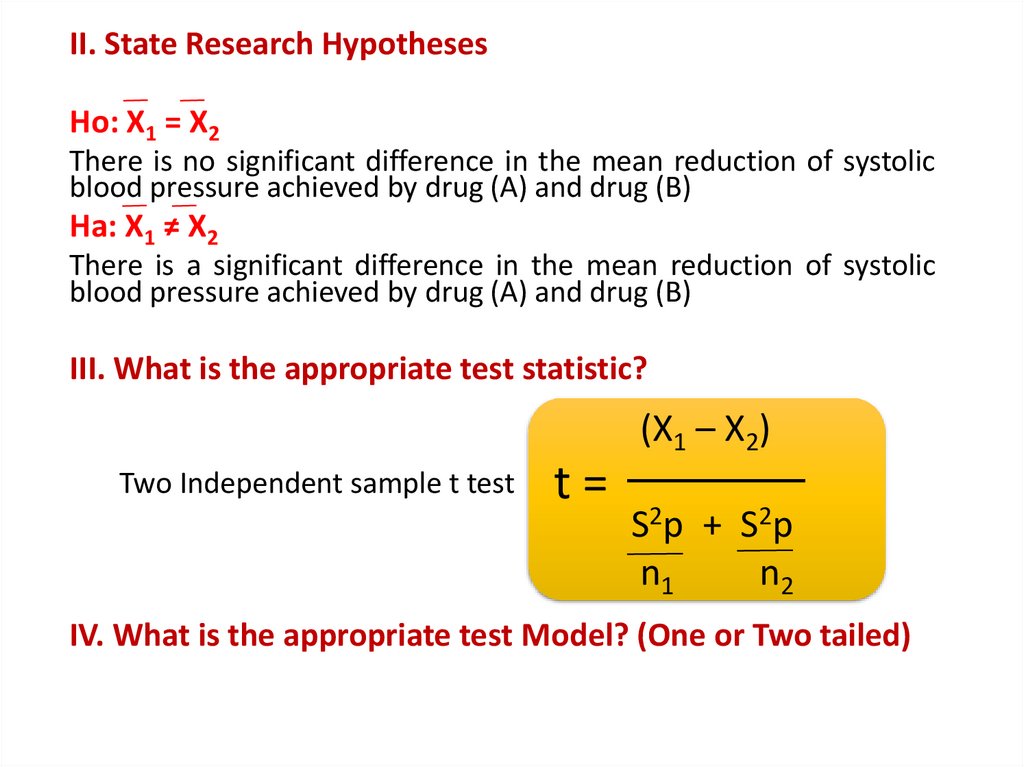
II. State Research HypothesesHo: X1 = X2
There is no significant difference in the mean reduction of systolic
blood pressure achieved by drug (A) and drug (B)
Ha: X1 ≠ X2
There is a significant difference in the mean reduction of systolic
blood pressure achieved by drug (A) and drug (B)
III. What is the appropriate test statistic?
(X1 – X2)
Two Independent sample t test
t=
S2p + S2p
n1
n2
IV. What is the appropriate test Model? (One or Two tailed)
Two Tailed Test Model
38.
II. State Research HypothesesHo: X1 = X2
There is no significant difference in the mean reduction of systolic
blood pressure achieved by drug (A) and drug (B)
Ha: X1 ≠ X2
There is a significant difference in the mean reduction of systolic
blood pressure achieved by drug (A) and drug (B)
III. What is the appropriate test statistic?
(X1 – X2)
Two Independent sample t test
t=
S2p + S2p
n1
n2
IV. What is the appropriate test Model? (One or Two tailed)
Two Tailed Test Model
39.
Design Research Hypotheses and ExperimentState your Hypotheses
Null Hypothesis
Alternative Hypothesis
Determine Appropriate Model
Test statistic
One or Two-tailed
Determine Decision Criteria
α Significance level
β and Power Analysis
40.
Procedures of Hypotheses Testing and the ScientificMethod
Formulate general
Research Question
Design research
hypotheses and
Experiment
Report conclusions in
Non-statistical
languages
Collect and analyze
Experimental data
41.
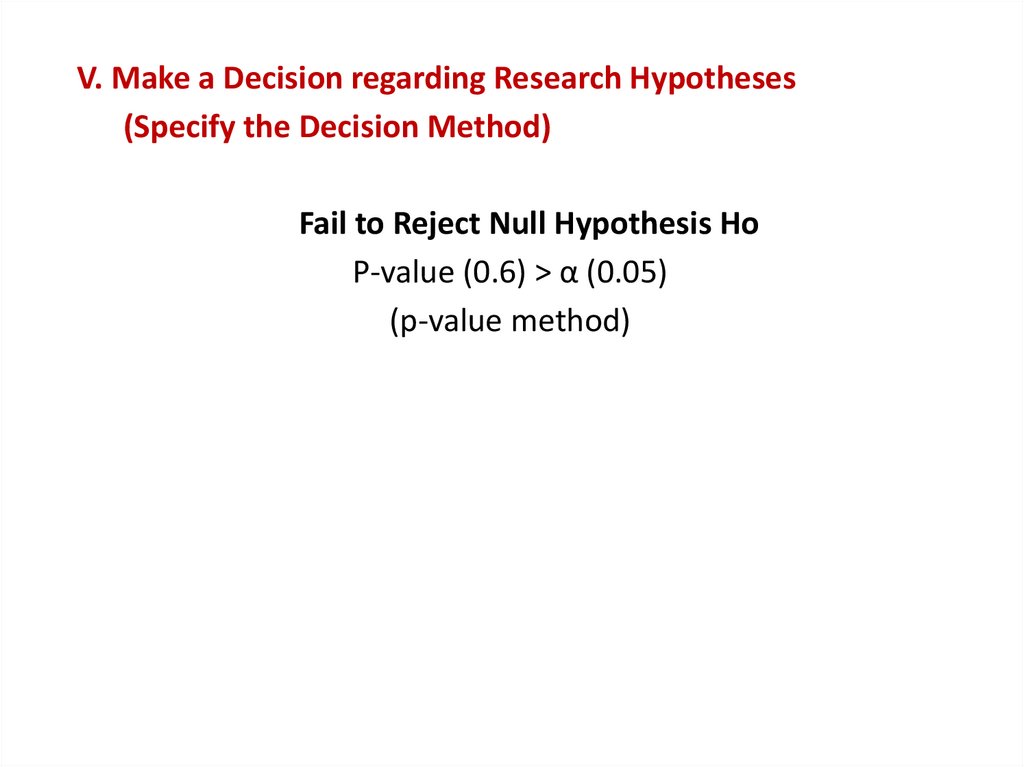
V. Make a Decision regarding Research Hypotheses(Specify the Decision Method)
Fail to Reject Null Hypothesis Ho
P-value (0.6) > α (0.05)
(p-value method)
42.
Collect and Analyze Experimental DataCollect and verify data
Conduct Experiment
Check for outliers
Determine test statistic and/or p-value
Compare to critical value
Compare to α
Make a decision about H0
Reject H0 & support Ha
Fail to Reject Ho
43.
Procedures of Hypotheses Testing and the ScientificMethod
Formulate general
Research Question
Design research
hypotheses and
Experiment
Report conclusions in
Non-statistical
languages
Collect and analyze
Experimental data
44.
VI. Report a conclusionPregnancy has a significant effect on mean Hb%.
The mean Hb% of pregnant females (86%) was significantly
lower than the mean Hb% of adult females in the
community (89%).
45.
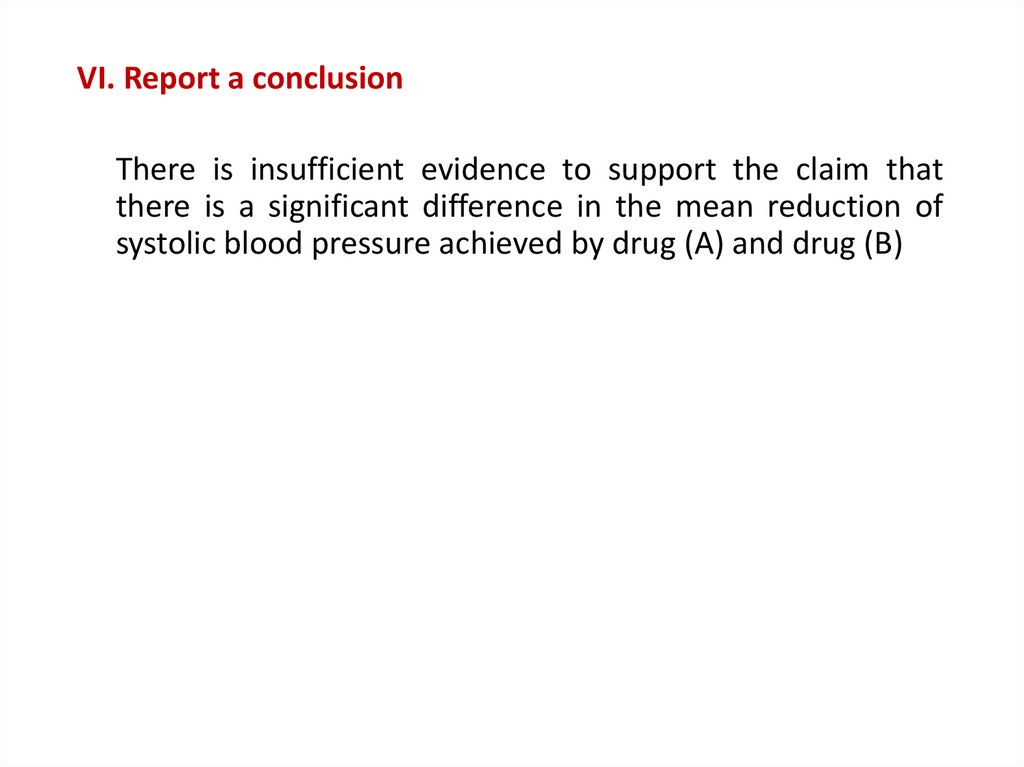
VI. Report a conclusionThere is insufficient evidence to support the claim that
there is a significant difference in the mean reduction of
systolic blood pressure achieved by drug (A) and drug (B)
46.
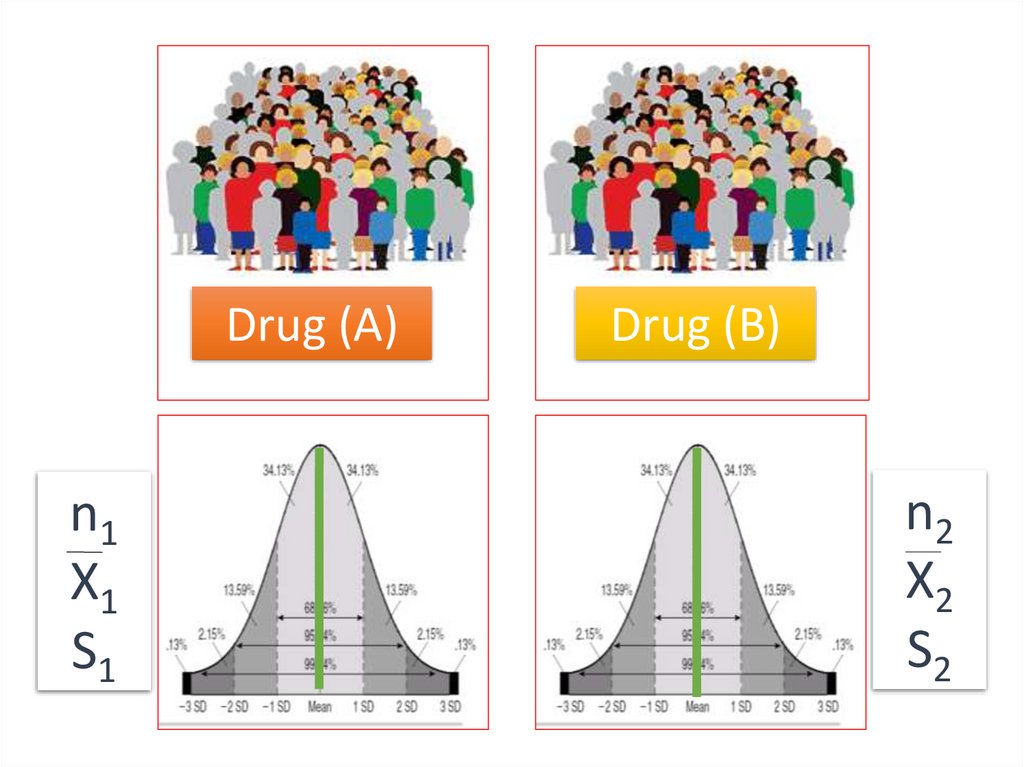
Drug (A)n1
X1
S1
Drug (B)
n2
X2
S2
47.
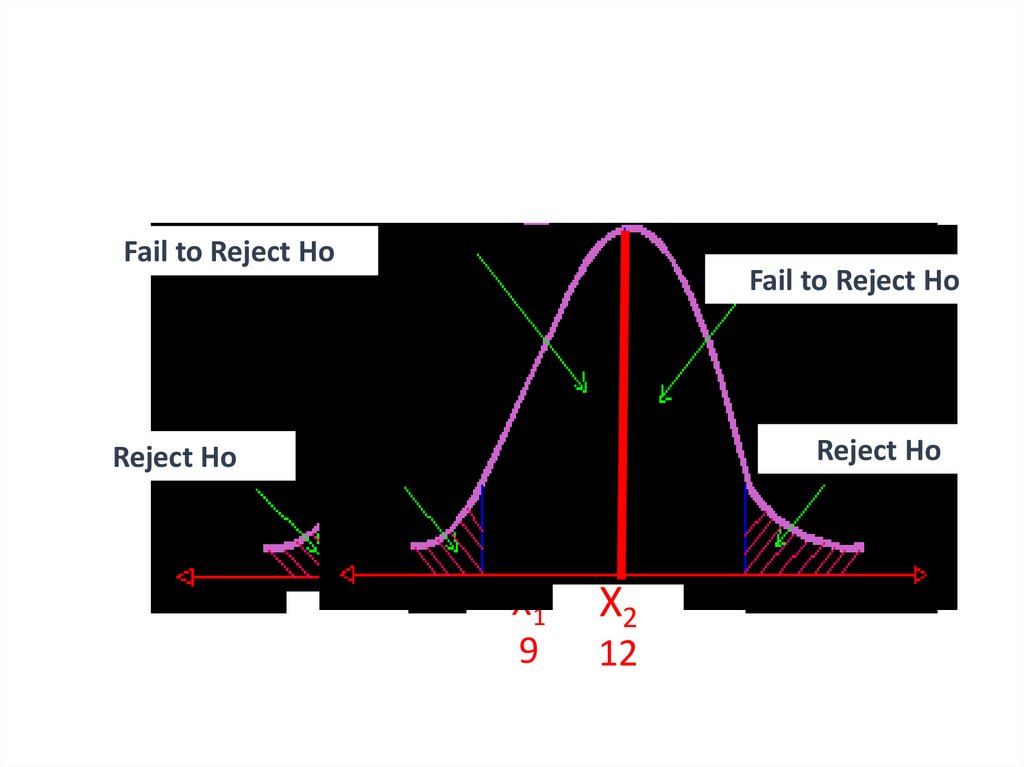
Fail to Reject HoFail to Reject Ho
Reject Ho
Reject Ho
-1.96
X1
9
X2 +1.96
12
48.
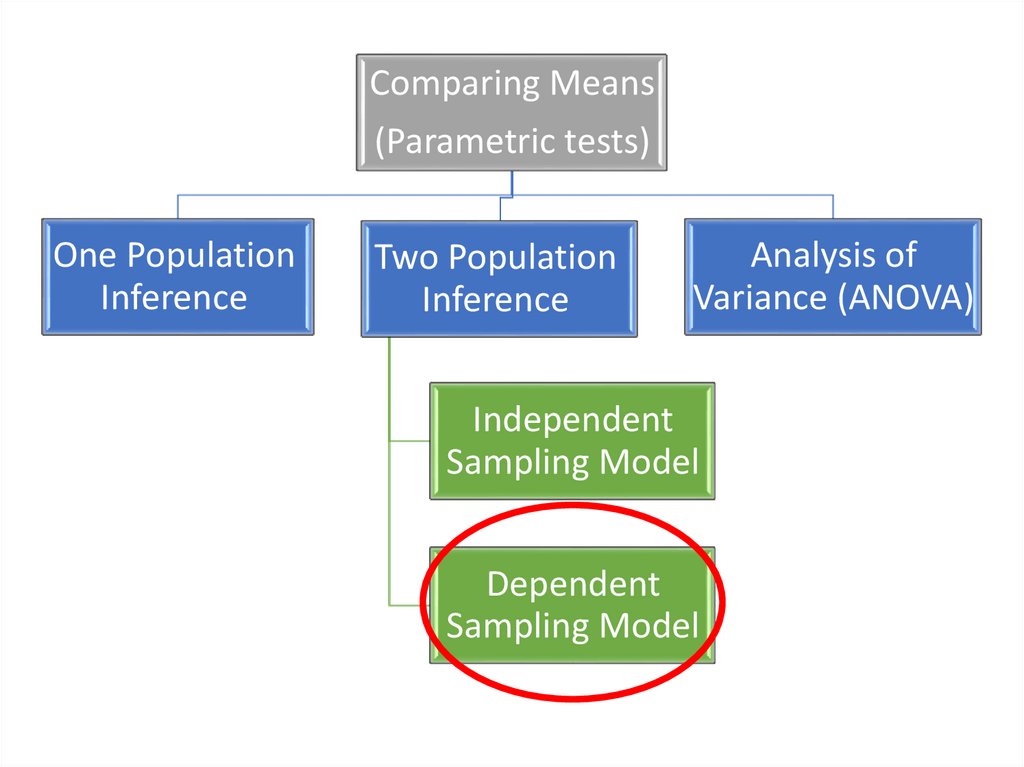
Comparing Means(Parametric tests)
One Population
Inference
Two Population
Inference
Analysis of
Variance (ANOVA)
Independent
Sampling Model
Dependent
Sampling Model
49.
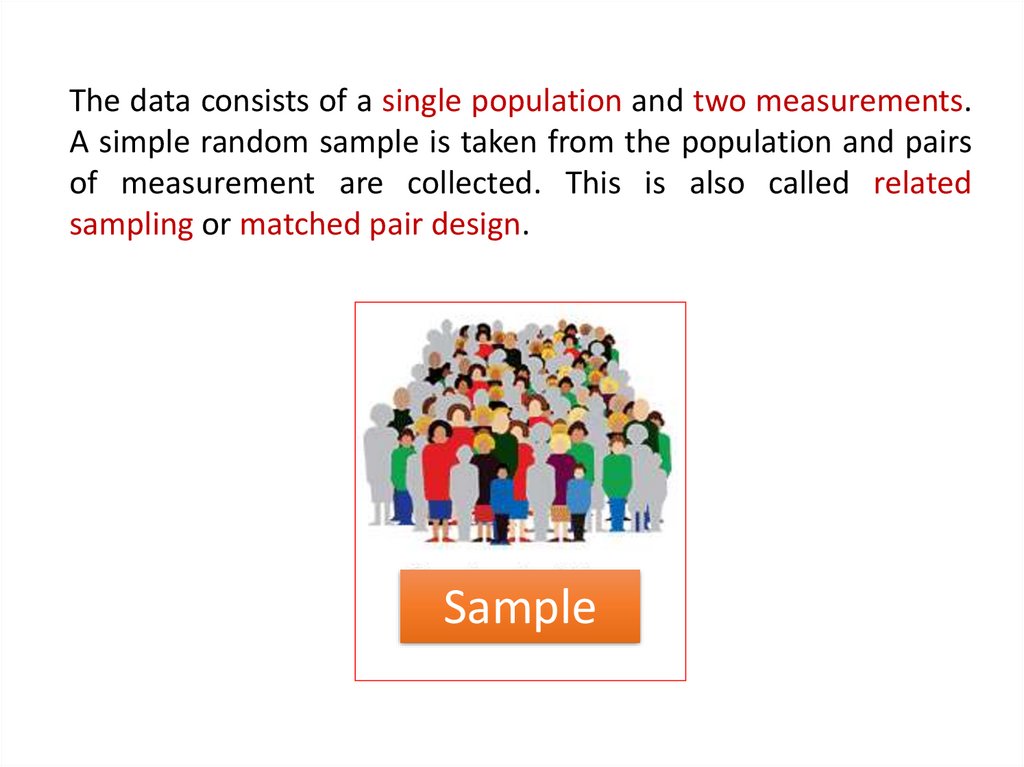
The data consists of a single population and two measurements.A simple random sample is taken from the population and pairs
of measurement are collected. This is also called related
sampling or matched pair design.
Sample
50.
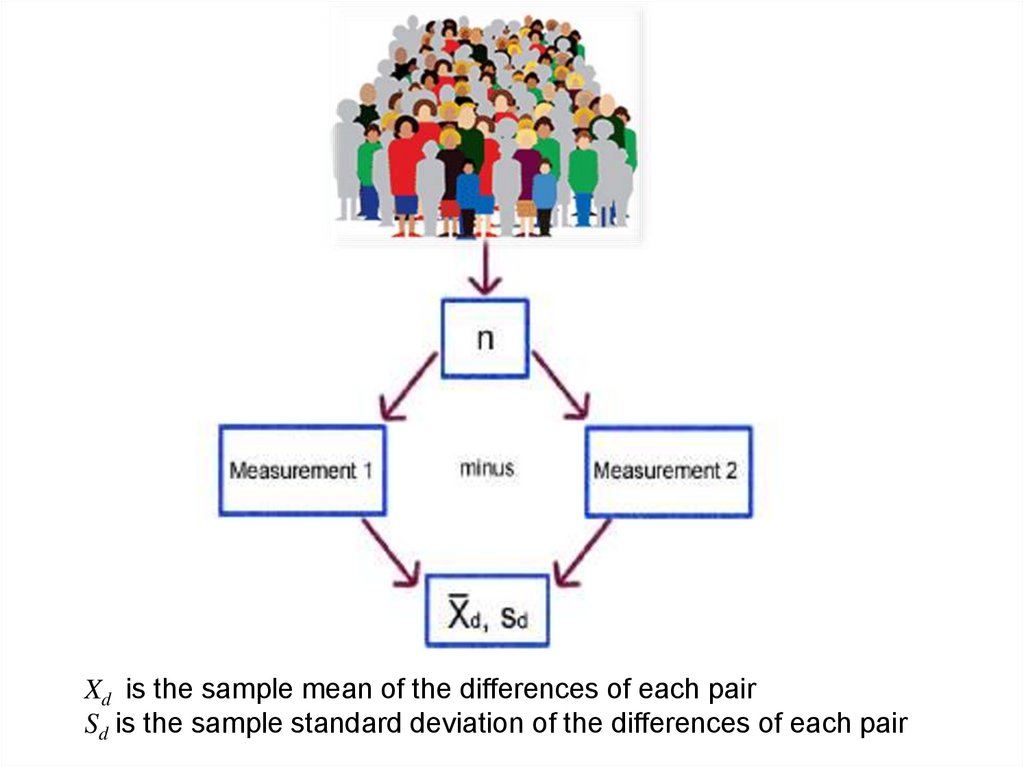
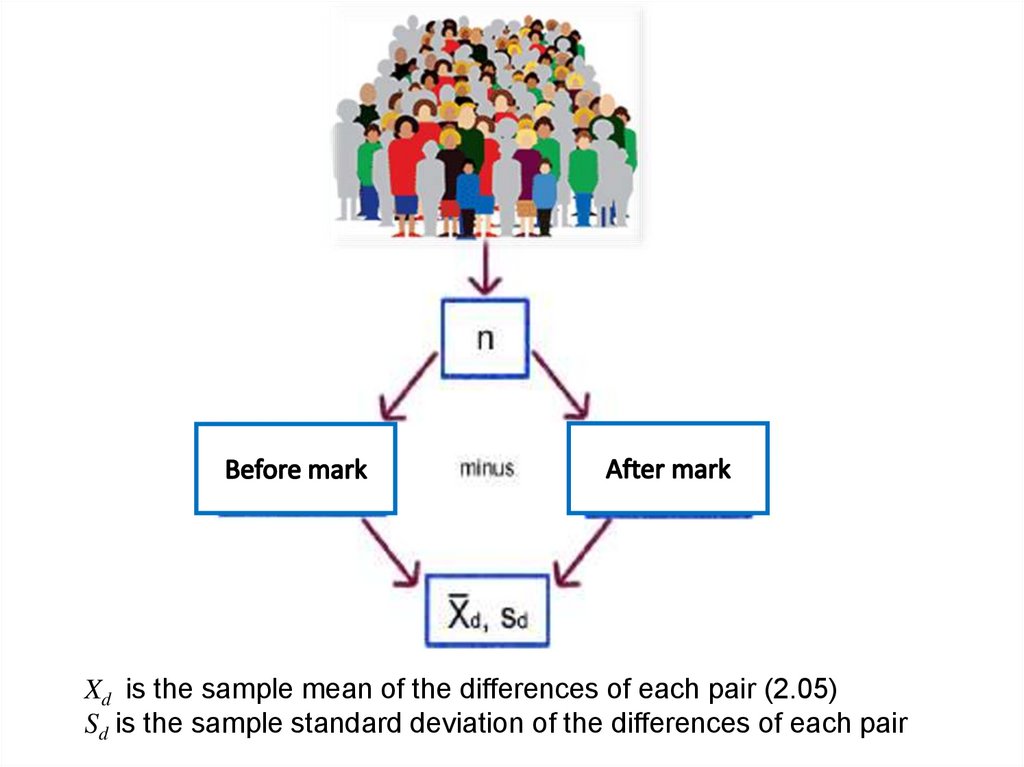
Xd is the sample mean of the differences of each pairSd is the sample standard deviation of the differences of each pair
51.
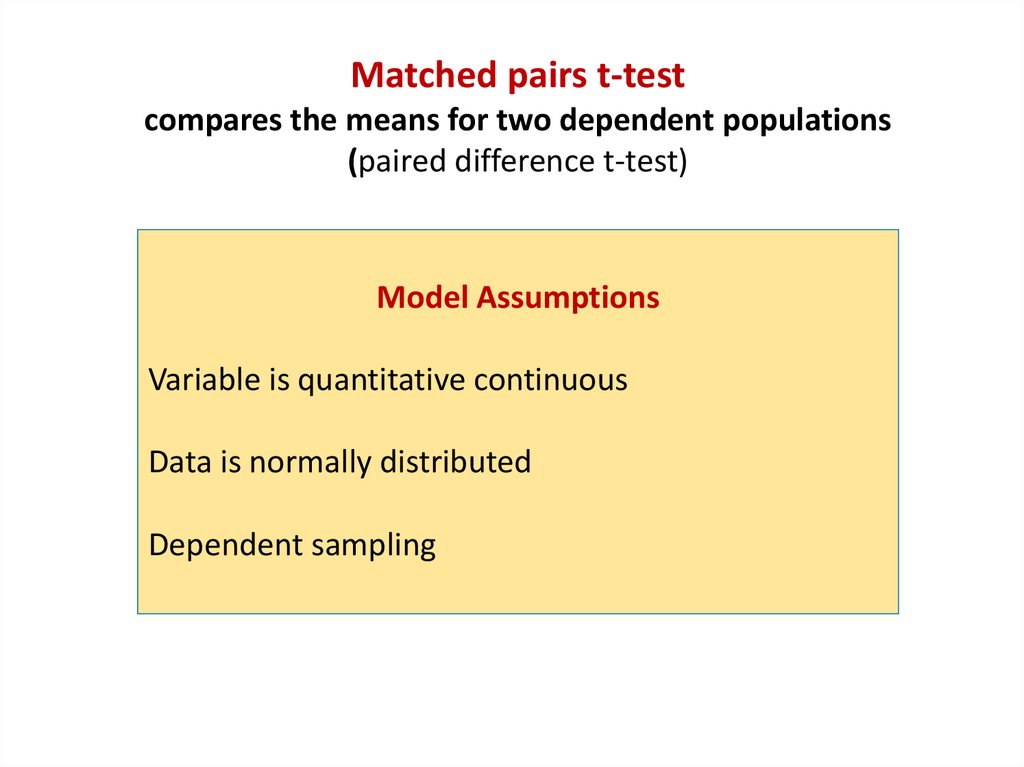
Matched pairs t-testcompares the means for two dependent populations
(paired difference t-test)
Model Assumptions
Variable is quantitative continuous
Data is normally distributed
Dependent sampling
52.
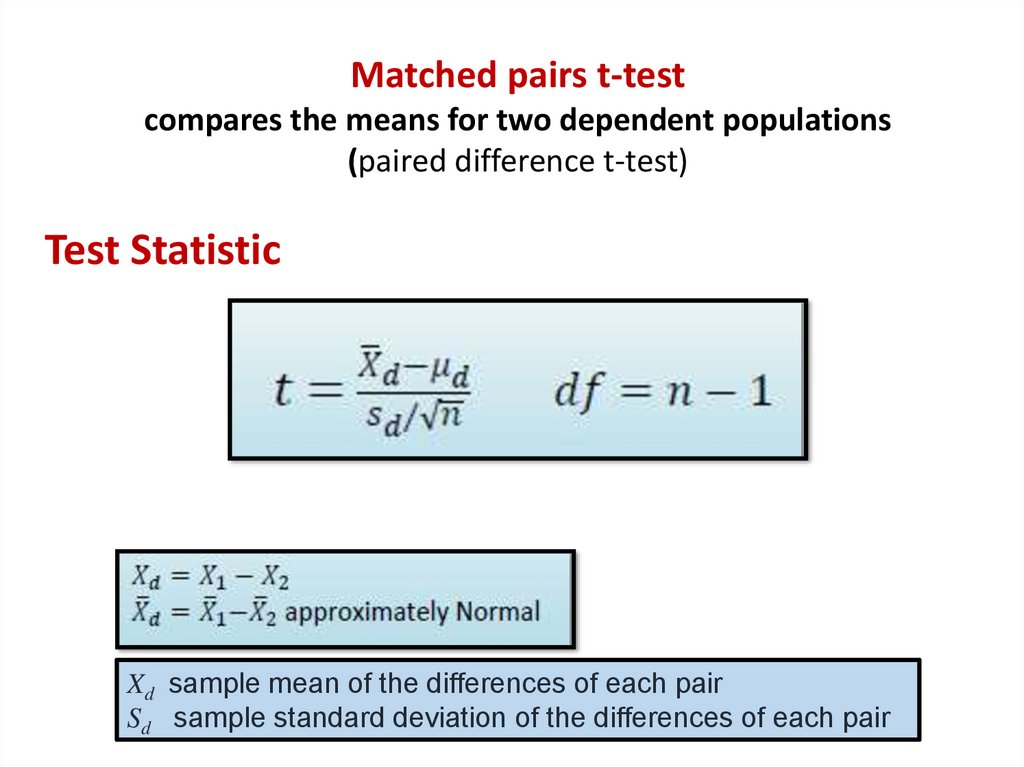
Matched pairs t-testcompares the means for two dependent populations
(paired difference t-test)
Test Statistic
Xd sample mean of the differences of each pair
Sd sample standard deviation of the differences of each pair
53.
Exercise (15)54.
Exercise (15):An instructor of Anatomy course wants to know if student marks
are different on the second midterm compared to the first exam
after implementation of a new teaching intervention; TBL (teambased learning). The first and second midterm marks for 35
students were taken and the mean difference in marks is
determined.
Data were typed and analyzed using SPSS software program. The
level of significance was 0.05. The appropriate statistical test was
conducted and revealed test statistic = 3.23 (p=0.004). The
following is SPSS output tables
55.
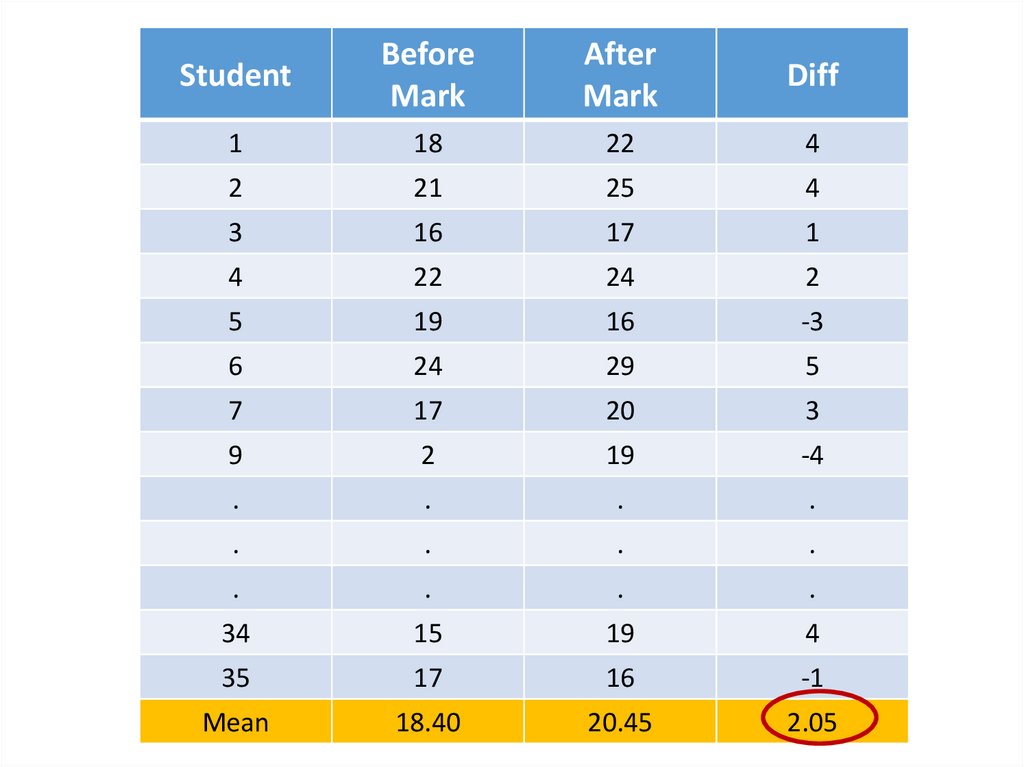
Xd is the sample mean of the differences of each pair (2.05)Sd is the sample standard deviation of the differences of each pair
56.
StudentBefore
Mark
After
Mark
Diff
1
18
22
4
2
21
25
4
3
16
17
1
4
22
24
2
5
19
16
-3
6
24
29
5
7
17
20
3
9
2
19
-4
.
.
.
.
.
.
.
.
.
.
.
.
34
15
19
4
35
17
16
-1
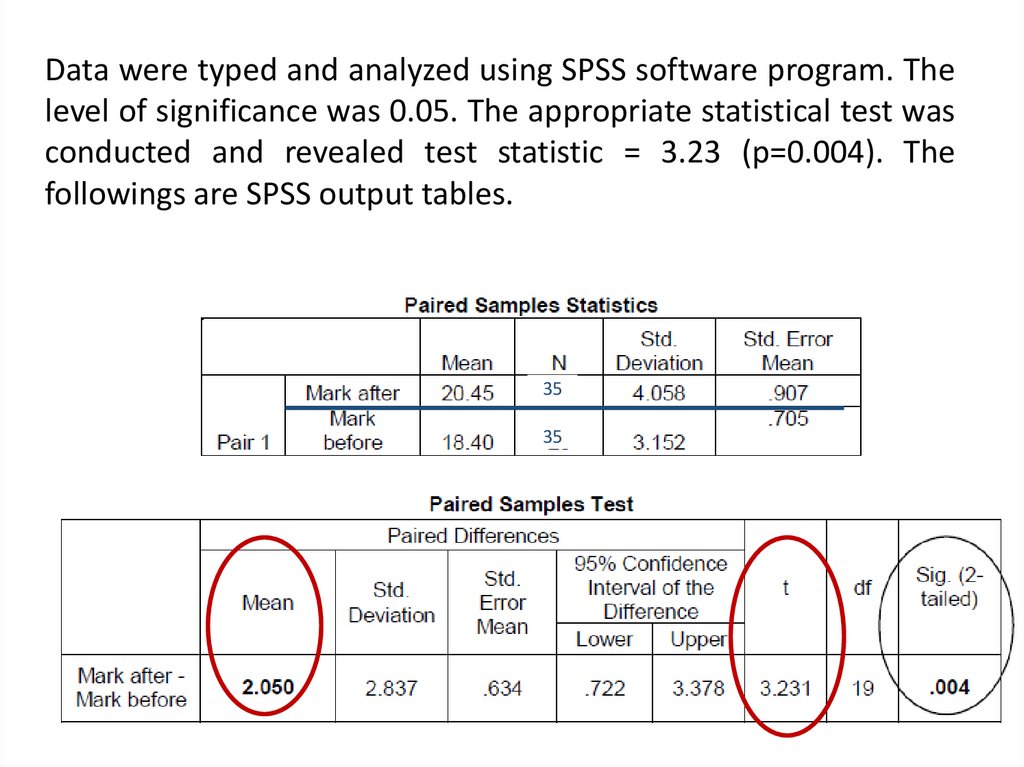
Mean
18.40
20.45
2.05
57.
Data were typed and analyzed using SPSS software program. Thelevel of significance was 0.05. The appropriate statistical test was
conducted and revealed test statistic = 3.23 (p=0.004). The
followings are SPSS output tables.
35
35
58.
Procedures of Hypotheses Testing and the ScientificMethod
Formulate general
Research Question
Design research
hypotheses and
Experiment
Report conclusions in
Non-statistical
languages
Collect and analyze
Experimental data
59.
I. Formulate general Research QuestionDoes pregnancy have significant effect on mean Hb%?
60.
I. Formulate general Research QuestionIs there a difference in students’ marks
implementation of TBL (Team-based Learning)?
following
61.
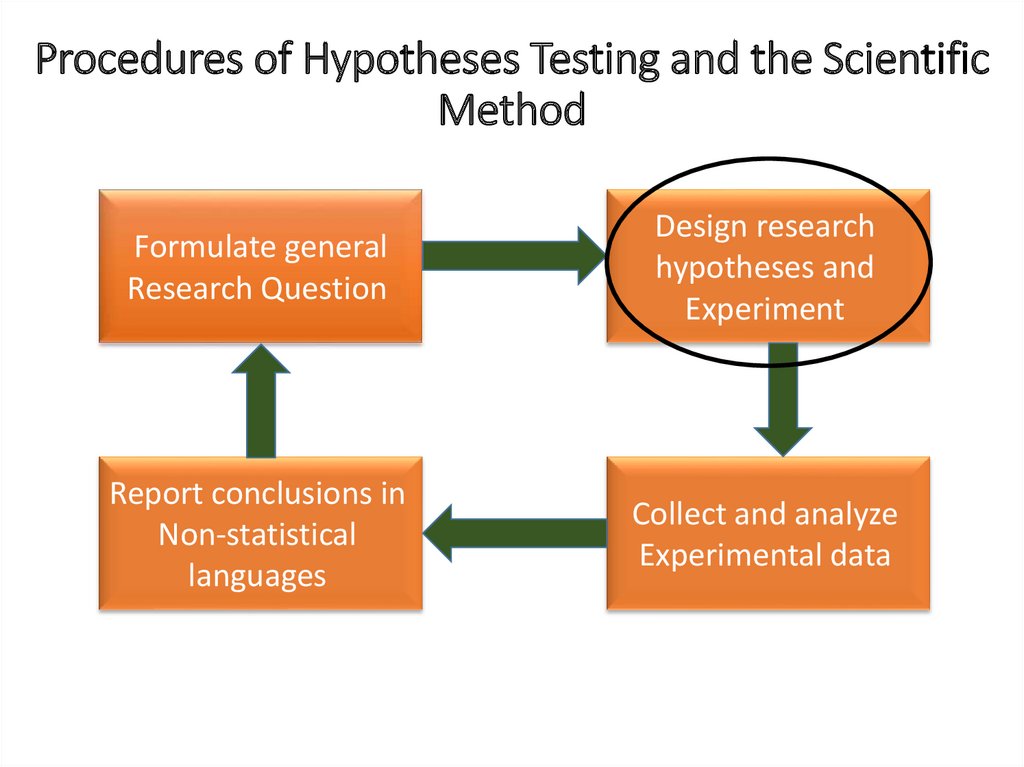
Procedures of Hypotheses Testing and the ScientificMethod
Formulate general
Research Question
Design research
hypotheses and
Experiment
Report conclusions in
Non-statistical
languages
Collect and analyze
Experimental data
62.
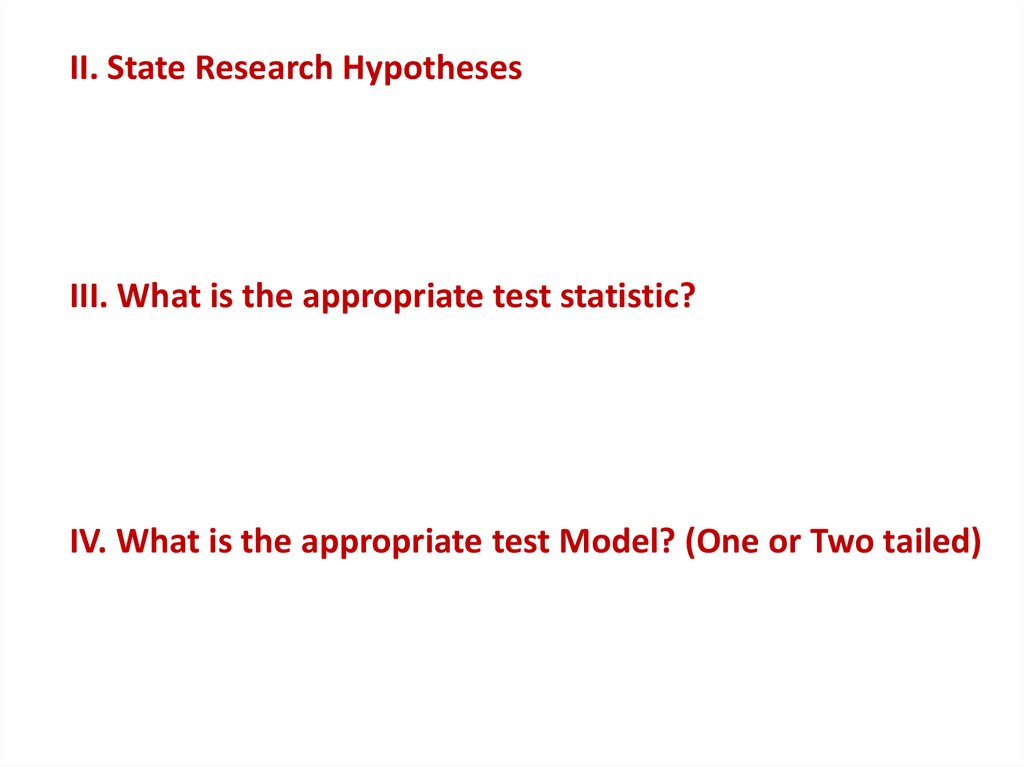
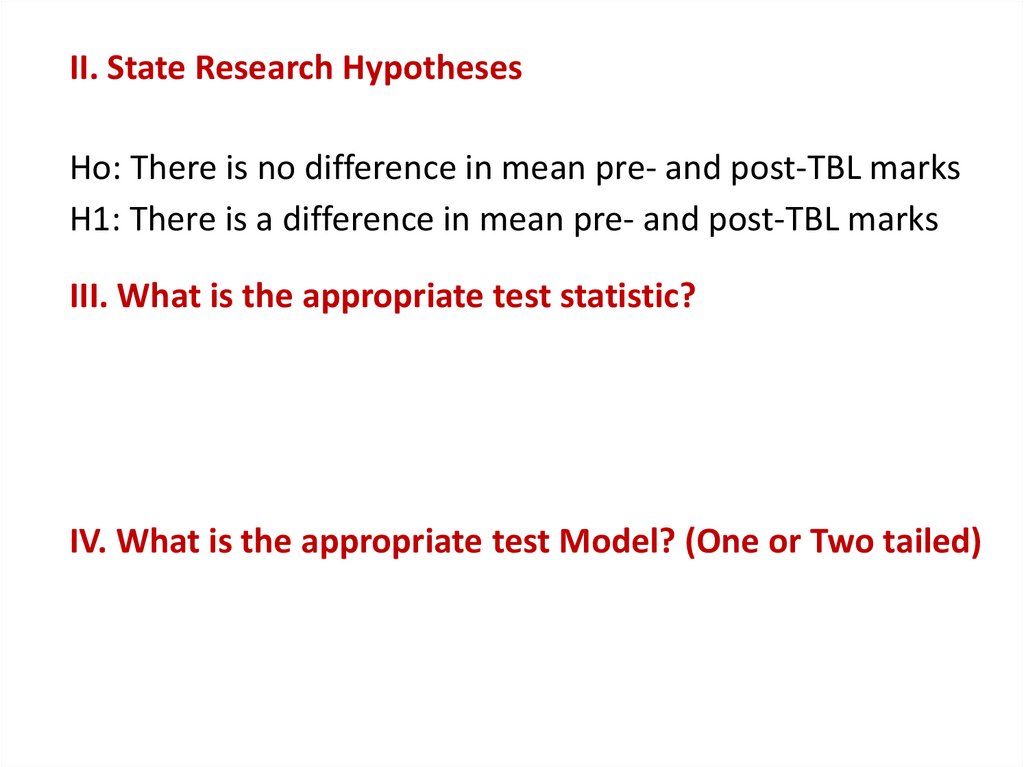
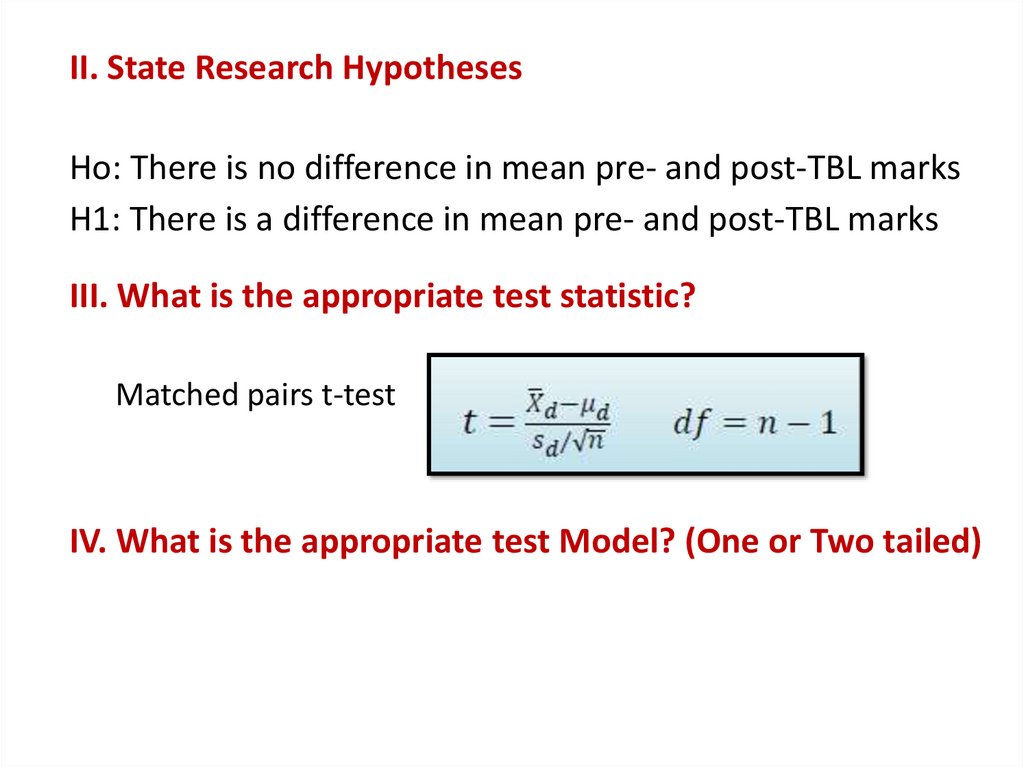
II. State Research HypothesesHo: There is no difference in mean pre- and post-TBL marks
H1: There is a difference in mean pre- and post-TBL marks
III. What is the appropriate test statistic?
Matched pairs t-test
IV. What is the appropriate test Model? (One or Two tailed)
Two Tailed Test Model
63.
II. State Research HypothesesHo: There is no difference in mean pre- and post-TBL marks
H1: There is a difference in mean pre- and post-TBL marks
III. What is the appropriate test statistic?
Matched pairs t-test
IV. What is the appropriate test Model? (One or Two tailed)
Two Tailed Test Model
64.
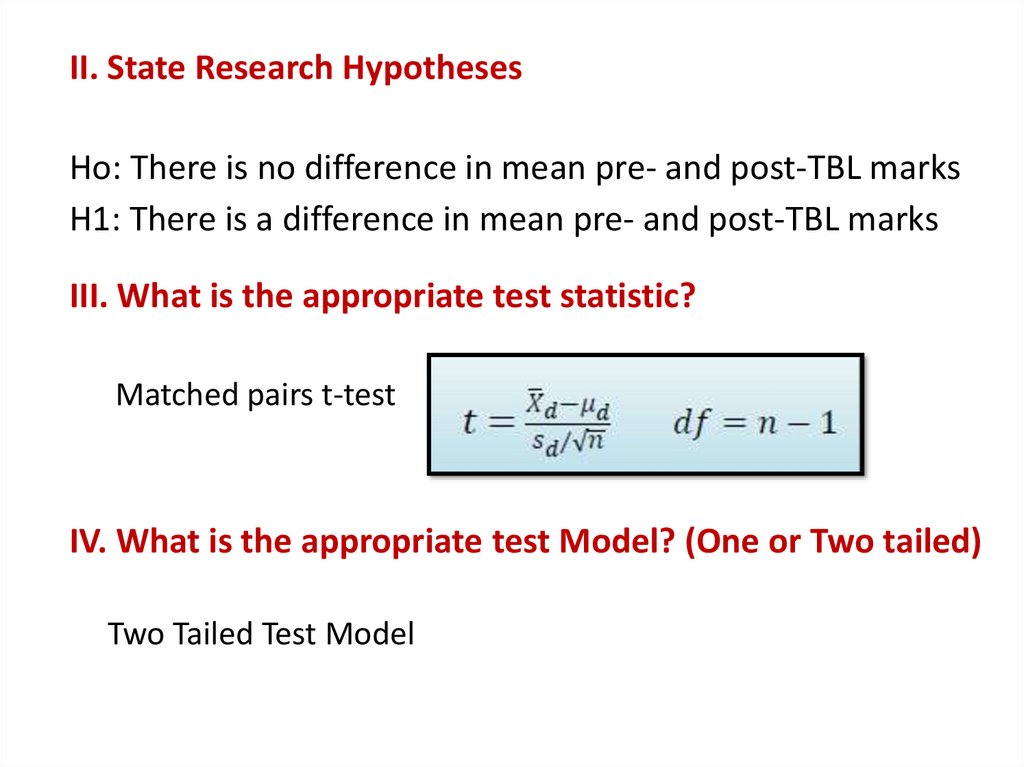
II. State Research HypothesesHo: There is no difference in mean pre- and post-TBL marks
H1: There is a difference in mean pre- and post-TBL marks
III. What is the appropriate test statistic?
Matched pairs t-test
IV. What is the appropriate test Model? (One or Two tailed)
Two Tailed Test Model
65.
II. State Research HypothesesHo: There is no difference in mean pre- and post-TBL marks
H1: There is a difference in mean pre- and post-TBL marks
III. What is the appropriate test statistic?
Matched pairs t-test
IV. What is the appropriate test Model? (One or Two tailed)
Two Tailed Test Model
66.
Design Research Hypotheses and ExperimentState your Hypotheses
Null Hypothesis
Alternative Hypothesis
Determine Appropriate Model
Test statistic
One or Two-tailed
Determine Decision Criteria
α Significance level
β and Power Analysis
67.
Procedures of Hypotheses Testing and the ScientificMethod
Formulate general
Research Question
Design research
hypotheses and
Experiment
Report conclusions in
Non-statistical
languages
Collect and analyze
Experimental data
68.
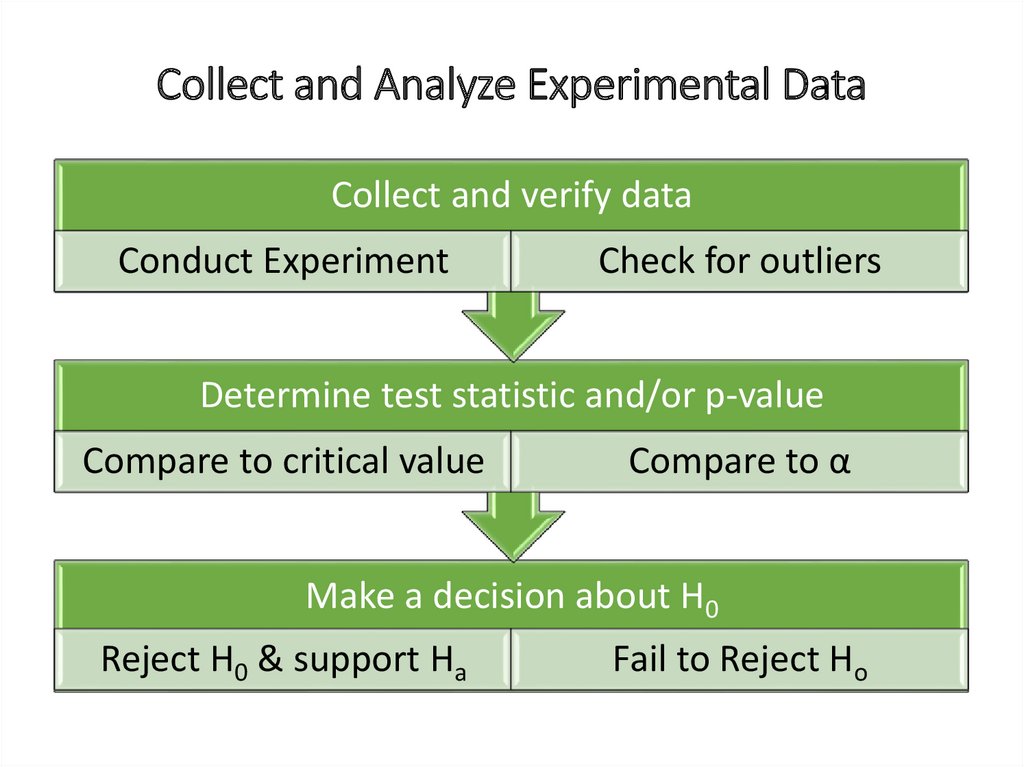
Collect and Analyze Experimental DataCollect and verify data
Conduct Experiment
Check for outliers
Determine test statistic and/or p-value
Compare to critical value
Compare to α
Make a decision about H0
Reject H0 & support Ha
Fail to Reject Ho
69.
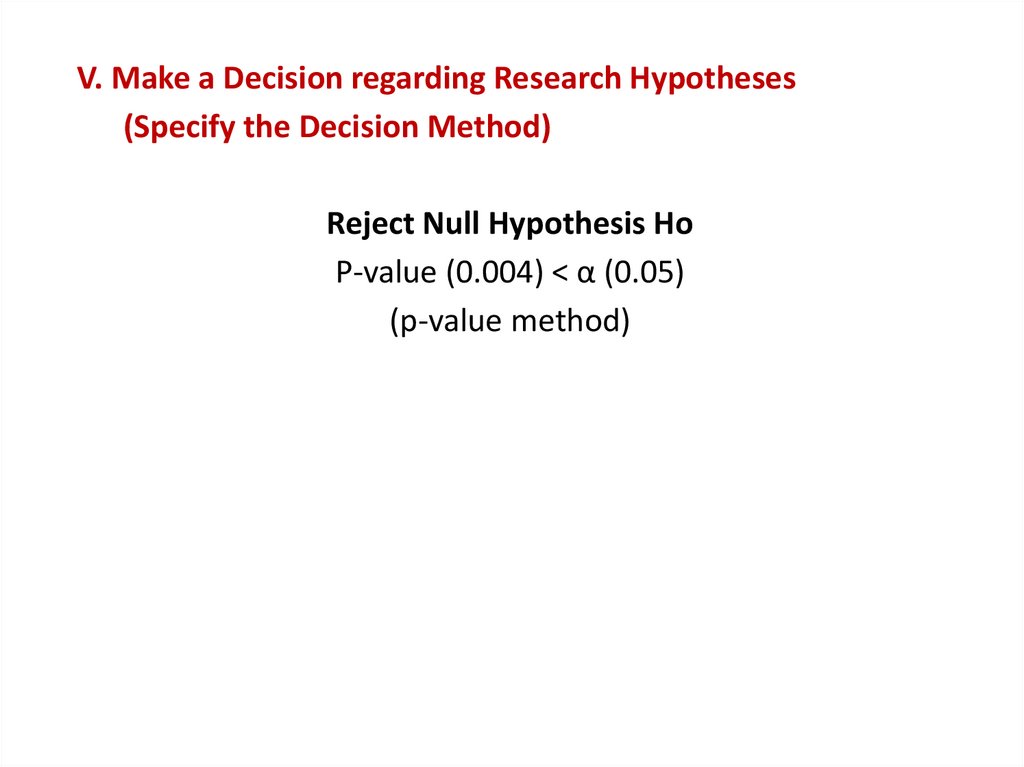
V. Make a Decision regarding Research Hypotheses(Specify the Decision Method)
Reject Null Hypothesis Ho
P-value (0.004) < α (0.05)
(p-value method)
70.
Data were typed and analyzed using SPSS software program. Thelevel of significance was 0.05. The appropriate statistical test was
conducted and revealed test statistic = 3.23 (p=0.004). The
followings are SPSS output tables.
35
35
71.
V. Make a Decision regarding Research Hypotheses(Specify the Decision Method)
Reject Null Hypothesis Ho
P-value (0.004) < α (0.05)
(p-value method)
72.
Procedures of Hypotheses Testing and the ScientificMethod
Formulate general
Research Question
Design research
hypotheses and
Experiment
Report conclusions in
Non-statistical
languages
Collect and analyze
Experimental data
73.
VI. Report a conclusionPregnancy has a significant effect on mean Hb%.
The mean Hb% of pregnant females (86%) was significantly
lower than the mean Hb% of adult females in the
community (89%).
74.
VI. Report a conclusionThere is a strong evidence (t = 3.23, p = 0.004) that TBL as a
teaching intervention improves students’ marks. In this
data set, it improved marks, on average, by approximately
2 points (mean paired difference =2.05).
75.
Xd is the sample mean of the differences of each pair (2.05)Sd is the sample standard deviation of the differences of each pair
76.
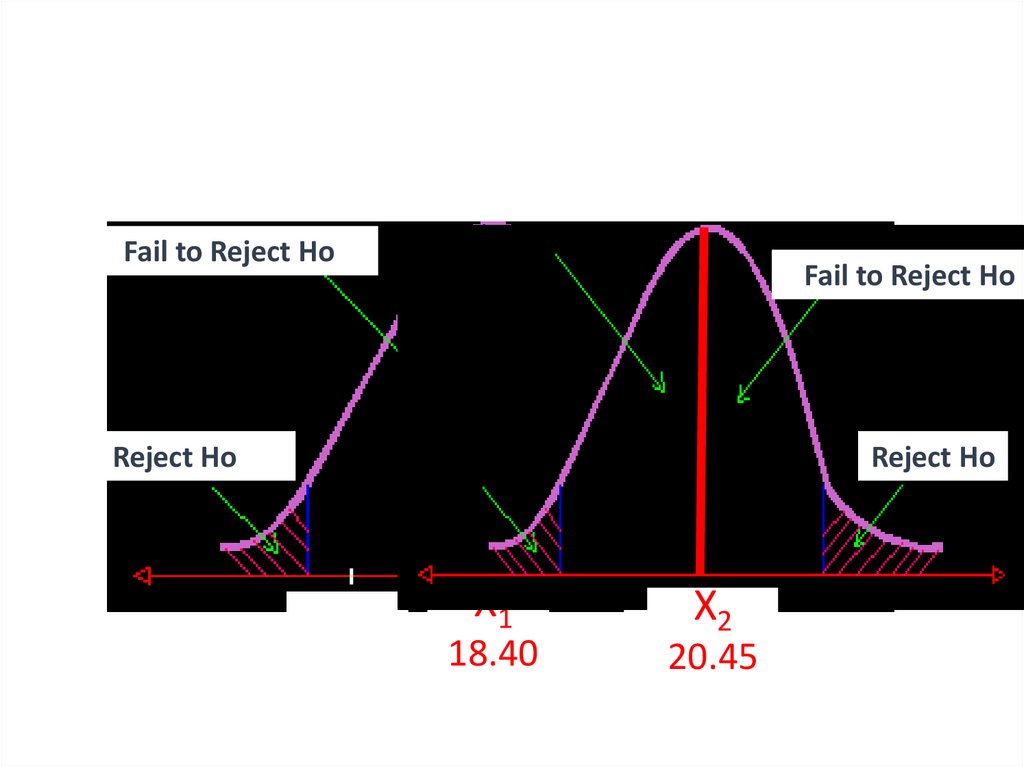
Fail to Reject HoFail to Reject Ho
Reject Ho
Reject Ho
-1.96
X1
18.40
X2
+1.96
20.45
77.
Comparing Means(Parametric tests)
One Population
Inference
Two Population
Inference
Analysis of
Variance (ANOVA)
Independent
Sampling Model
Dependent
Sampling Model
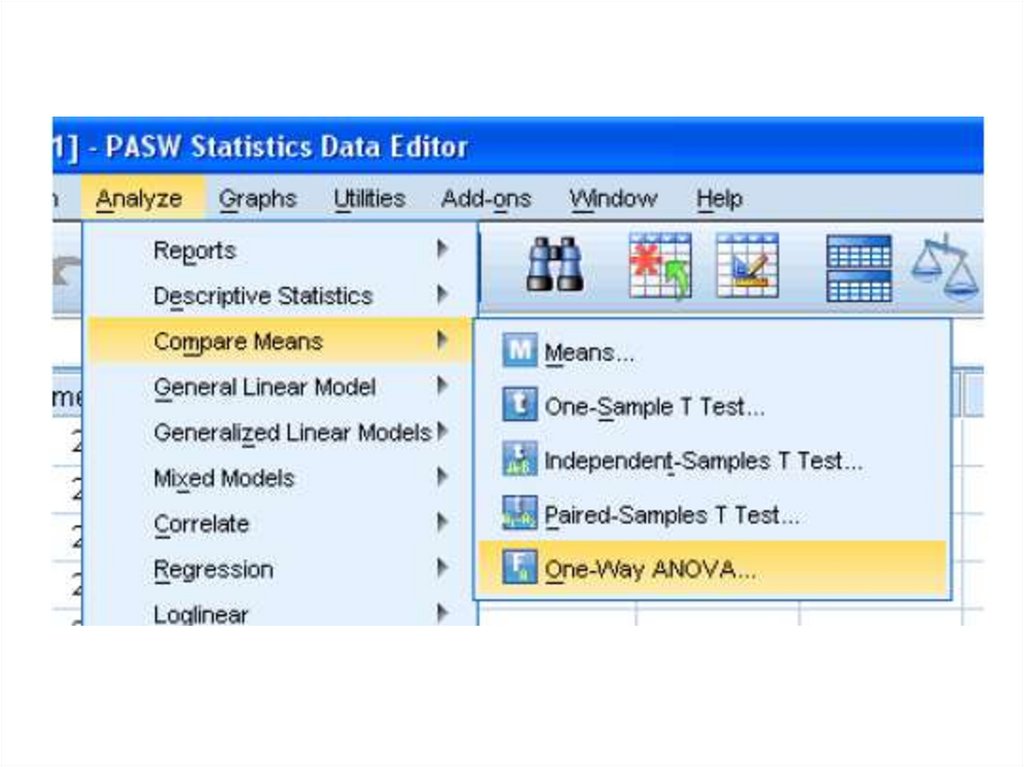
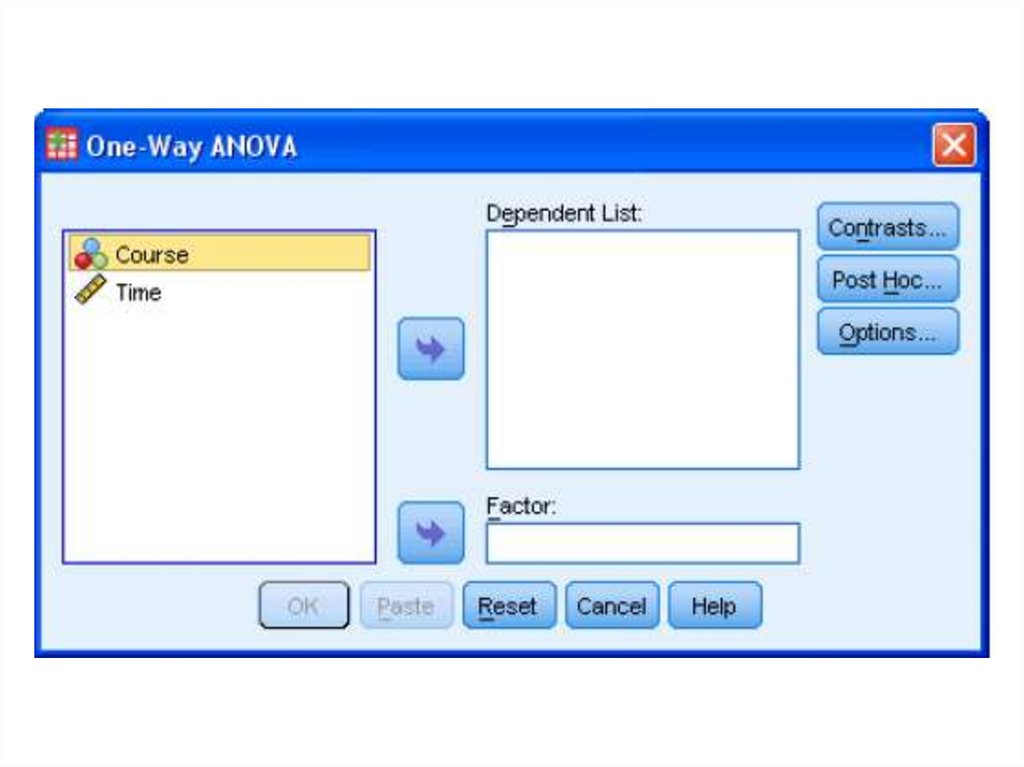
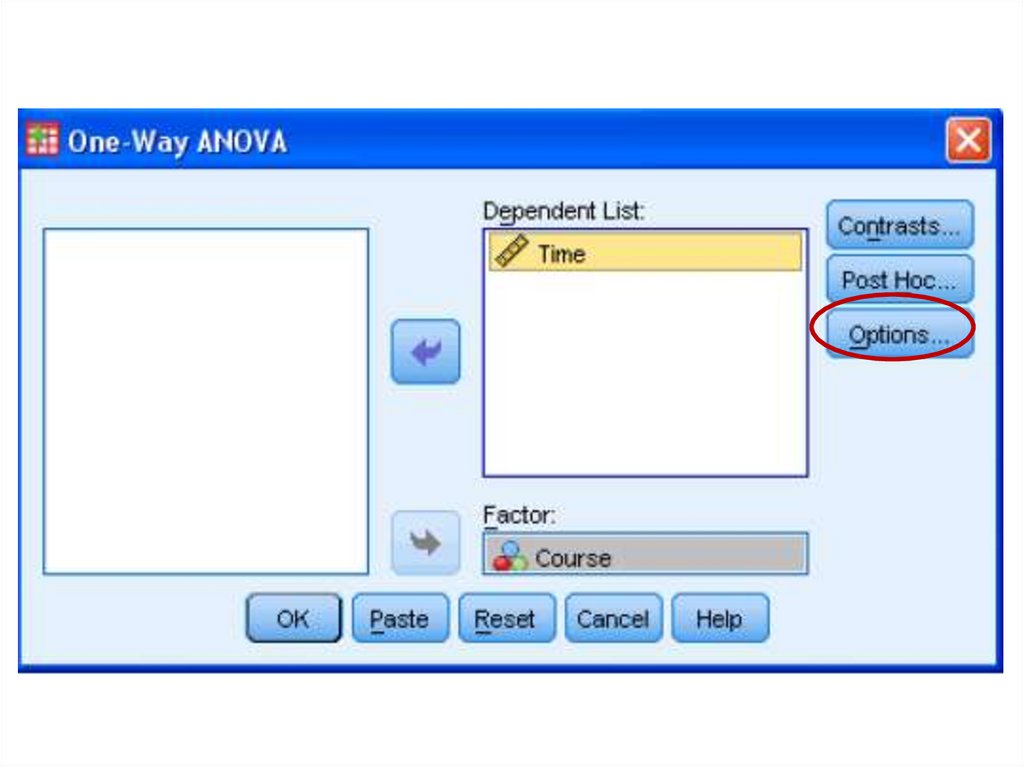
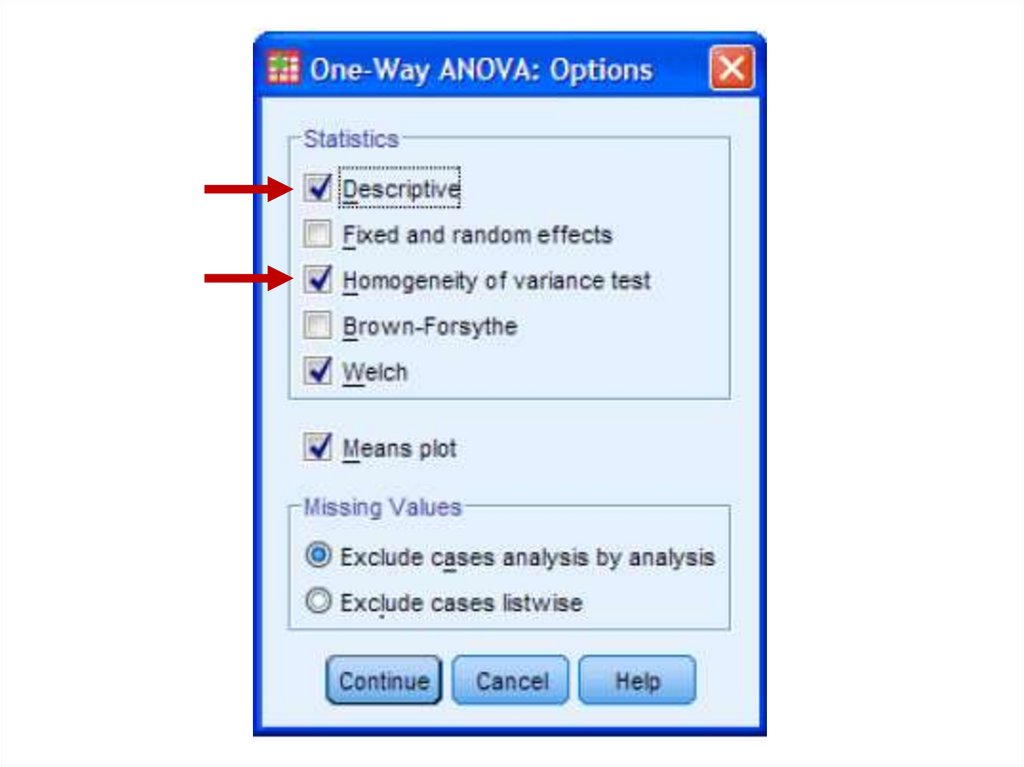
78.
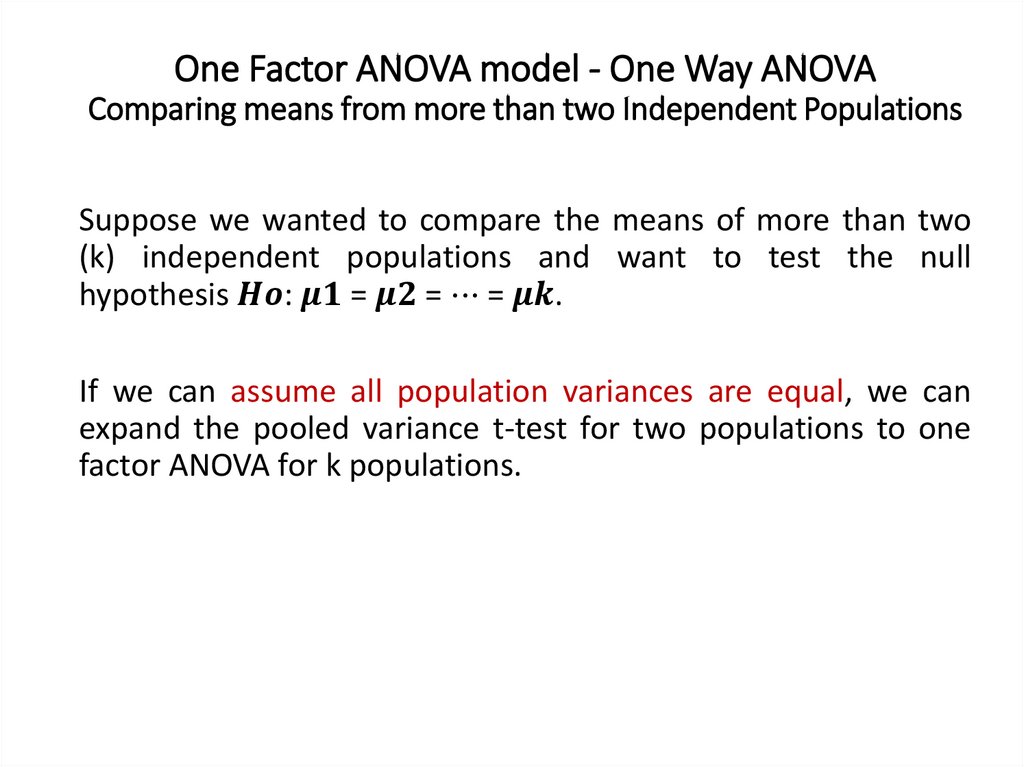
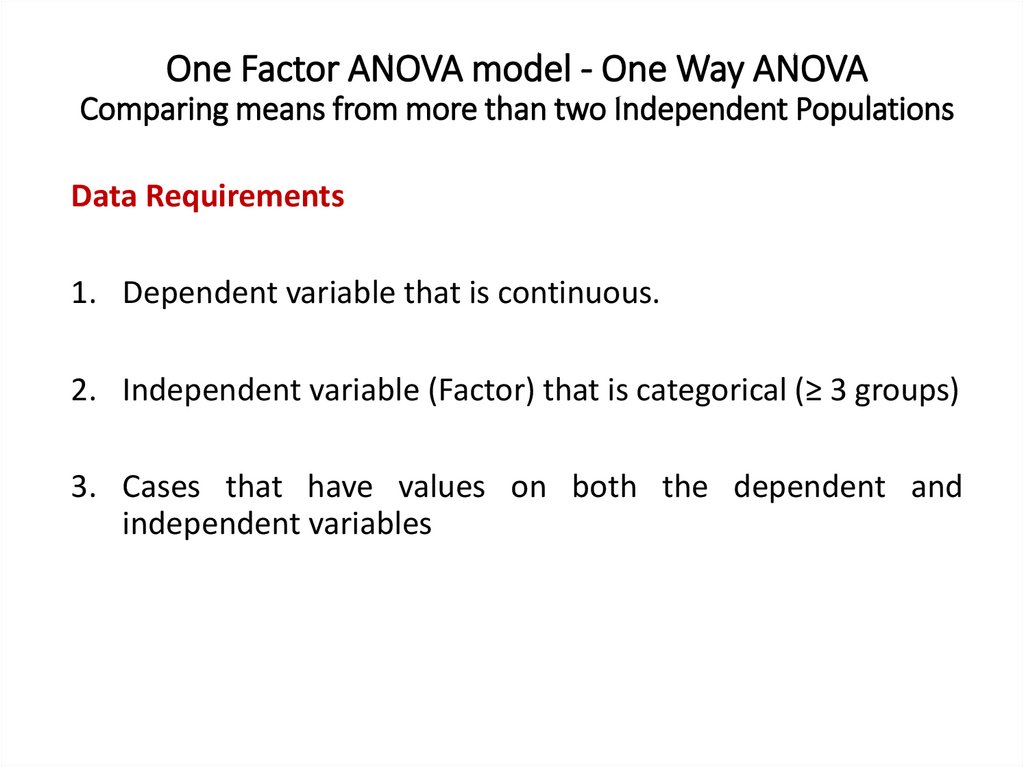
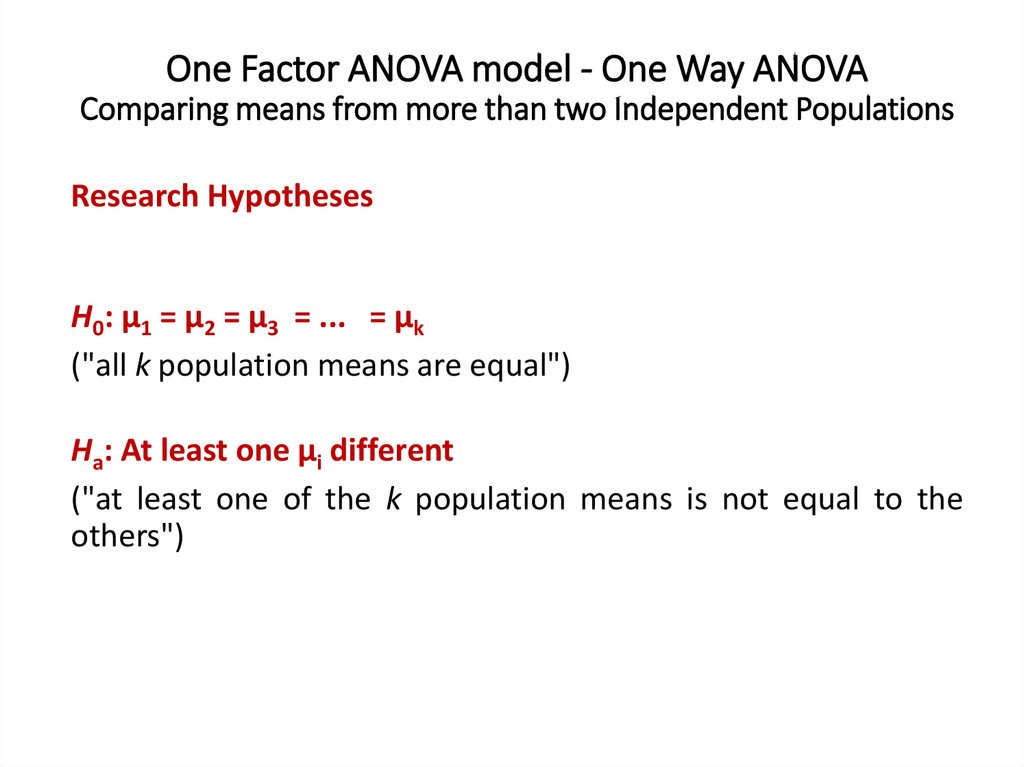
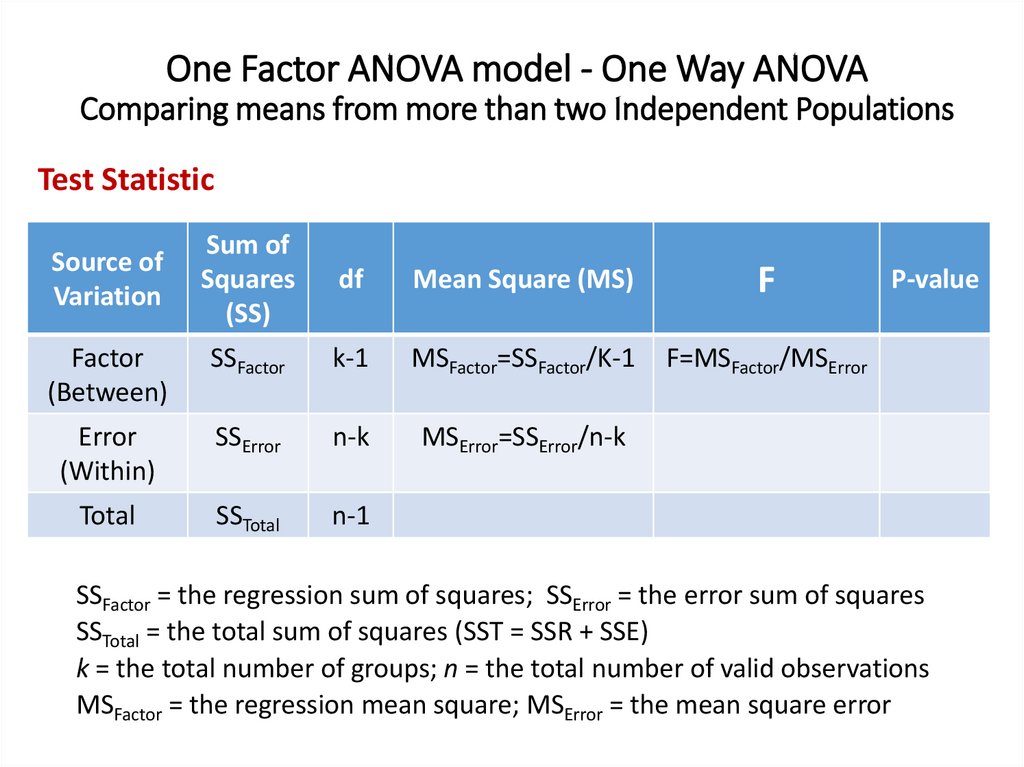
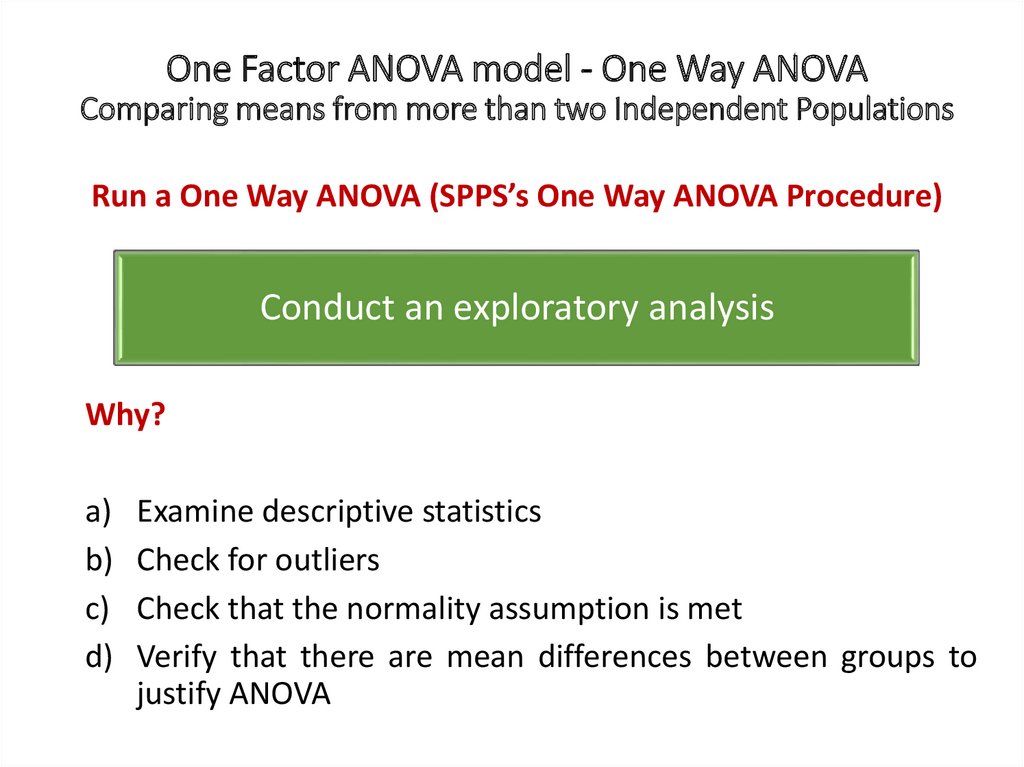
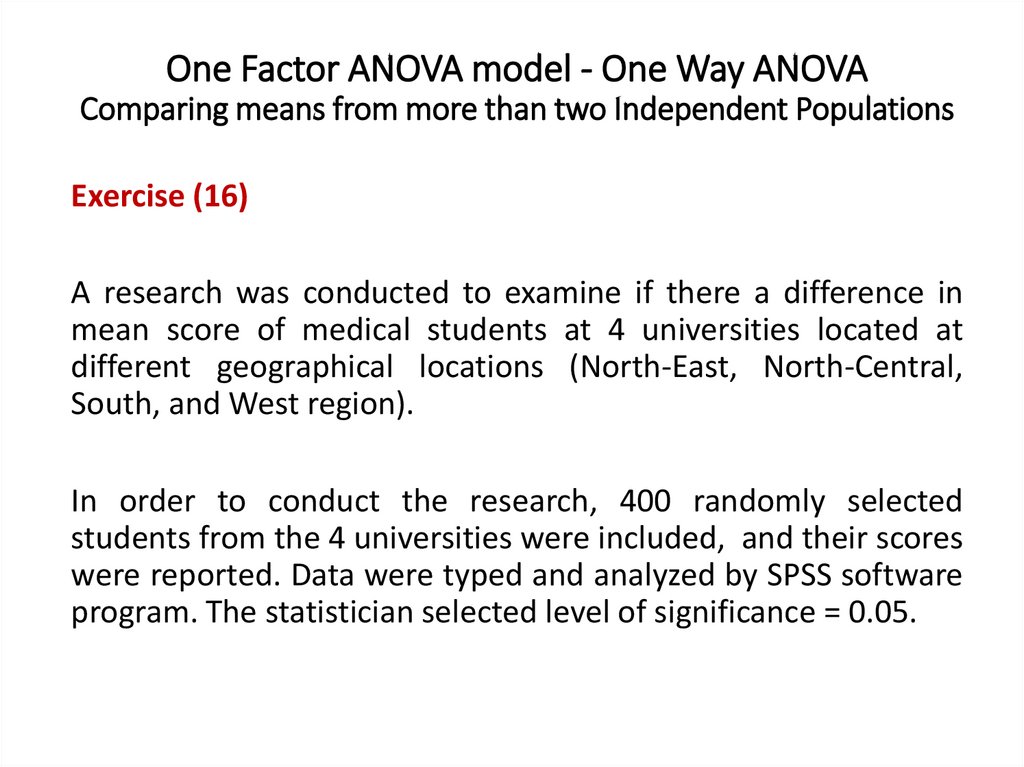
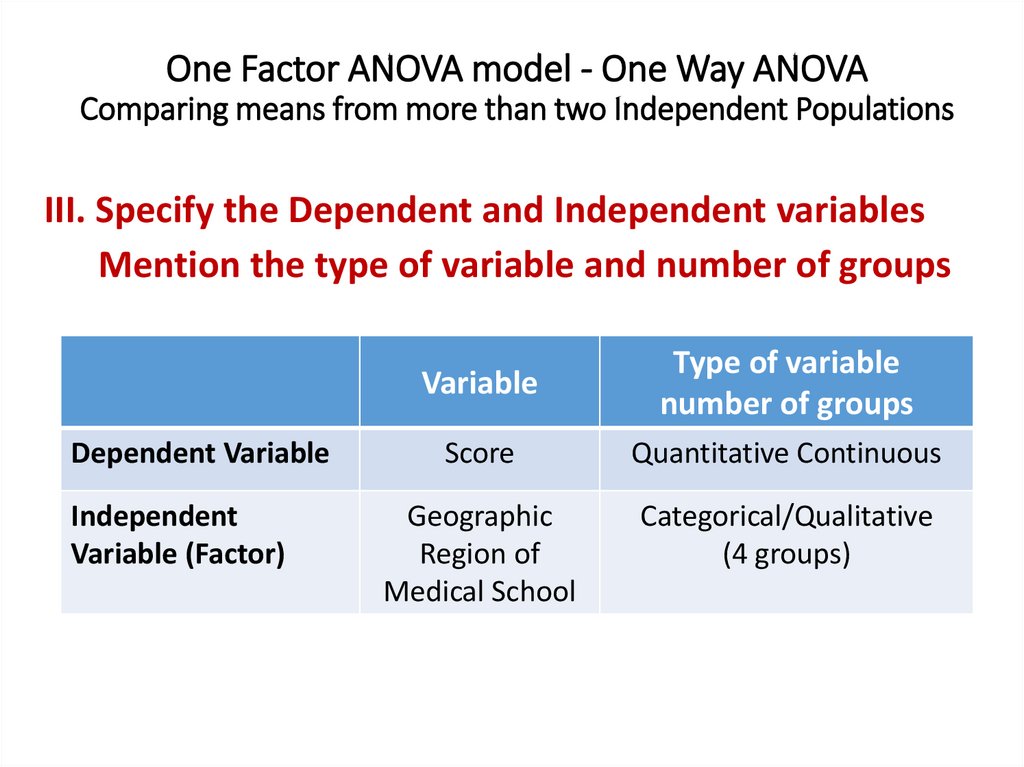
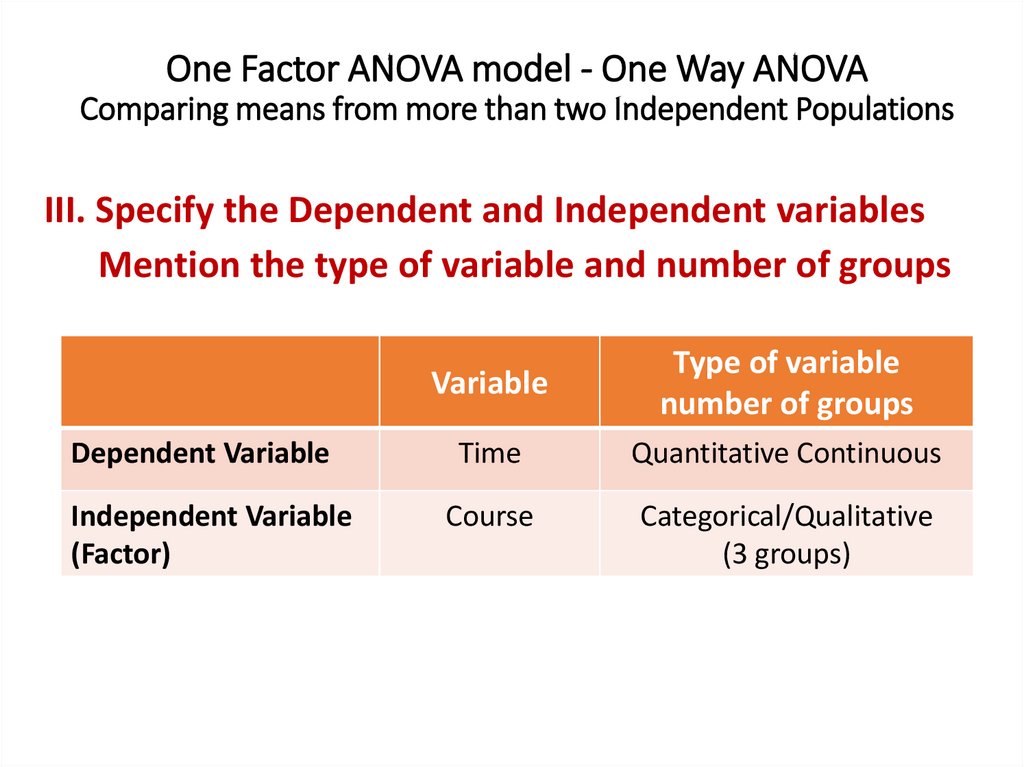
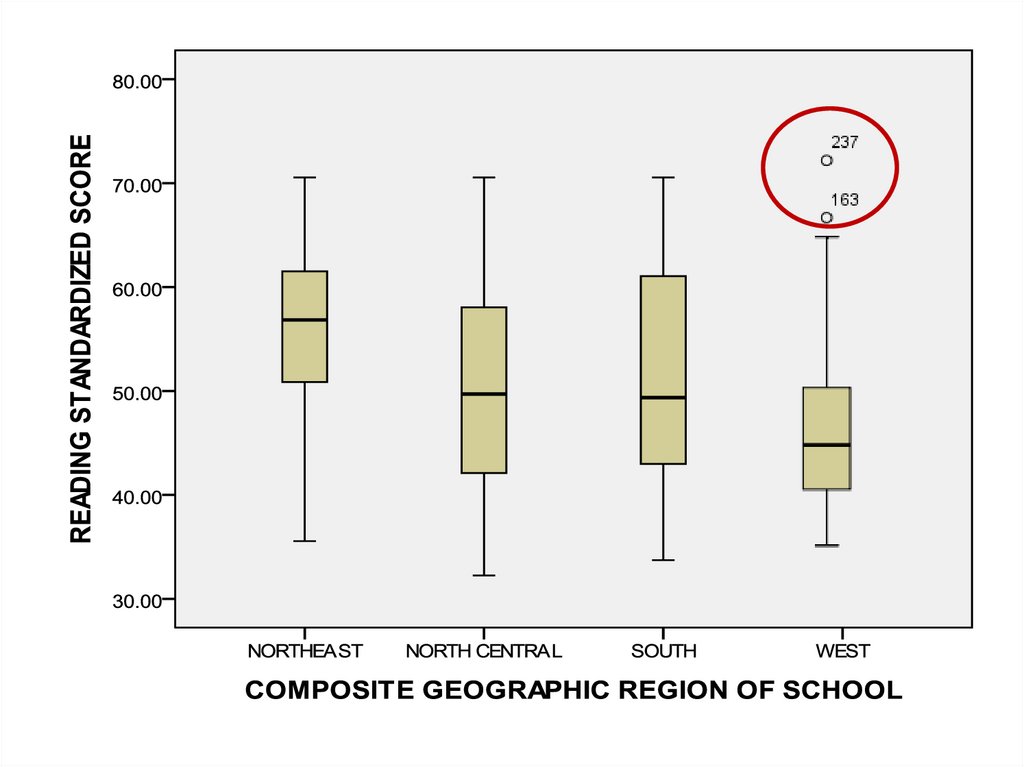
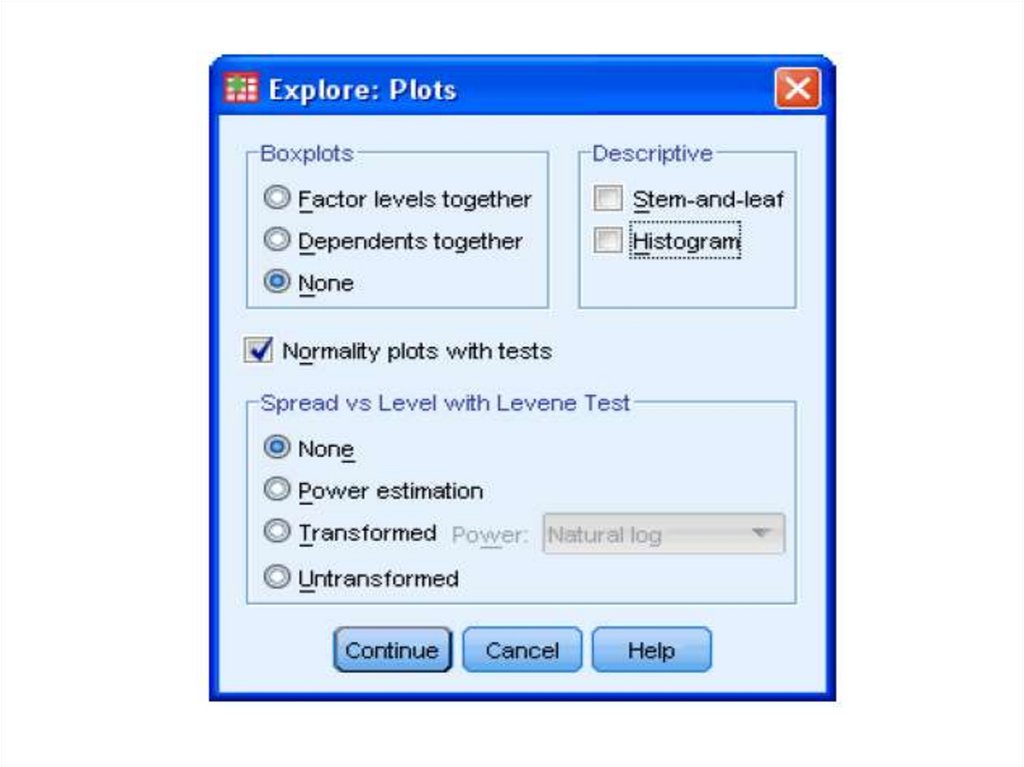
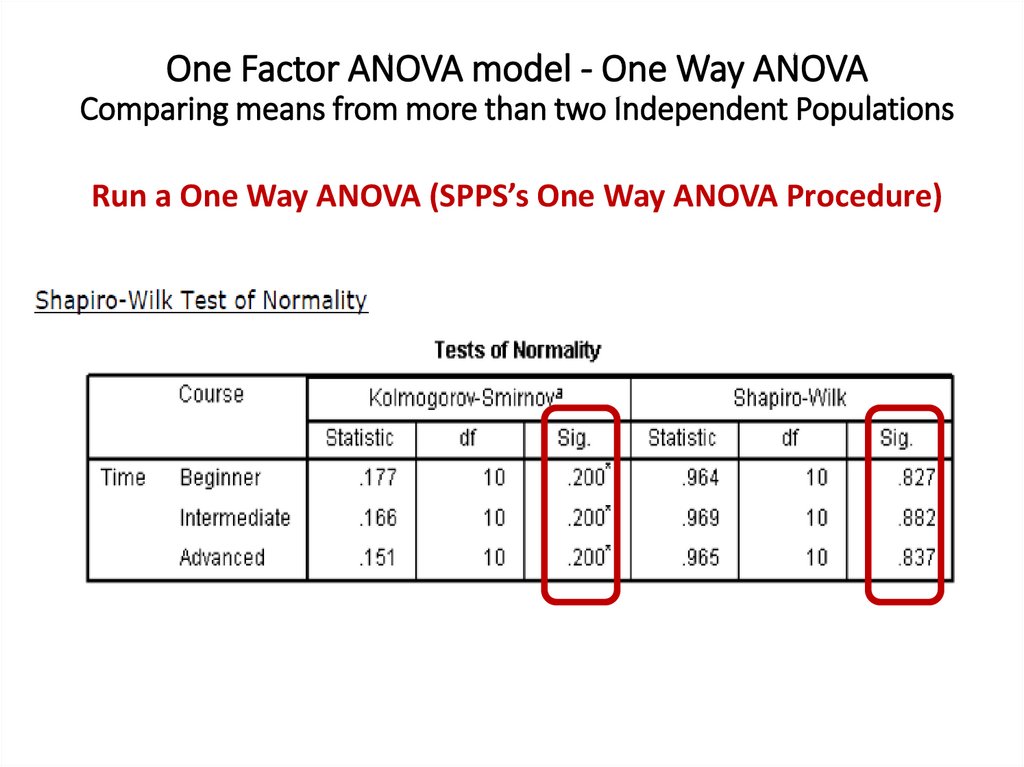
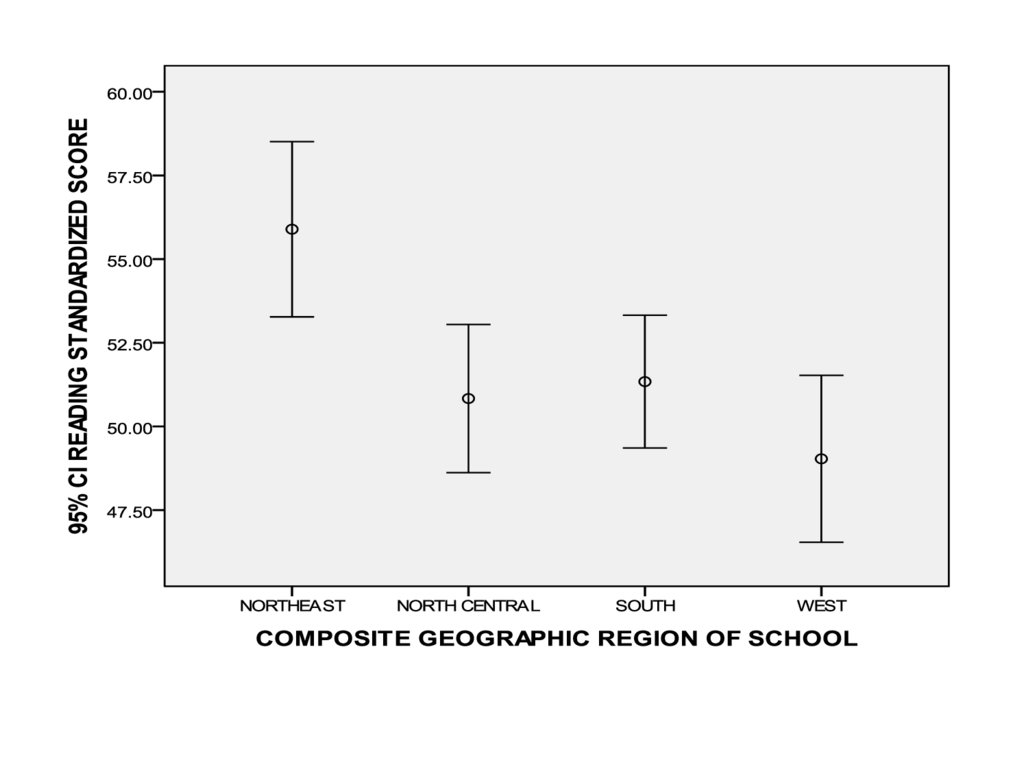
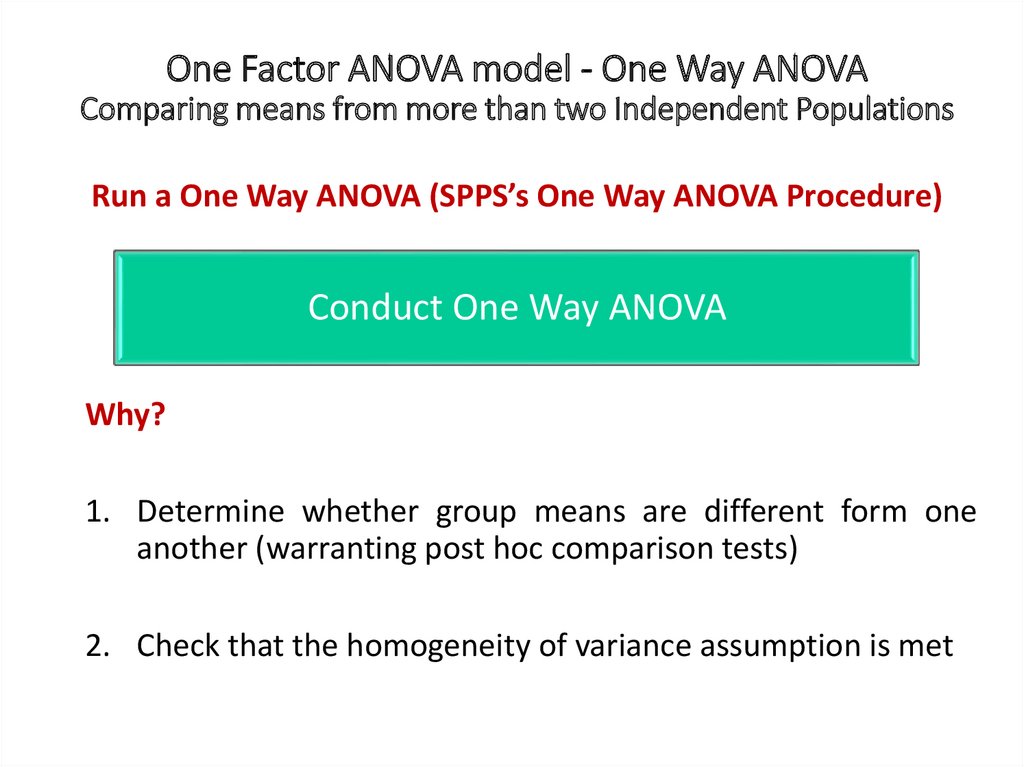
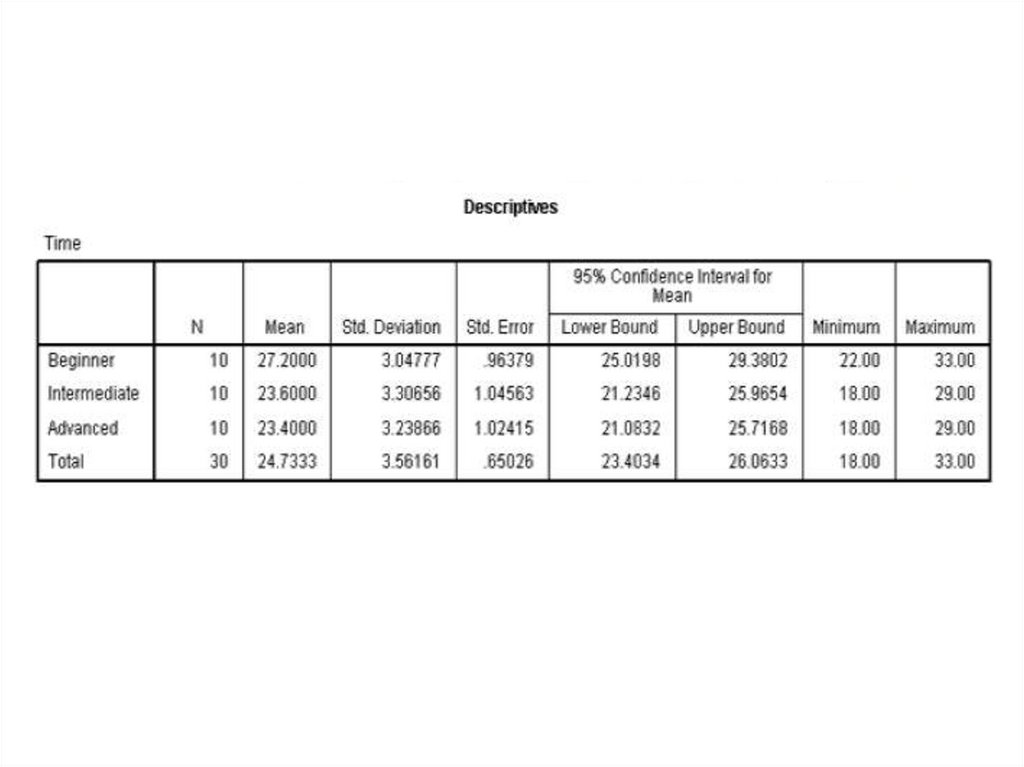
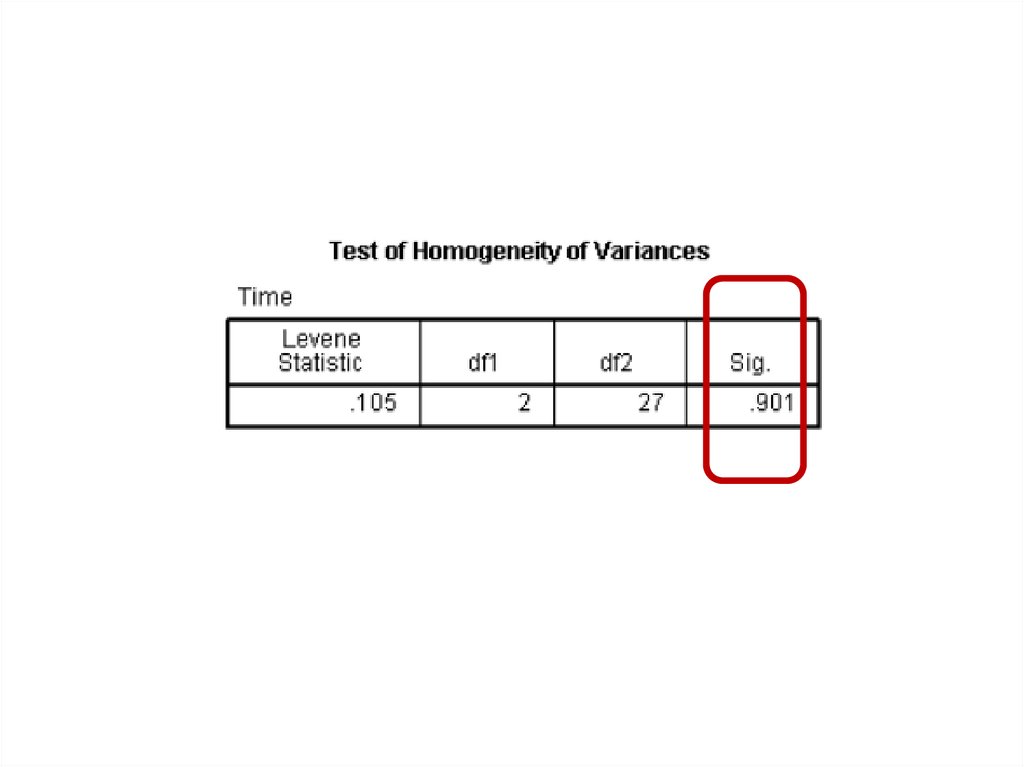
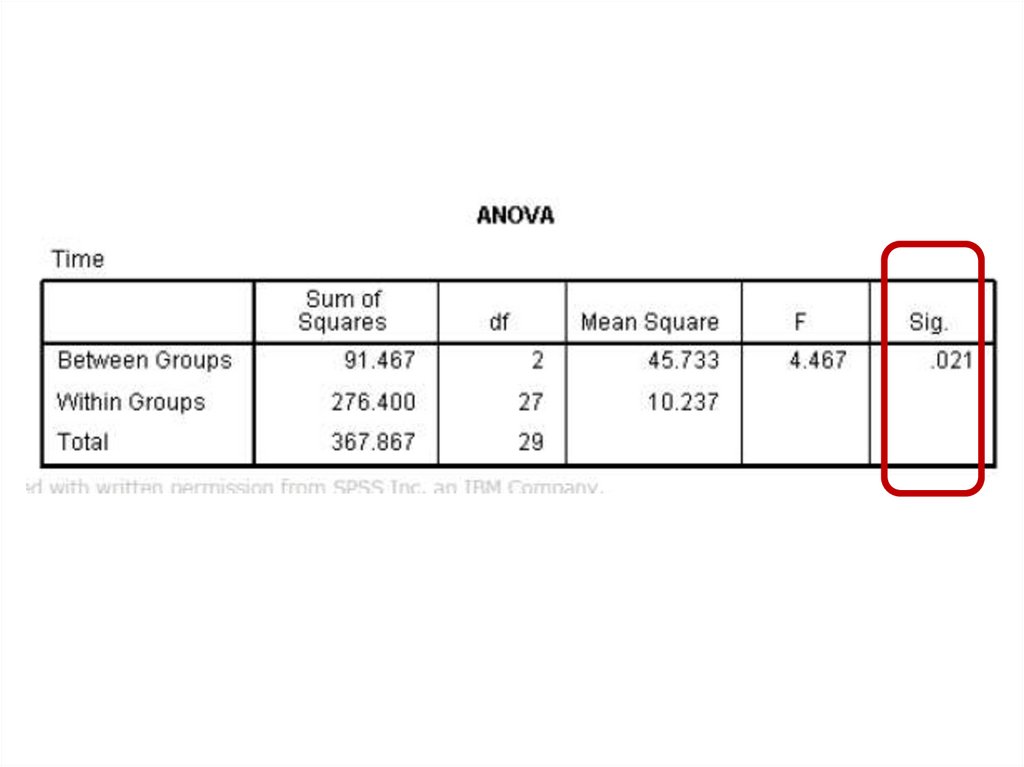
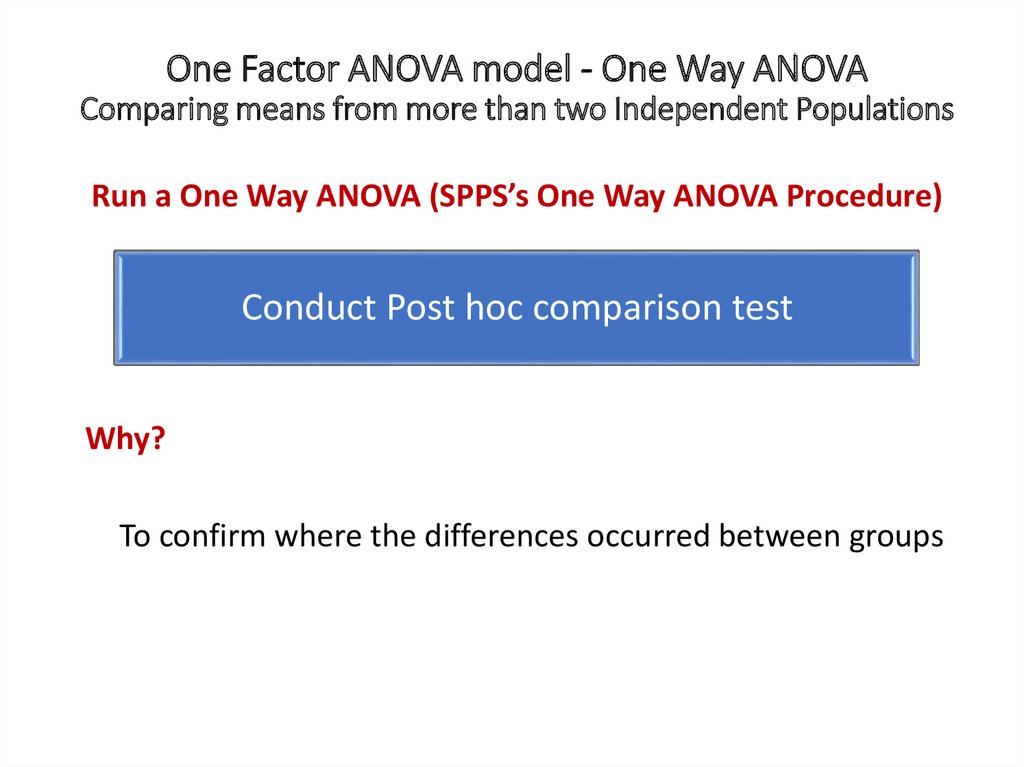
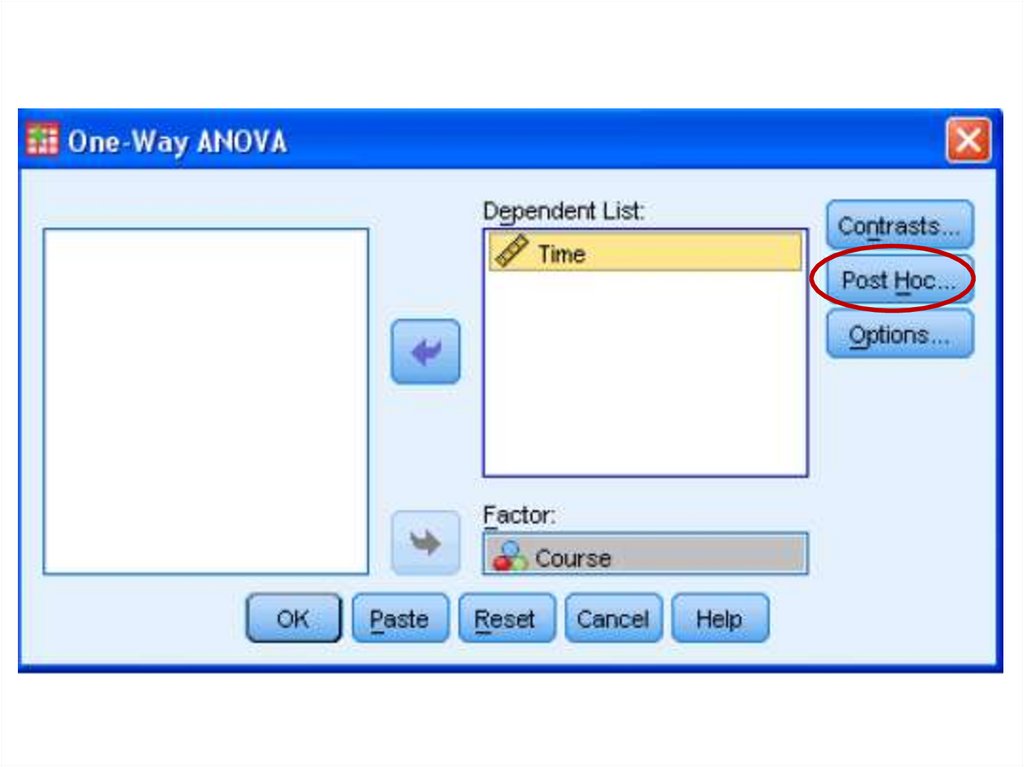
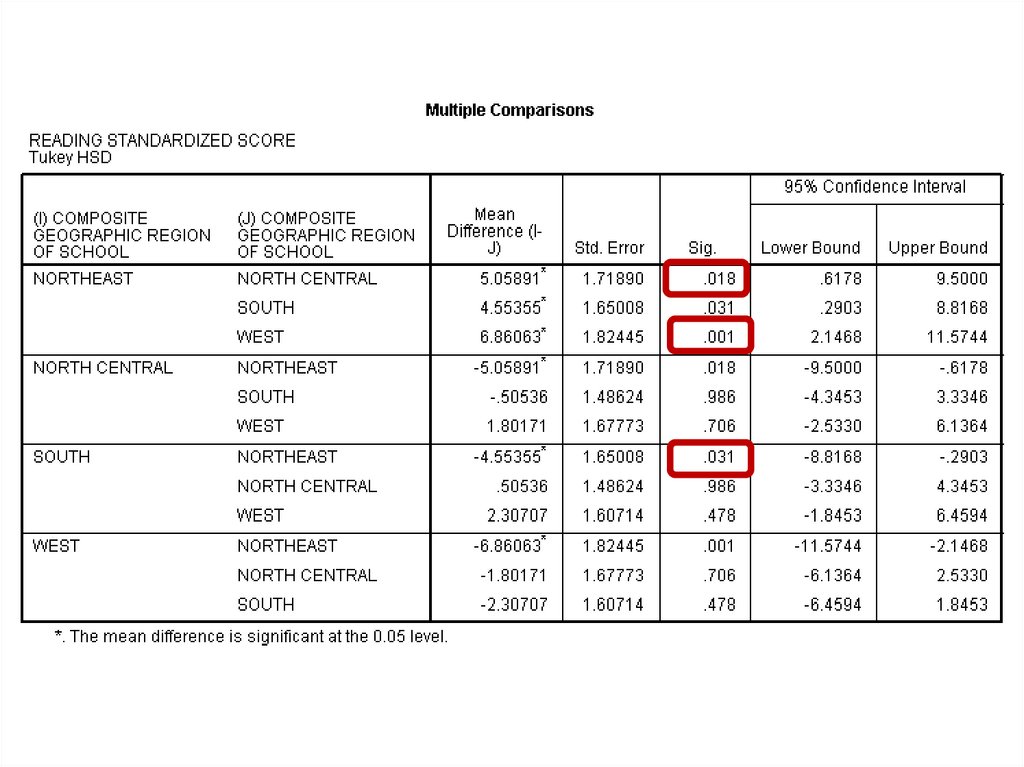
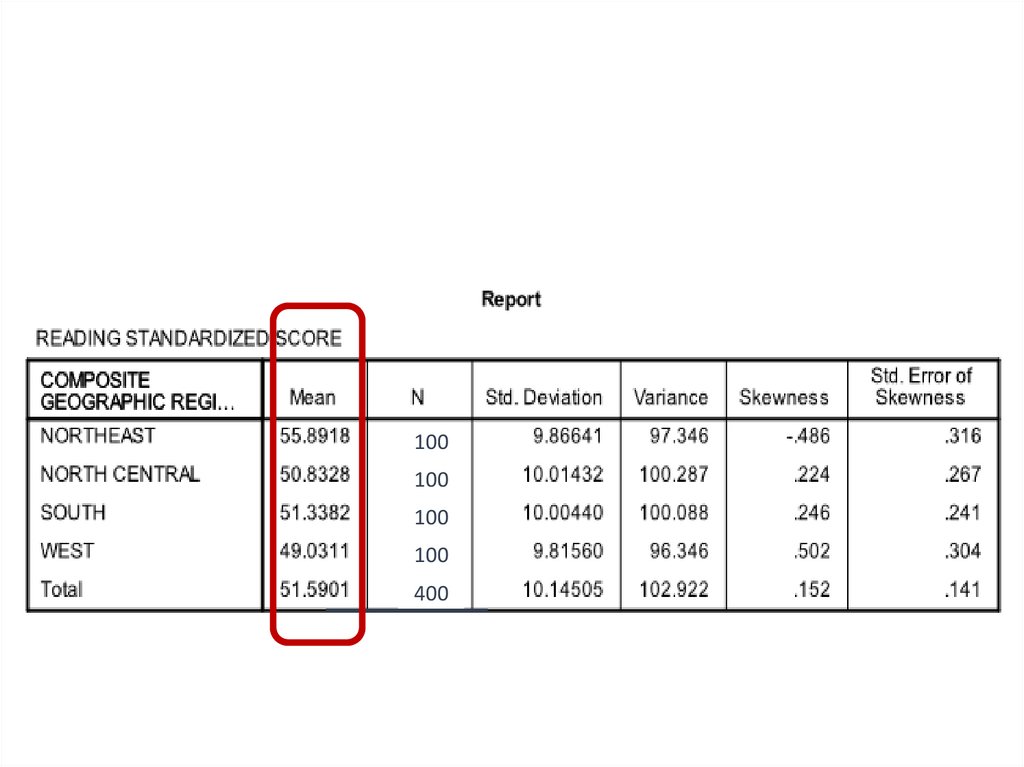
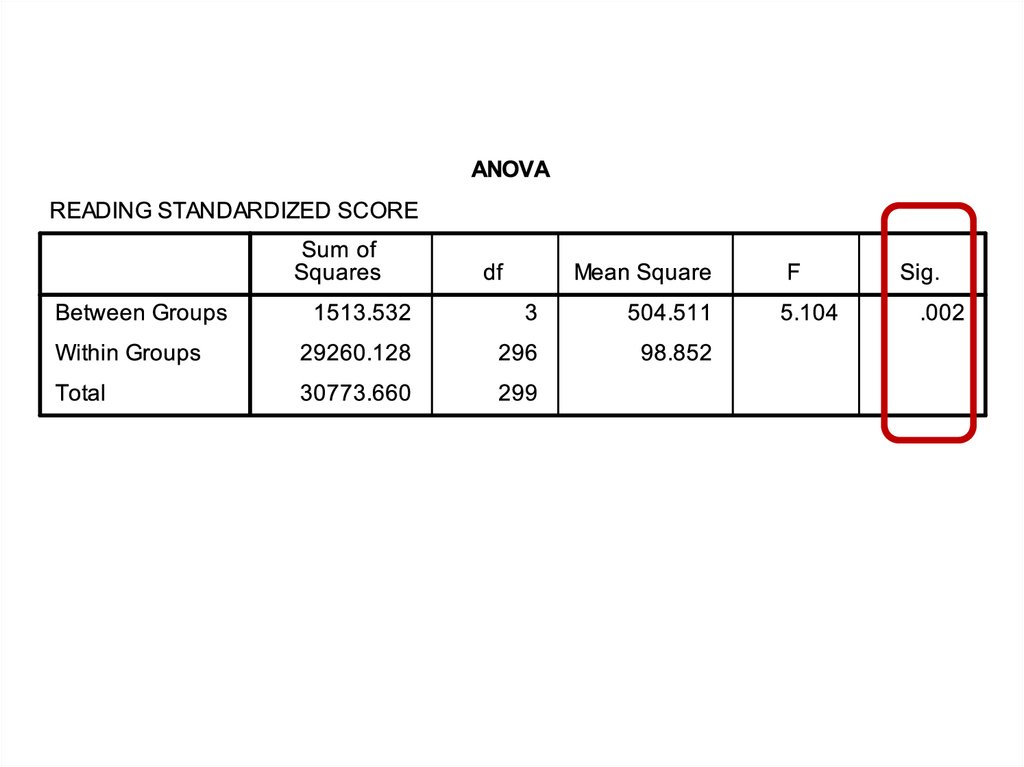
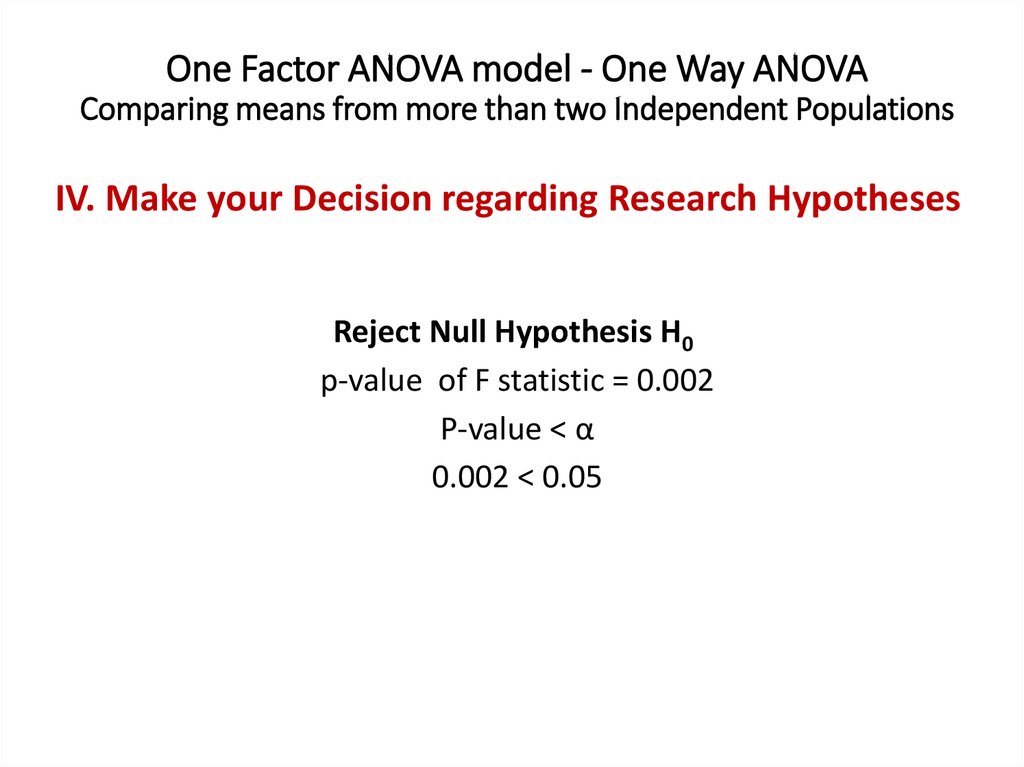
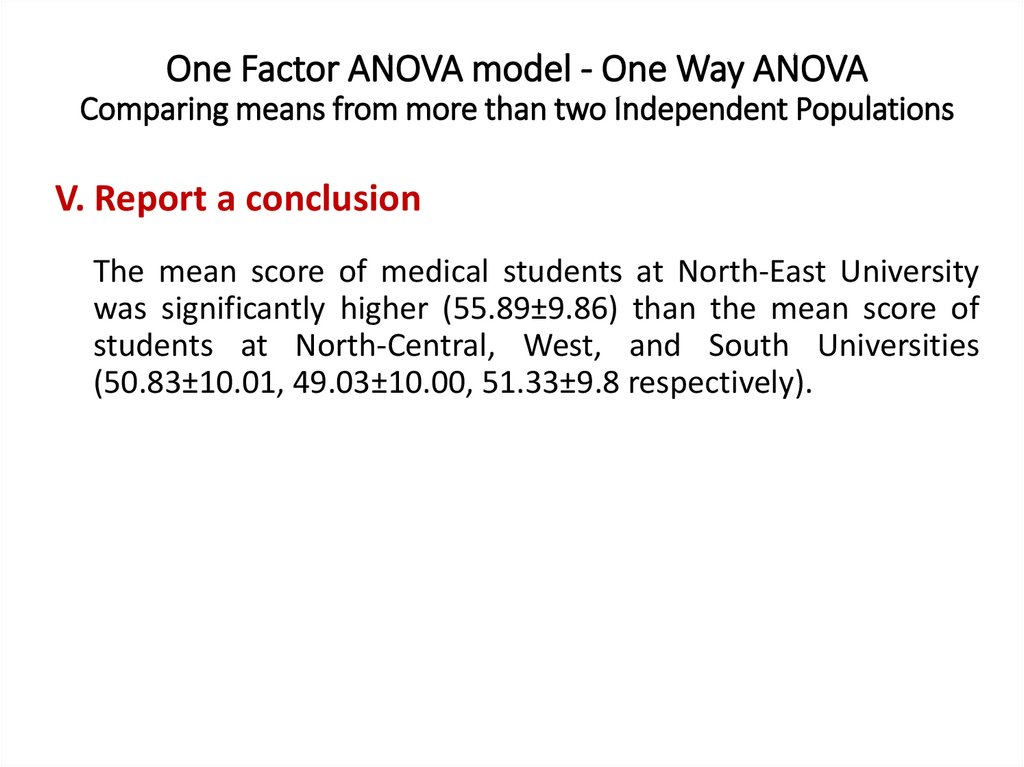
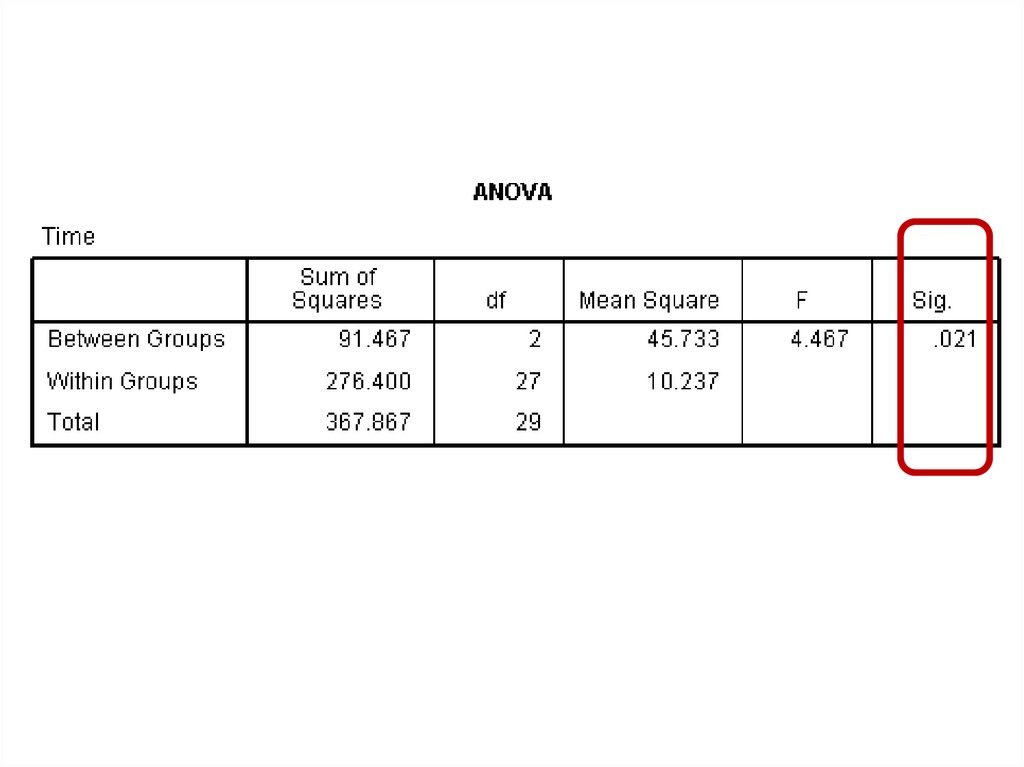
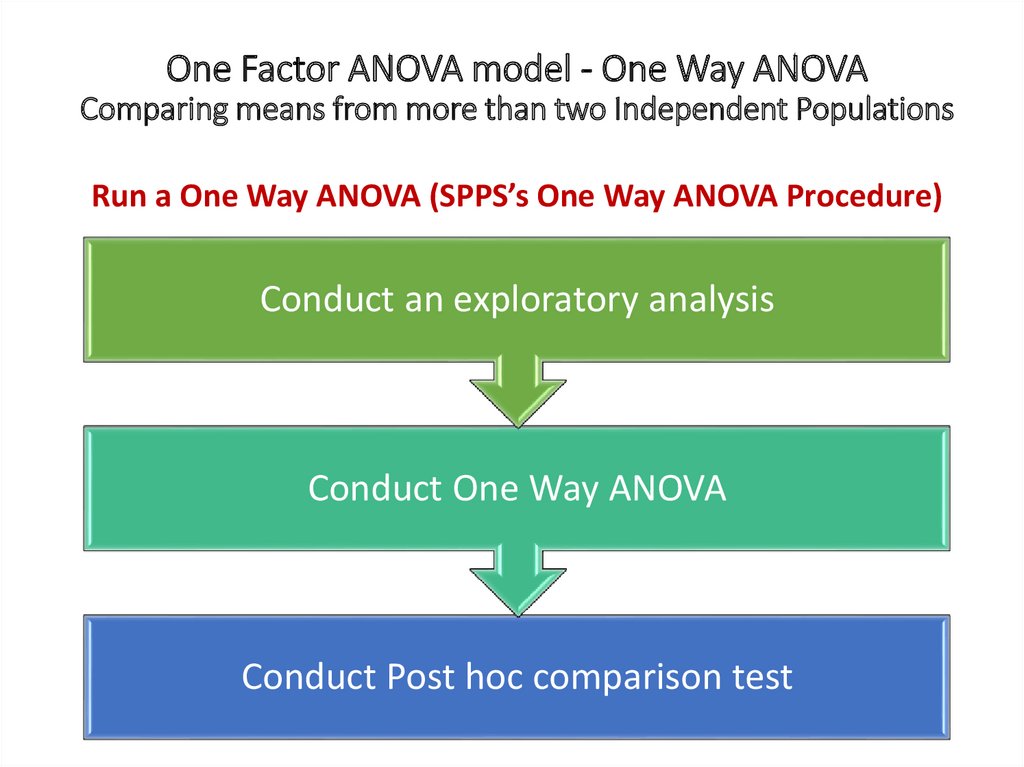
One Factor ANOVA model - One Way ANOVAComparing means from more than two Independent Populations
Suppose we wanted to compare the means of more than two
(k) independent populations and want to test the null
hypothesis