Similar presentations:
Visual enhance. IoT and stuff
1.
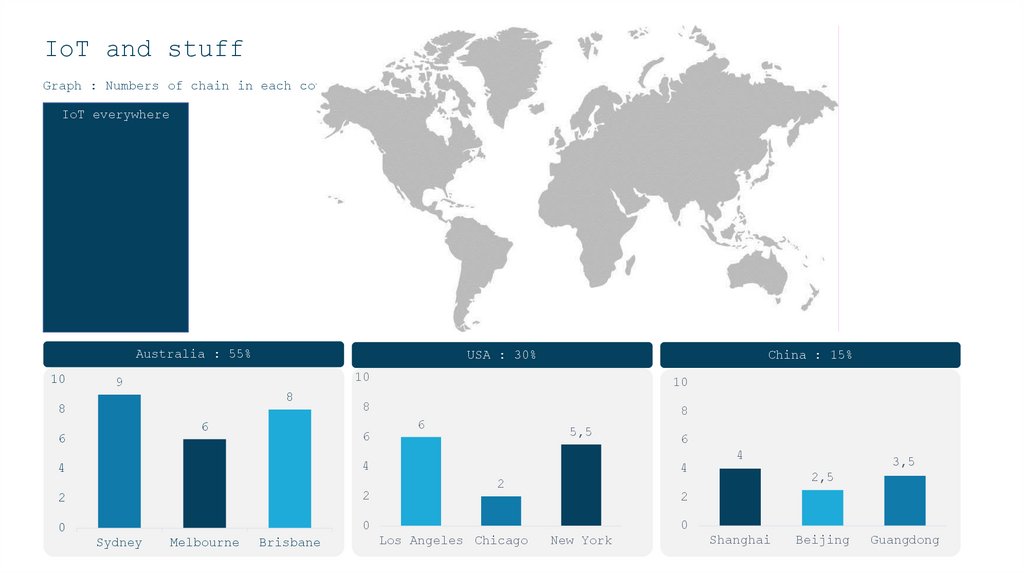
IoT and stuffGraph : Numbers of chain in each country
IoT everywhere
Australia : 55%
10
USA : 30%
10
9
8
8
6
6
6
4
2
2
0
0
Melbourne
Brisbane
10
8
4
Sydney
China : 15%
8
6
5,5
6
4
4
2
3,5
2,5
2
0
Los Angeles Chicago
New York
Shanghai
Beijing
Guangdong

 internet


