


 A Team")


 economics
 finance
Similar presentations:


Европейские технологические платформы
1. Европейские технологические платформы
In Partnership with&
Европейские
технологические
платформы
Самый полный анализ
европейских технологий на основе
данных
stateofeuropeantech.com
www.stateofeuropeantech.com
1
In Partnership with
&
2. 01 2019 основные результаты
012019основные результаты
www.stateofeuropeantech.com
2
In Partnership with
&
3. 01sgnidnfiyeK01
Инвестированный в Европукапитал
01
f iye
id
n
sg
01
K
Мы приближаемся к отметке $110 млрд,
вложенных в Европу с 2015
Общие инвестиции европейских городов ($), 2015- 2019
Нажмите, чтобы изучить интерактивные
графики на нашем сайте
3
29
Страны (Великобритания, Германия и Франция),
чей инвестированный капитал превысил $10млрд.l
Европейские города, привлекающие более $
100 млн капитала, инвестированного только в
2019 году
Visualised with:
www.stateofeuropeantech.com
3
In Partnership with
&
4. 02sgnidnfiyeK01
$B+COMPANIES02
f iye
id
n
sg
01
K
Ознакомьтесь с историей
успеха Европы на
миллиард долларов
Совокупное число европейских технологических компаний,
поддерживаемых венчурными инвесторами по странам и годам.
достигающих отметки в млрд дол
Нажмите, чтобы изучить интерактивные
графики на нашем сайте
20
100%
Страны с венчурными компаниями,
достигающие оценку в млрд дол
Получившие Млрд дол европейские венчурные
компании основанные после 2010
Visualised with:
www.stateofeuropeantech.com
4
In Partnership with
&
5. 03sgnidnfiyeK01
Привлеченные венчурные фонды03
f iye
id
n
sg
01
K
В рекордный 2018 г европейские венчурные
инвесторы собрали более 13 миллиардов
долларов.
Совокупные привлеченные венчурные фонды
2010-2014и 2015-2019
Совокупный объем привлеченных венчурных фондов
($млрд) за выбранные периоды времени
Нажмите, чтобы изучить интерактивные
графики на нашем сайте
$50млрд
$902млн
Средства, собранные венчурными
компаниями за первое полугодие 2015-2019
рекордные инвестиции пенсионных фондов
в европейские венчурные фонды в 2018 году
Visualised with:
www.stateofeuropeantech.com
5
In Partnership with
&
6. 04sgnidnfiyeK01
ЕВРОПЕЙСКИЕ ТЕХНИЧЕСКИЕ УЧРЕДИТЕЛИ04
f iye
id
n
sg
01
K
Мы опросили более 1200
основателей со всей Европы.
Исследуйте набор данных!
Ответы европейских основателей (анонимно)
50% респондентов впервые являются основателями
Нажмите, чтобы изучить интерактивные
графики на нашем сайте
81%
21%
жили комфортно/оплачивали основные расходы с
дополнительными остатками
Респондентов являются женщинами
Visualised with:
www.stateofeuropeantech.com
6
In Partnership with
&
7.
01Key findings
05
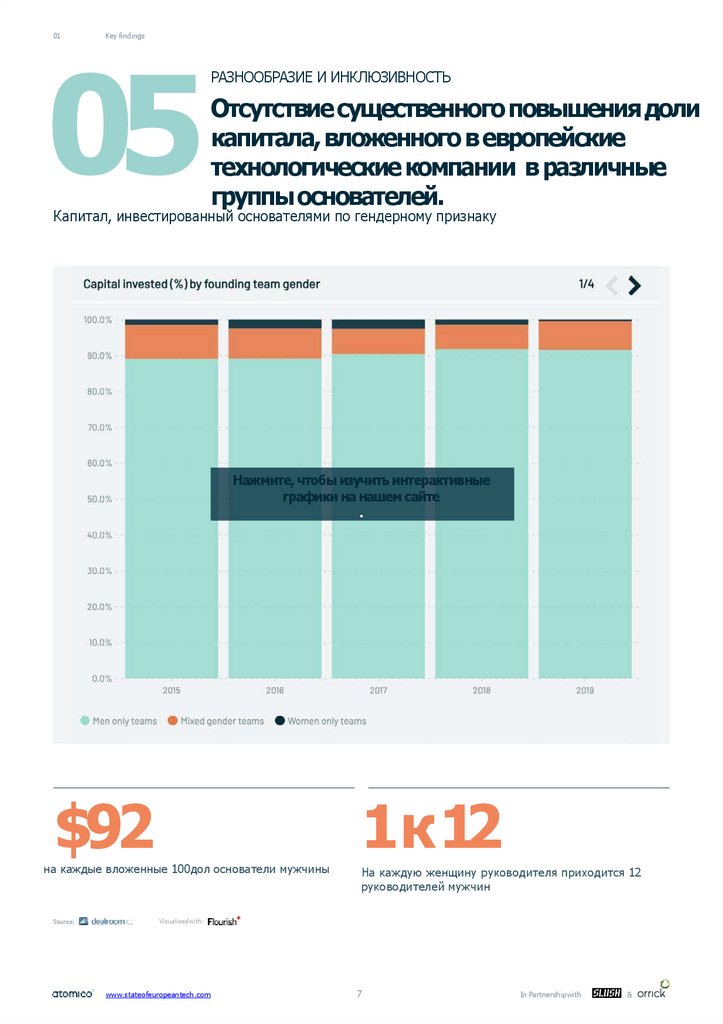
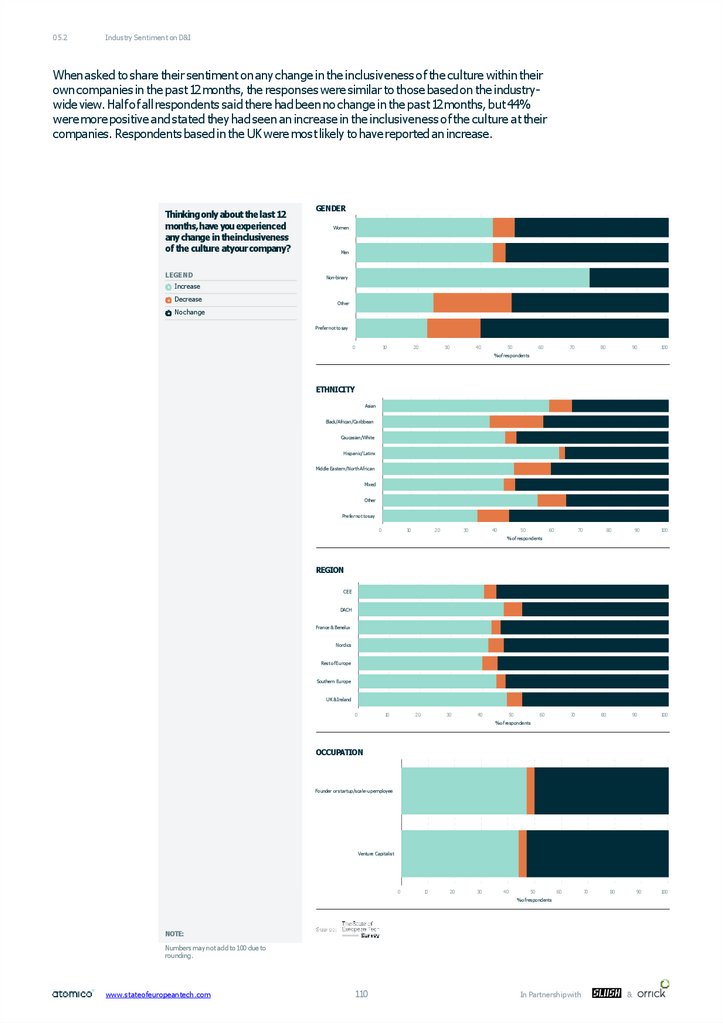
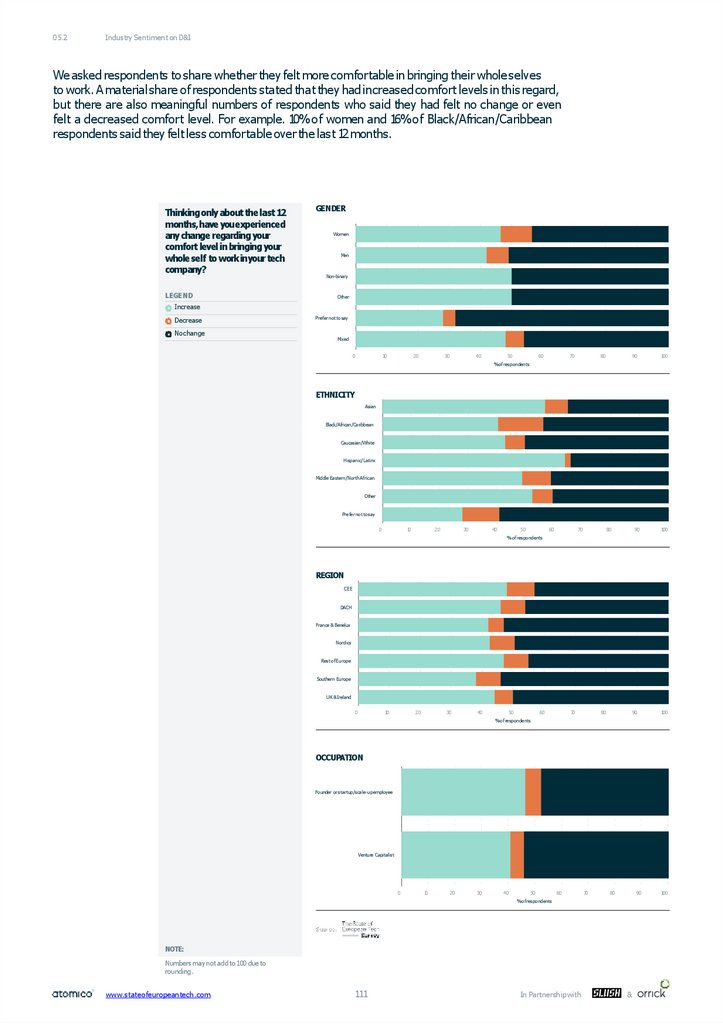
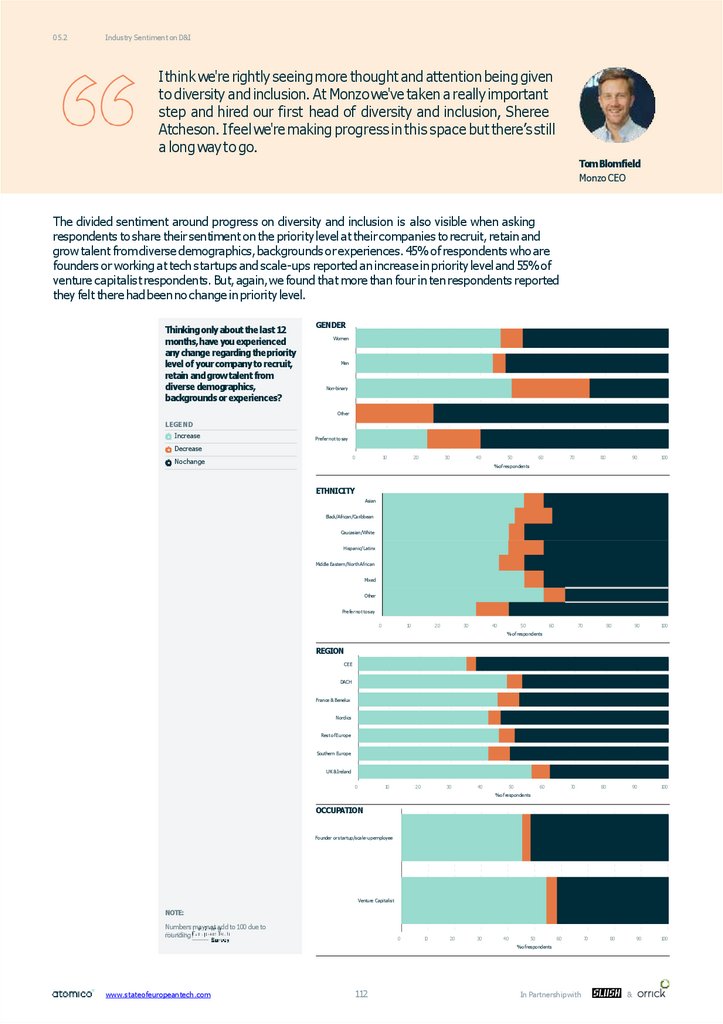
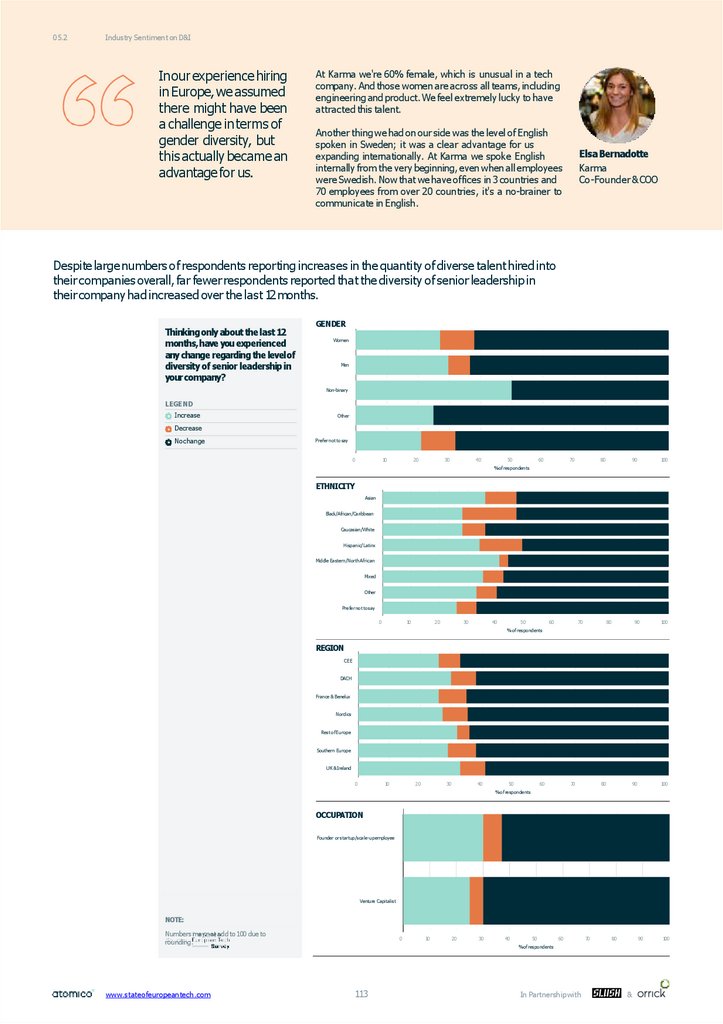
РАЗНООБРАЗИЕ И ИНКЛЮЗИВНОСТЬ
Отсутствие существенного повышения доли
капитала, вложенного в европейские
технологические компании в различные
группы основателей.
Капитал, инвестированный основателями по гендерному признаку
Нажмите, чтобы изучить интерактивные
графики на нашем сайте
.
1к12
$92
на каждые вложенные 100дол основатели мужчины
На каждую женщину руководителя приходится 12
руководителей мужчин
Visualised with:
www.stateofeuropeantech.com
7
In Partnership with
&
8. 06sgnidnfiyeK01
ЦЕЛЬ06
f iye
id
n
sg
01
K
Целевые инвестиции
С
С 2005 года создано более 500 европейских технологических компаний, которые считают
устойчивое развитие основной частью своей миссии.
Нажмите, чтобы изучить интерактивные
графики на нашем сайте
.
$4.4млрд
12.3%
капитал, вложенный в целевые европейские
от объема капитала, инвестированного
технологические компании в 2019 году
в европейские технологии в 2019г. , что
в два раза больше, чем в прошлые годы
Visualised with:
www.stateofeuropeantech.com
8
In Partnership with
&
9. Состояние европейских технологий2019
02Состояние
европейских
технологий2019
Почему Европа не может заниматься технологиями?
Пора перестать задавать этот вопрос. У нас есть неопровержимые
доказательства того, что Европейская технологическая экосистема может
поддерживать крупные компании. Мы наблюдаем растущее число крупных
инвестиционных вложений и появление «целеустремленных» компаний,
решающих некоторые из самых больших мировых проблем, а так же наличие
талантливых разработчиков, не менее чем в США; однако остаются такие
проблемы как отсутствие многообразия и расходящиеся приоритеты между
политикой и общественностью.
www.stateofeuropeantech.com
9
In Partnership with
&
10. 02.1
Предисловие к докладу 2019 годаМногое изменилось с тех пор, как мы представили первый отчет о состоянии
европейских технологий в 2015 году . В тот год президент Обама отмечал
первую годовщину соглашения по климату с Китаем, в то время как Совет
Европы размышлял над письмом премьер- министра Великобритании Дэвида
Кэмерона, в котором излагались будущие отношения Великобритании с
Евросоюзом. Будущее имеет обыкновение высмеивать прошлые прогнозы, но
иногда они действительно попадают в цель. Тогда мы считали, что технологии
в Европе уже испытали прорывной год, став платформой для большего успеха.
Однако это убеждение оказалось неуместным.
Если мы сможем обеспечить, безопасность демографических
показателей и многолетнего опыта, у нас будет огромное
конкурентное преимущество перед другими частями света,
которые менее всеобъемлющи.
Мы надеемся, что этот отчет является полезным
исследованием, который является обоснованным
подтверждением способностей Европейцев создавать
технологические компании. Однако этот отчет-не последнее
и не единственное слово о европейских технологиях. Мы
рекомендуем вам посетить города, выходящие за рамки тех,
которые вы обычно посещаете, и живущие широкими и
разнообразными технологическими площадками, которые
вместе представляют собой крупнейшую экономическую
силу экономического роста во всей Европе
Мы пишем этот отчет, чтобы пролить свет на европейскую
технологическую систему. Он намеренно обеспечивает макро
взгляд на ландшафт и предназначен для исследования,
полезного для максимально возможного количества людей. .
Дело в том, что каждый город имеет свою собственную
невероятную историю с собственным микро-составом
основателей, сотрудников, компаний, инвесторов и
университетов, помогающих продвигать технологии как
на местном, так и на региональном уровне. Мы
инвестировали в 20 европейских городов в 15 странах,
но мы помним о том, что у нас есть и слепые зоны. С
каждым годом мы наблюдаем, что европейские
технологии становятся все более взаимосвязанными каждый из нас должен воплотить это в жизнь и
гарантировать, что эти связи будут продолжаться.
Создав прочность талантов и опыта, мы увидим что
технологические знания более эффективно передаются
будущим и нынешним поколениям европейских
основателей. Это поможет нам достичь плотности
населения в Европе: обеспечив равномерное
распределение талантливых разработчиков и
исследователей с капиталом по всему континенту, наш и
без того стремительный прогресс ускорится еще
быстрее. Когда мы начинали в 2015 году , мы верили,
что европейский успех останется без внимания. Сегодня
вера в европейские технологии приходит как извне
нашей экосистемы, так и изнутри. Принято считать, что
вы можете собрать необходимые деньги, нанять лучшую
команду и выйти на международный уровень, не
мигрируя в США. На самом деле ничто так не
демонстрирует этот сдвиг, как приток американского
капитала увеличившегося в пять раз в 2018 году.
At this point, we were amongst a growing but still limited number
of people who truly believed in the ecosystem’s potential.
Belief is as vital as talent or capital when it comes to building tech
companies. However, in 2015,belief in the European ecosystem
was limited to the European tech industry itself.
Fast forward to 2019,and while the world’smedia may have focused
on Chinese-US trade disputes and volatility on the public markets,
European tech has quietly increased its number of external
believers. We see this everywhere, from the increased time top US
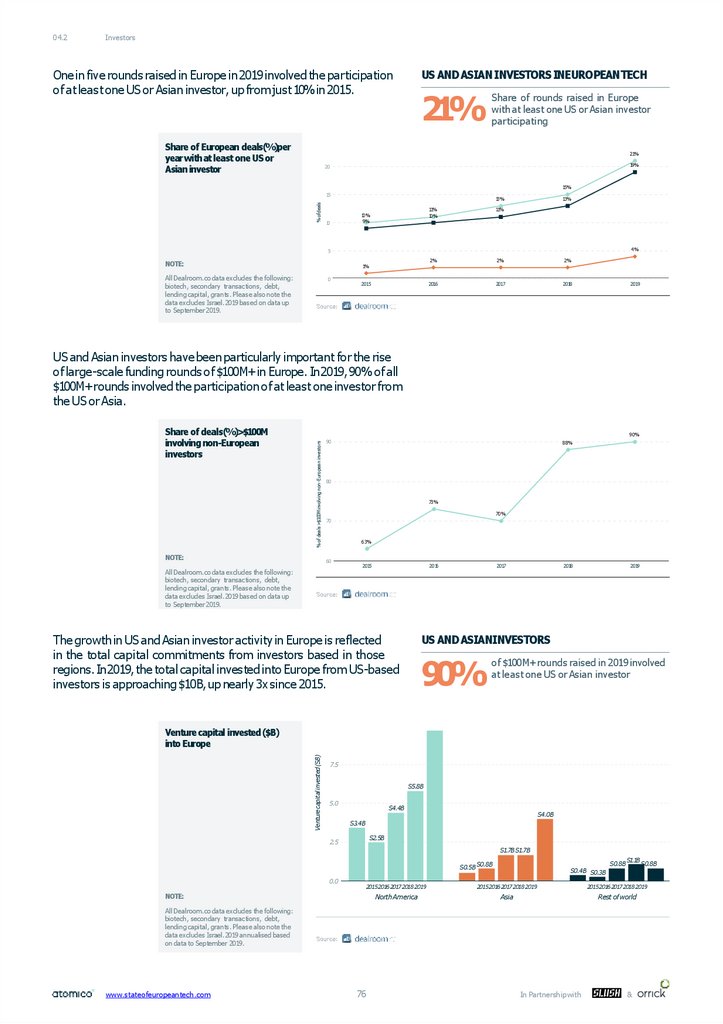
investors are spending on the ground here to the fact that a fifth
of European rounds this year had at least one US or Asian investor
participating - a proportion which grows as the deal size increases.
VCs are reporting increasing interest from global LPs, while
previously unconvinced European Institutional Investors are now
fully engaged. We’re also seeing valuations and pre-emptive term
sheets on the increase in Europe - always a sign that competition
to invest in the best tech companies is accelerating, as well as a
reflection on the quality of the opportunity.
In fact, European tech companies are performing at a level
exceeding the expectations of all but the most optimistic. In
2015, we celebrated $10B of investment into the region’s tech
companies. This year, $35Bseems par for the course. That year,
our report concerned itself with the late-stage funding gap: in
2019,40 different European tech companies were able to raise
$100M+rounds. Todate, there are now at least 174European tech
companies that have scaled to a valuation of over $1B- including
99venture-backed companies.
However, we can’t afford to be complacent- or to lose focus.
Now that we’ve instilled the external as well as internal belief,
it’s up to us to shape our owndestiny when it comes to the future
of European tech. We hope this report provides inspiration and
guidance: we need to address our D&Iissues, acknowledge the
importance of well-being, foster a generation of purpose-driven
companies, reinforce the density of our networks of people
and capital, and end the disconnect between policymakers and
founders.
A wordon our D&Iissues: we won’trealise our full potential
until we stop squandering talent and value.
www.stateofeuropeantech.com
10
In Partnership with
&
11.
02.15 Years of SOET
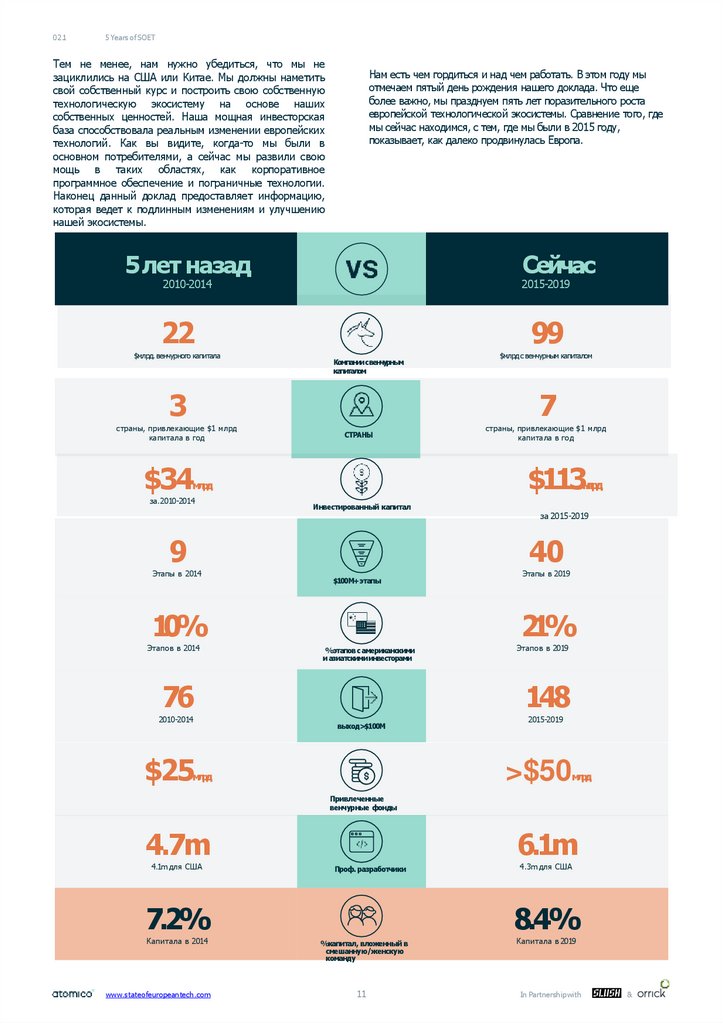
Тем не менее, нам нужно убедиться, что мы не
зациклились на США или Китае. Мы должны наметить
свой собственный курс и построить свою собственную
технологическую экосистему на основе наших
собственных ценностей. Наша мощная инвесторская
база способствовала реальным изменении европейских
технологий. Как вы видите, когда-то мы были в
основном потребителями, а сейчас мы развили свою
мощь в таких областях, как корпоративное
программное обеспечение и пограничные технологии.
Наконец данный доклад предоставляет информацию,
которая ведет к подлинным изменениям и улучшению
нашей экосистемы.
Нам есть чем гордиться и над чем работать. В этом году мы
отмечаем пятый день рождения нашего доклада. Что еще
более важно, мы празднуем пять лет поразительного роста
европейской технологической экосистемы. Сравнение того, где
мы сейчас находимся, с тем, где мы были в 2015 году,
показывает, как далеко продвинулась Европа.
5 лет назад
Сейчас
2010-2014
2015-2019
22
99
$млрд. венчурного капитала
$млрд с венчурным капиталом
Компании свенчурным
капиталом
3
7
страны, привлекающие $1 млрд
капитала в год
страны, привлекающие $1 млрд
капитала в год
СТРАНЫ
$34
$113
млрд
млрд
за.2010-2014
Инвестированный капитал
за 2015-2019
9
40
Этапы в 2014
Этапы в 2019
$100M+этапы
10%
Этапов в 2014
21%
%этапов с американскими
и азиатскими инвесторами
76
2010-2014
Этапов в 2019
148
выход>$100M
$25
2015-2019
>$50
млрд
млрд
Привлеченные
венчурные фонды
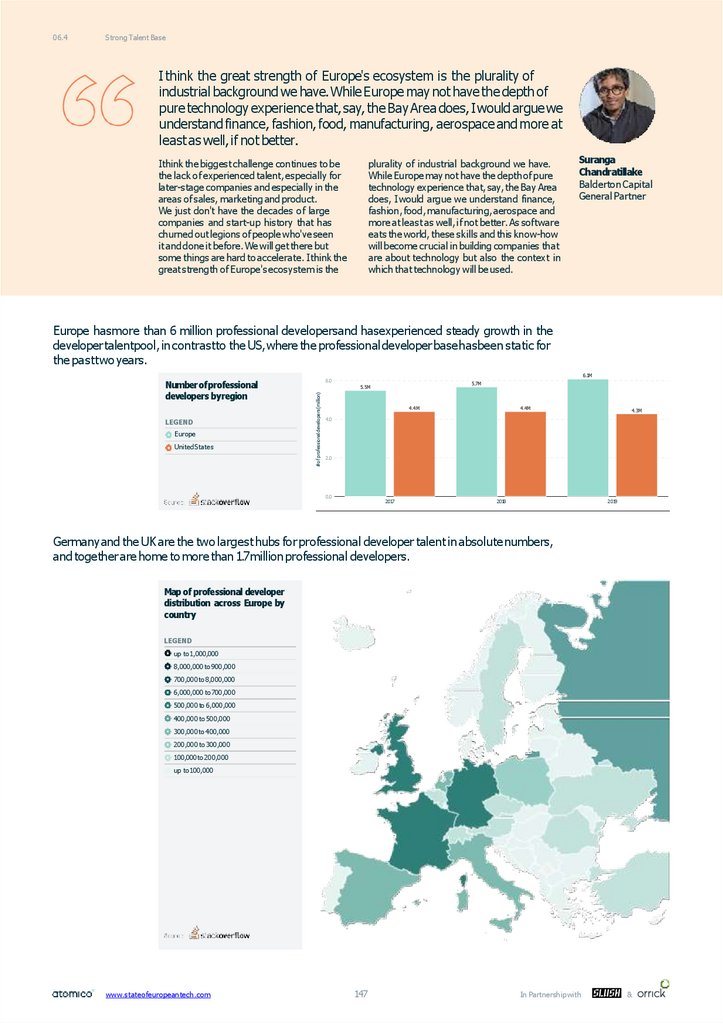
4.7m
4.1m для США
6.1m
Проф. разработчики
7.2%
Капитала в 2014
www.stateofeuropeantech.com
4.3m для США
8.4%
%капитал, вложенный в
смешанную/женскую
команду
11
Капитала в 2019
In Partnership with
&
12. 02.2 Основные положения
Состояние разнообразия ивовлеченности
Этот отчет показывает, что европейское
разнообразие и вовлеченность все еще
недостаточно развиты.
Люди
В 2019 году 92% финансирования досталось мужским командам,
что соответствует цифрам, шокирующим читателей в прошлом
году. Когда вы рассматриваете данные о расе, возрасте,
образовании и социально-экономическом фоне, видно
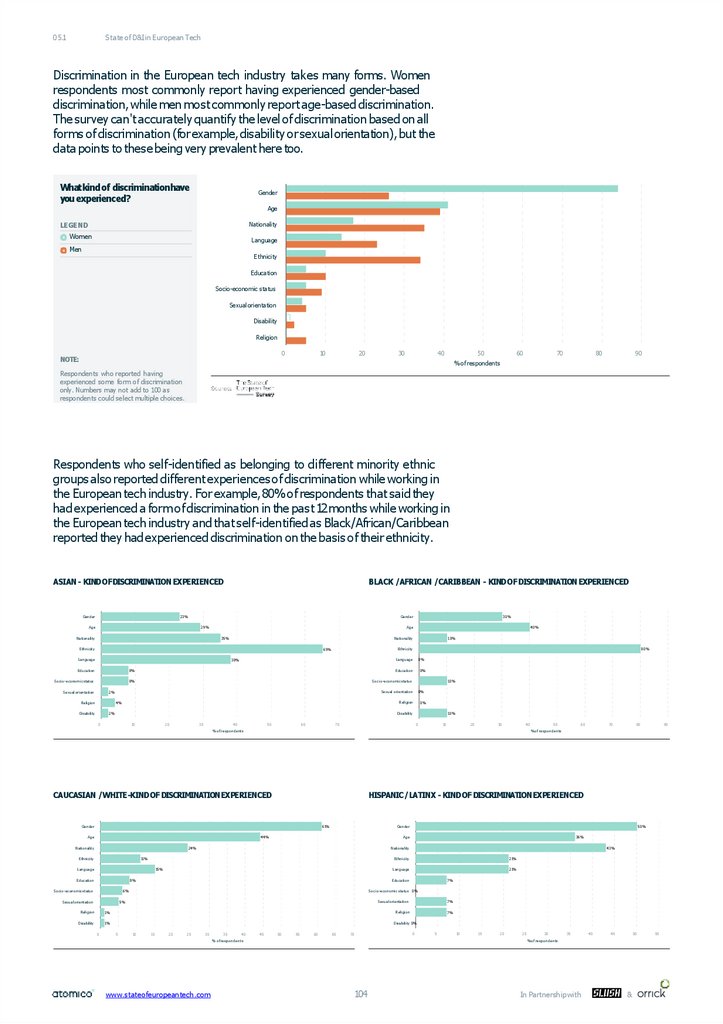
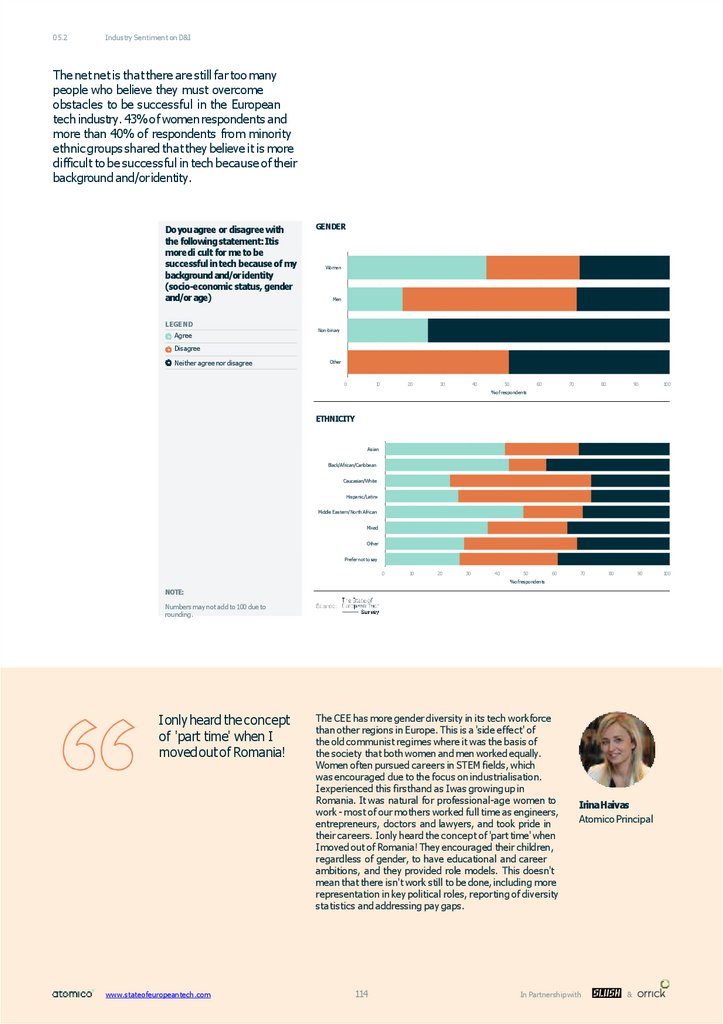
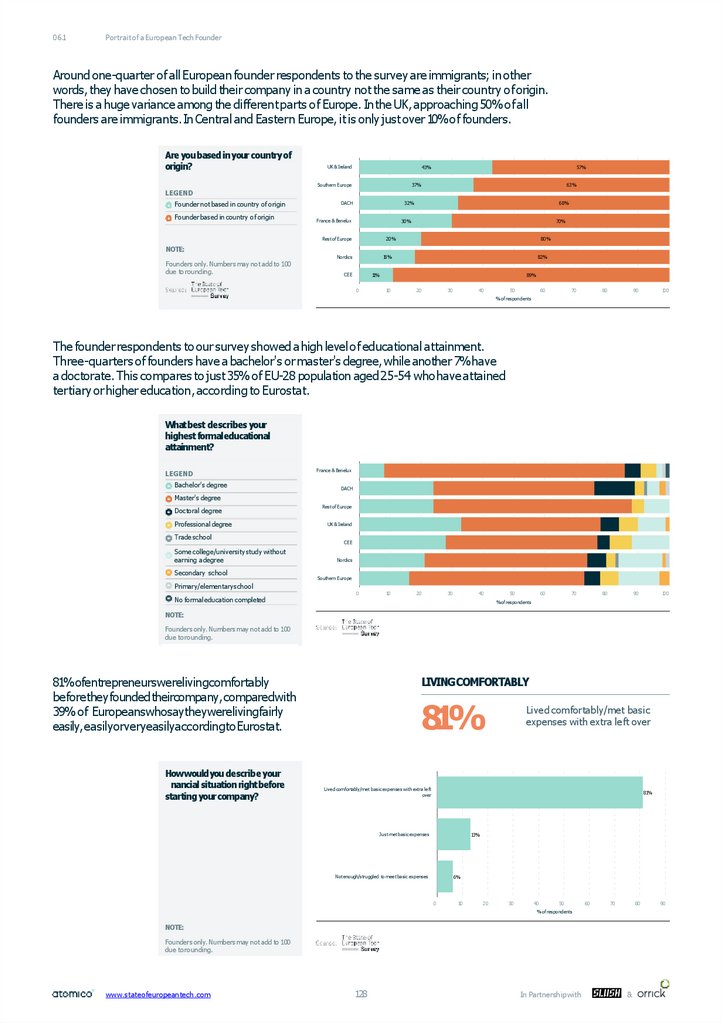
возникновение больших проблем: 43% темнокожих/африканских
/ карибских основателей испытали дискриминацию;80% которых
связывают это со своей этнической принадлежностью.
Темнокожие основатели составили только 1% (0,9%) из более
чем 1200 респондентов-основателей. В 2019 году 92%
финансирования досталось мужским командам, что
соответствует цифрам, шокирующим читателей в прошлом году.
Когда вы рассматриваете данные о расе, возрасте, образовании и
социально-экономическом фоне, видно возникновение больших
проблем: 43% темнокожих/африканских / карибских
основателей испытали дискриминацию;80% которых связывают
это со своей этнической принадлежностью. Темнокожие
основатели составили только 1% (0,9%) из более чем 1200
респондентов-основателей. Мы также обнаружили, что люди с
более низким социально-экономическим статусом менее склонны
становиться предпринимателями: 81% опрошенных основателей
сказали нам, что они жили комфортно до того, как основали
свою компанию против 39% в Европе. Мы также обнаружили,
что люди с более низким социально-экономическим статусом
менее склонны становиться предпринимателями: 81%
опрошенных основателей сказали нам, что они жили комфортно
до того, как основали свою компанию против 39% в Европе.
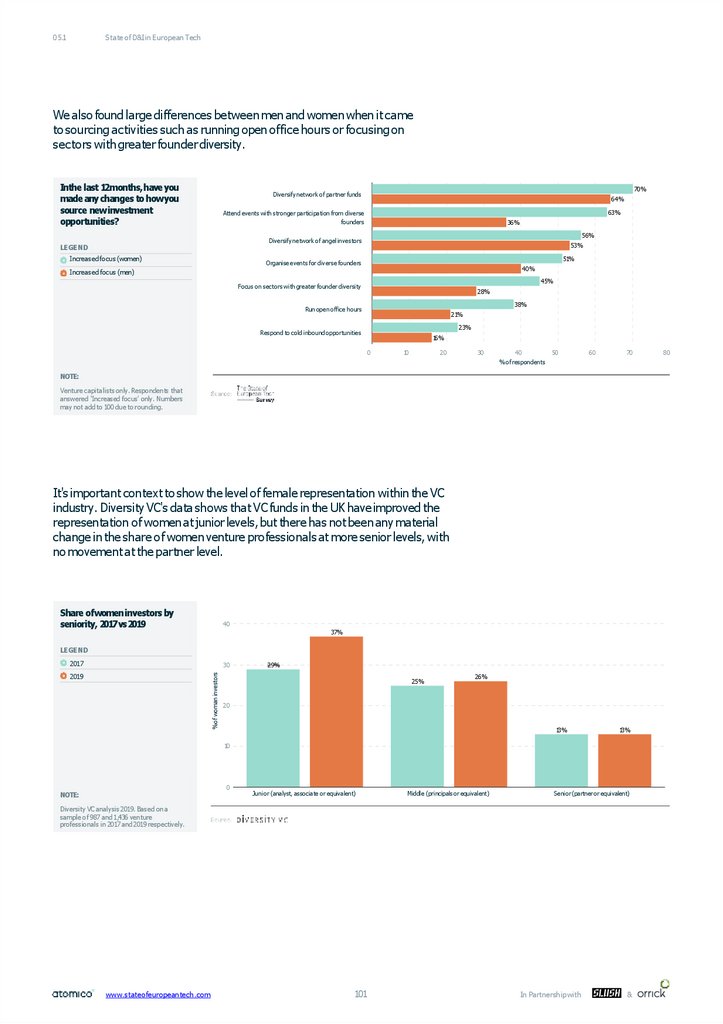
Что также становится все более очевидным, так это то,
что женщины-капиталисты продолжают решать
проблемы разнообразия Европы: 63% из них сообщили
нам, что они увеличили свое внимание на посещение
мероприятий с более активным участием различных
учредителей против 36%мужчин. Это особенно
проблематично, поскольку в докладе за этот год
показано, что венчурные капиталисты не увеличили долю
женщин на уровне партнеров. Один положительный
момент - в быстро растущей отрасли глубоких
технологий, мы обнаружили, что 23% европейских
квантовых компаний имели смешанную или
возглавляемую женщинами команду основателей, что
более чем вдвое превышает средний показатель по
Европе-13%.Это неудивительно, учитывая большую долю
исследователей и ученых, которые являются женщинами:
как показывает доклад, женщины фактически составляют
более половины населения ученых и инженеров в Литве,
Болгарии, Латвии и Дании.
Опираясь на ответы опроса учредителей ,
мы набросали портрет того, как выглядит
типичный европейский технологический
основатель в 2019 году , и как их
проблемы меняются по мере увеличения
их компании.
www.stateofeuropeantech.com
В ходе этого процесса возник целый ряд идей, начиная
от детальной информации о том, как основатели на
ранних стадиях финансировали свой бизнес, и
заканчивая возрастным составом компаний, которые
оценивались в миллиарды долларов. Мы также смогли
изучить интенсивное личное становление, которое
влечет за собой строительство компании, в отчете за
этот год. Мы собрали набор данных, который без
сомнения демонстрирует, что многие основатели хотят
получить помощь.
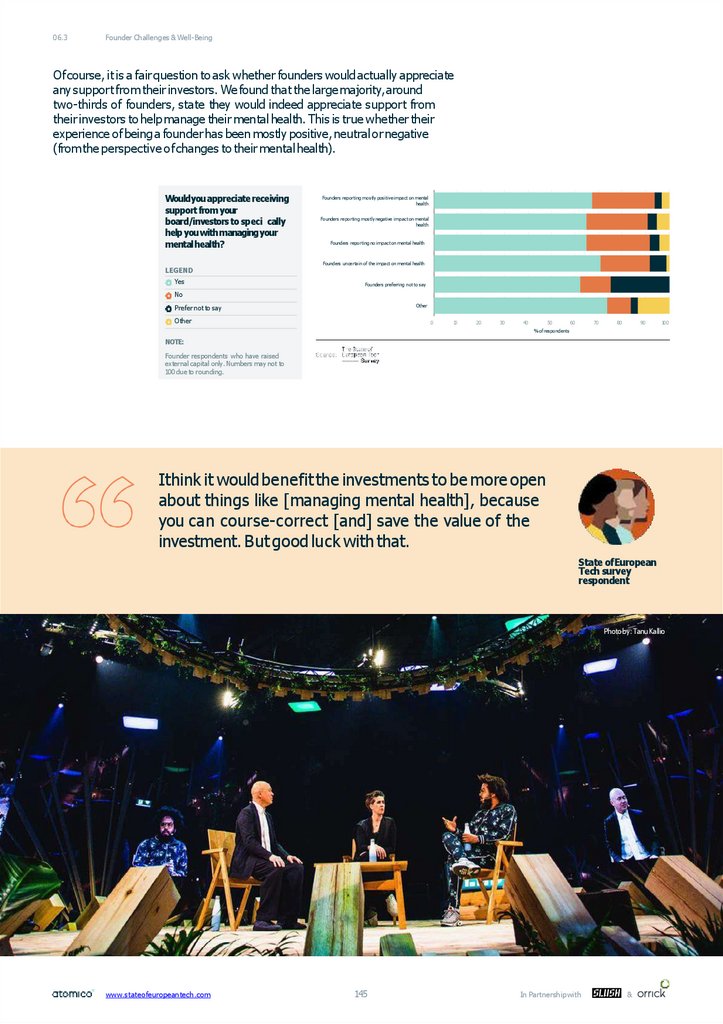
Целых 57% учредителей, которые привлекли внешний
капитал, заявили, что они были бы признательны за
поддержку со стороны Совета директоров или
инвесторов. В других странах есть положительные
стороны : мы обнаружили, что Европейский
профессиональный союз разработчиков по- прежнему
глубже, чем в США (6,1 млн против 4,3 млн), в то
время как на более поздних стадиях европейские
компании сокращают разрыв с США в использовании
фондовых условий для стимулирования инвестиций.
12
In Partnership with
&
13.
02.2Executive Summary
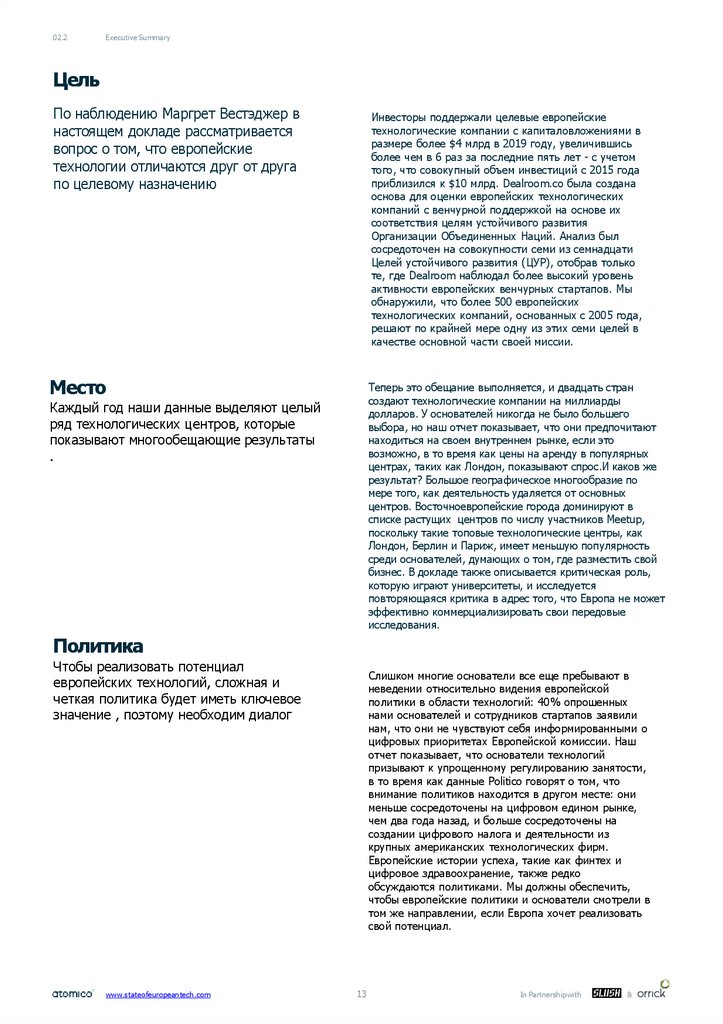
Цель
По наблюдению Маргрет Вестэджер в
настоящем докладе рассматривается
вопрос о том, что европейские
технологии отличаются друг от друга
по целевому назначению
Инвесторы поддержали целевые европейские
технологические компании с капиталовложениями в
размере более $4 млрд в 2019 году, увеличившись
более чем в 6 раз за последние пять лет - с учетом
того, что совокупный объем инвестиций с 2015 года
приблизился к $10 млрд. Dealroom.co была создана
основа для оценки европейских технологических
компаний с венчурной поддержкой на основе их
соответствия целям устойчивого развития
Организации Объединенных Наций. Анализ был
сосредоточен на совокупности семи из семнадцати
Целей устойчивого развития (ЦУР), отобрав только
те, где Dealroom наблюдал более высокий уровень
активности европейских венчурных стартапов. Мы
обнаружили, что более 500 европейских
технологических компаний, основанных с 2005 года,
решают по крайней мере одну из этих семи целей в
качестве основной части своей миссии.
Место
Теперь это обещание выполняется, и двадцать стран
создают технологические компании на миллиарды
долларов. У основателей никогда не было большего
выбора, но наш отчет показывает, что они предпочитают
находиться на своем внутреннем рынке, если это
возможно, в то время как цены на аренду в популярных
центрах, таких как Лондон, показывают спрос.И каков же
результат? Большое географическое многообразие по
мере того, как деятельность удаляется от основных
центров. Восточноевропейские города доминируют в
списке растущих центров по числу участников Meetup,
поскольку такие топовые технологические центры, как
Лондон, Берлин и Париж, имеет меньшую популярность
среди основателей, думающих о том, где разместить свой
бизнес. В докладе также описывается критическая роль,
которую играют университеты, и исследуется
повторяющаяся критика в адрес того, что Европа не может
эффективно коммерциализировать свои передовые
исследования.
Каждый год наши данные выделяют целый
ряд технологических центров, которые
показывают многообещающие результаты
.
Политика
Чтобы реализовать потенциал
европейских технологий, сложная и
четкая политика будет иметь ключевое
значение , поэтому необходим диалог
www.stateofeuropeantech.com
Слишком многие основатели все еще пребывают в
неведении относительно видения европейской
политики в области технологий: 40% опрошенных
нами основателей и сотрудников стартапов заявили
нам, что они не чувствуют себя информированными о
цифровых приоритетах Европейской комиссии. Наш
отчет показывает, что основатели технологий
призывают к упрощенному регулированию занятости,
в то время как данные Politico говорят о том, что
внимание политиков находится в другом месте: они
меньше сосредоточены на цифровом едином рынке,
чем два года назад, и больше сосредоточены на
создании цифрового налога и деятельности из
крупных американских технологических фирм.
Европейские истории успеха, такие как финтех и
цифровое здравоохранение, также редко
обсуждаются политиками. Мы должны обеспечить,
чтобы европейские политики и основатели смотрели в
том же направлении, если Европа хочет реализовать
свой потенциал.
13
In Partnership with
&
14.
02.2Executive Summary
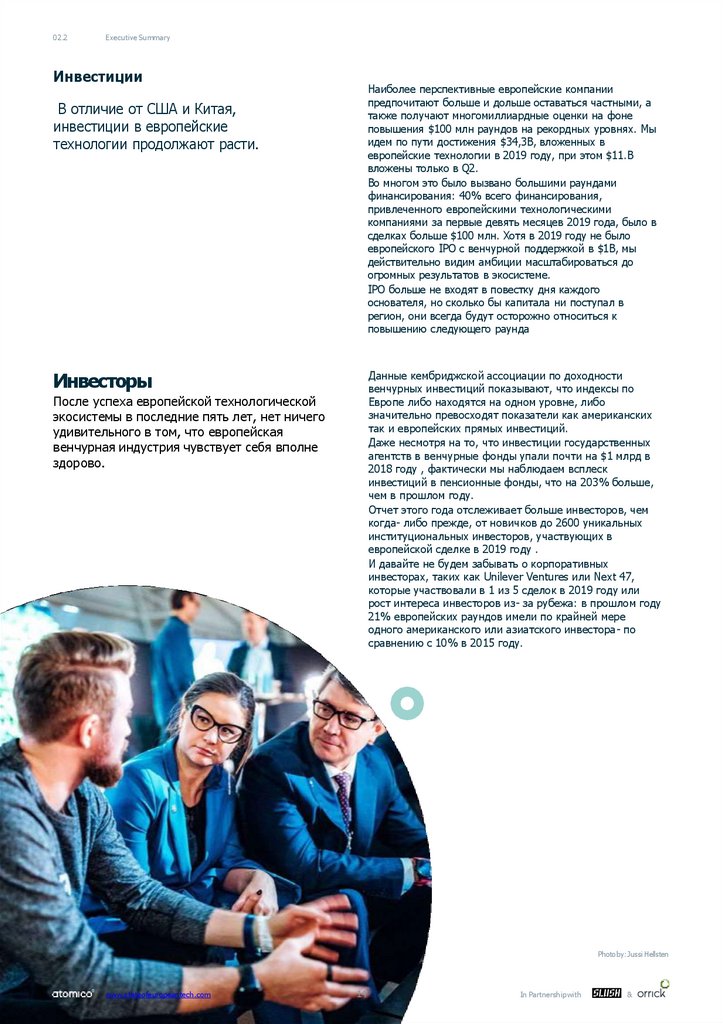
Инвестиции
Наиболее перспективные европейские компании
предпочитают больше и дольше оставаться частными, а
также получают многомиллиардные оценки на фоне
повышения $100 млн раундов на рекордных уровнях. Мы
идем по пути достижения $34,3B, вложенных в
европейские технологии в 2019 году, при этом $11.B
вложены только в Q2.
Во многом это было вызвано большими раундами
финансирования: 40% всего финансирования,
привлеченного европейскими технологическими
компаниями за первые девять месяцев 2019 года, было в
сделках больше $100 млн. Хотя в 2019 году не было
европейского IPO с венчурной поддержкой в $1B, мы
действительно видим амбиции масштабироваться до
огромных результатов в экосистеме.
IPO больше не входят в повестку дня каждого
основателя, но сколько бы капитала ни поступал в
регион, они всегда будут осторожно относиться к
повышению следующего раунда
В отличие от США и Китая,
инвестиции в европейские
технологии продолжают расти.
Данные кембриджской ассоциации по доходности
венчурных инвестиций показывают, что индексы по
Европе либо находятся на одном уровне, либо
значительно превосходят показатели как американских
так и европейских прямых инвестиций.
Даже несмотря на то, что инвестиции государственных
агентств в венчурные фонды упали почти на $1 млрд в
2018 году , фактически мы наблюдаем всплеск
инвестиций в пенсионные фонды, что на 203% больше,
чем в прошлом году.
Отчет этого года отслеживает больше инвесторов, чем
когда- либо прежде, от новичков до 2600 уникальных
институциональных инвесторов, участвующих в
европейской сделке в 2019 году .
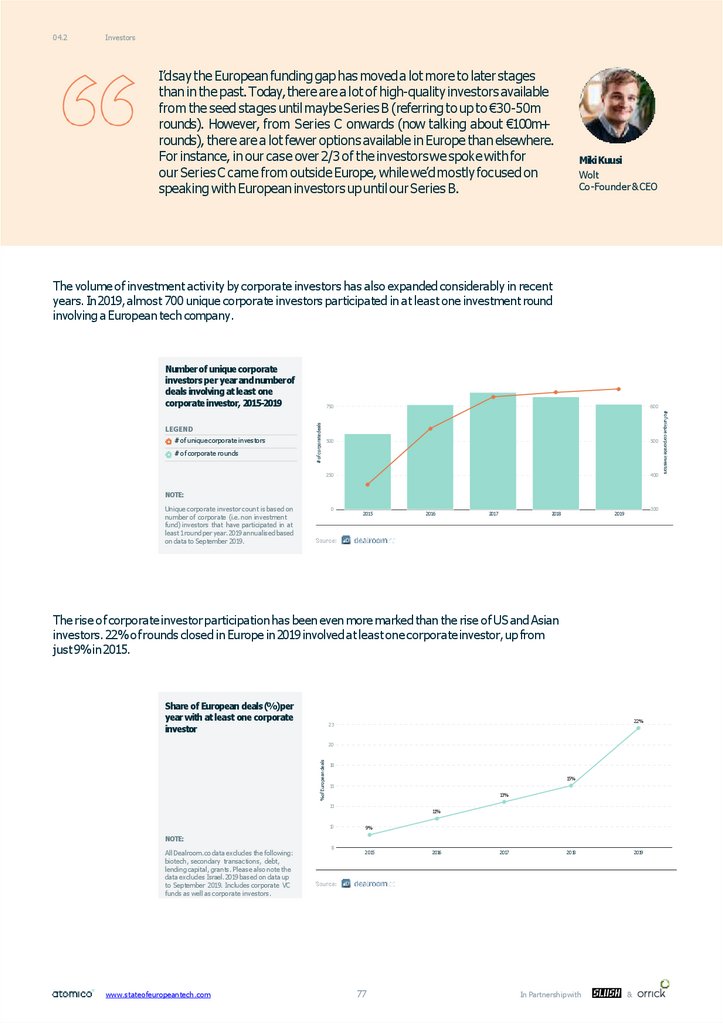
И давайте не будем забывать о корпоративных
инвесторах, таких как Unilever Ventures или Next 47,
которые участвовали в 1 из 5 сделок в 2019 году или
рост интереса инвесторов из- за рубежа: в прошлом году
21% европейских раундов имели по крайней мере
одного американского или азиатского инвестора- по
сравнению с 10% в 2015 году.
Инвесторы
После успеха европейской технологической
экосистемы в последние пять лет, нет ничего
удивительного в том, что европейская
венчурная индустрия чувствует себя вполне
здорово.
Photoby:Jussi Hellsten
www.stateofeuropeantech.com
14
In Partnership with
&
15. 02.3 Компания Slush
Мы считаем, что предпринимательство - это один из самыхэффективных способов добиться перемен в мире. Согласно данным
опроса этого года, в Европе уже сейчас большинство предпринимателей
и особенно инвесторов стремятся измерить долгосрочное воздействие на
общество и окружающую среду, которое оказывает их бизнес или
портфель. Пятикратный рост инвестиций в специализированные
предприятия за последние пять лет в Европе говорит на том же языке.
Только в 2019 году в этих компаниях было развернуто более $ 5 млрд.
Это событие несомненно радует и мы видим, что Европа может занять
место лидера во всем мире.
Однако Европа только начинает осознавать тот факт, что
предпринимательство не является одинаково доступным для всех. И для
того, чтобы увидеть разного рода проблемы, нужны разные люди. Slush
по- прежнему стремится освещать более широкий спектр ролевых
моделей для следующего поколения основателей через наши
мероприятия и недавно запущенные средства массовой информации .
Учитывая эти достижения, рекордные инвестиции в европейские
технологии- это явный признак динамичной экосистемы. Одним из
наиболее обнадеживающих событий является рост
предпринимательских амбиций, о чем свидетельствует количество
инвестиционных раундов на поздних стадиях: европейские компании
больше не продают свои активы на ранних сроках , а продолжают расти
как самостоятельные предприятия. Это создает надежду на
исключительно положительные времена, когда основатели и ключевые
сотрудники этих историй успеха начинают свой второй этап построения
компании.
AndreasSaari
CEO, Slush
www.stateofeuropeantech.com
15
In Partnership with
&
16. 02.4 Компания Orrick
Технологии-это двигатель европейского роста, как ясно видно из отчета о состоянииевропейских технологий в этом году. Технологическая экосистема Европы хорошо
налажена и устойчива, с рекордным финансированием, опытными основателями и
инвесторами, а также ускоряющимся ростом. Европейские технологические компании,
скорее всего, достигнут $34 млрд финансирования в 2019 году, по сравнению с $25
млрд в 2018 году. За последние пять лет объем финансирования увеличился более чем
вдвое. Это включает в себя более 40 $100 млн сделок в этом году – больше, чем когдалибо прежде. ПО всей Европе сейчас насчитывается 174 $ млрд+ технологических
единорогов. В 2010 году их было всего 18 – Это в 10 раз больше, чем за последние
десять лет. А в 20 странах сейчас есть по крайней мере один единорог, вдвое больше,
чем всего пять лет назад. Сегодня в 170 городах есть технологические сообщества, по
сравнению с 70 четыре года назад. Хотя в этом году число сделок по слияниям и
поглощениям сократилось, за последние пять лет их было в два раза больше, чем за
предыдущие пять лет. А стоимость сделки по слияниям и поглощениям уже близка к
тому, чтобы превысить прошлогоднюю сумму в $100 млрд.
Что потребуется для поддержания успеха Европы? В докладе говорится о четырех
вещах:
Европейская комиссия должна
уточнить свои приоритеты в области
регулирования.
Развитие технологий по-прежнему опережает
регулирование. Отчет демонстрирует, что искусственный
интеллект это верх ума для регулирующих органов. Тем
не менее 40% респондентов опроса сообщили, что они не
чувствуют себя достаточно информированными, чтобы
комментировать технологические и цифровые приоритеты
регулирования ЕС. Мы видели большие преимущества
сотрудничества в области разработки стратегии–
например, в области Британских финансовых рынках– но
оно начинается с большей прозрачности государства.
Мы также призываем директивные органы рассмотреть
возможности упрощения и рационализации требований к
соблюдению требований, увеличивая нагрузку по мере
расширения компании (и риска). Это особенно важно в
сфере регулирования занятости. В противном случае мы
рискуем возложить непомерное бремя на стартапы – и
задушить их способность расти, внедрять инновации и
создавать те самые рабочие места .
Поменять отношение к ценности
интеграции; за этим должны
следовать инвестиции
Интеграция по- прежнему является сложной задачей для
данного сектора, поскольку только 8% финансирования
приходится на компании, возглавляемые смешанными
гендерными и женскими командами. Однако на уровне
компании более 40% членов команды видят улучшение. В
докладе также отмечается, что более половины
инвесторов и сотрудников стартапов до сих пор не имели
преимуществ от неосознанных предубеждений.
Социальная наука не оставляет никаких сомнений в том,
что более инклюзивное лидерство будет порождать
больше инноваций и отдачи.
www.stateofeuropeantech.com
16
In Partnership with
&
17.
02.4A word from Orrick
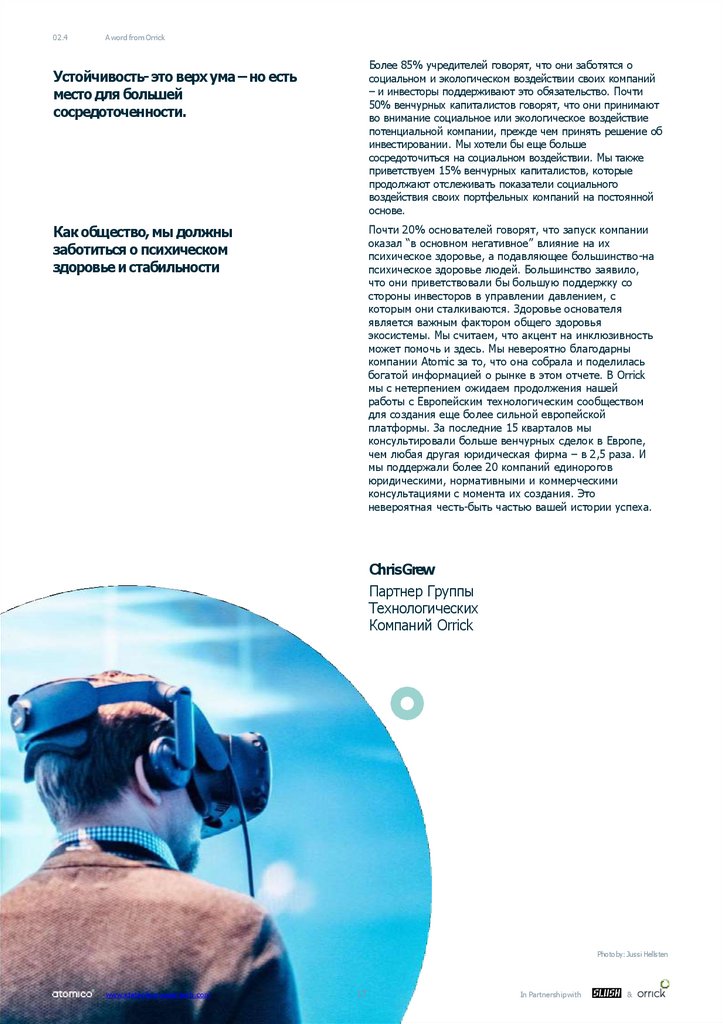
Более 85% учредителей говорят, что они заботятся о
социальном и экологическом воздействии своих компаний
– и инвесторы поддерживают это обязательство. Почти
50% венчурных капиталистов говорят, что они принимают
во внимание социальное или экологическое воздействие
потенциальной компании, прежде чем принять решение об
инвестировании. Мы хотели бы еще больше
сосредоточиться на социальном воздействии. Мы также
приветствуем 15% венчурных капиталистов, которые
продолжают отслеживать показатели социального
воздействия своих портфельных компаний на постоянной
основе.
Устойчивость- это верх ума – но есть
место для большей
сосредоточенности.
Как общество, мы должны
заботиться о психическом
здоровье и стабильности
Почти 20% основателей говорят, что запуск компании
оказал “в основном негативное” влияние на их
психическое здоровье, а подавляющее большинство-на
психическое здоровье людей. Большинство заявило,
что они приветствовали бы большую поддержку со
стороны инвесторов в управлении давлением, с
которым они сталкиваются. Здоровье основателя
является важным фактором общего здоровья
экосистемы. Мы считаем, что акцент на инклюзивность
может помочь и здесь. Мы невероятно благодарны
компании Atomic за то, что она собрала и поделилась
богатой информацией о рынке в этом отчете. В Orrick
мы с нетерпением ожидаем продолжения нашей
работы с Европейским технологическим сообществом
для создания еще более сильной европейской
платформы. За последние 15 кварталов мы
консультировали больше венчурных сделок в Европе,
чем любая другая юридическая фирма – в 2,5 раза. И
мы поддержали более 20 компаний единорогов
юридическими, нормативными и коммерческими
консультациями с момента их создания. Это
невероятная честь-быть частью вашей истории успеха.
ChrisGrew
Партнер Группы
Технологических
Компаний Orrick
Photoby:Jussi Hellsten
www.stateofeuropeantech.com
17
In Partnership with
&
18. Инвестиции
03Инвестиции
Сколько венчурные капиталисты вкладывают в
европейские технологии?
Как вы оцениваете доходность европейских технологий?
Европейские учредители ищут лучшего времени в истории
региона, чтобы получить финансирование; они собрали
рекордную сумму в 2019 году, включая в себя рекордное
количество раундов на $100 млн, что европейские
технические скептики когда-то считали невозможным.
www.stateofeuropeantech.com
18
In Partnership with
&
19. 03.1 Инвестиционный кадр
В отличие от США и Азии, где инвесторыотступили от рекордного уровня инвестиций
в 2018 году , инвестиции в европейские
технологии продолжают расти. Несмотря на
снижение в США в 2019 году , объем
инвестированного в США капитала все
равно окажется примерно в 3,4 раза выше
уровня Европы за год.
$34.3
млрд
125.0
Venture capitalinvested(SB)
Инвестированный капитал
($млрд) в Европе, США и Азия
по годам
КАПИТАЛ, ИНВЕСТИРОВАННЫЙ В ЕВРОПУ
За последние пять лет объем
капиталовложений в Европу
увеличился на 124%. С 2018 года
это число выросло более чем на
39%.
S118.2BS116.7B
S117.8B
100.0
S85.5B
S79.8B
75.0
S62.5B
S49.0B
50.0
S66.4B
S71.5B
S52.8B
S34.3B
25.0
0.0
S22.6B S24.6B
S15.3B S16.5B
2015 2016 20172018 2019
2015 2016 20172018 2019
2015 2016 20172018 2019
Европа
Азия
США
Капитал, инвестированный во втором
квартале 2019 года
Во втором квартале 2019 года впервые за один
квартал в европейские технологические
компании было инвестировано более $10 млрд.
За первые девять месяцев текущего года
европейские технологические компании
привлекли в среднем около $ 3,3 млрд в месяц.
$11.6
МЛРД
LEGEND
# of deals
Примечание:
12.5
1,800.0
10.0
1,600.0
7.5
1,400.0
5.0
1,200.0
2.5
1,000.0
0.0
800.0
Dealroom.co исключают следующие
данные: биотехнологии, вторичные
сделки, долги, кредиты, гранты.
Обратите также внимание, что эти
данные не включают Израиль.
www.stateofeuropeantech.com
19
In Partnership with
&
# ofdeals
Capital invested ($B)
Capital invested ($B)
Инвестированный капитал
($млрд) и количество сделок
за квартал
Во втором квартале 2019 года
наблюдался самый большой в
истории период для капитала,
инвестированного в
европейские технологические
компании.
20.
03.1Investment Snapshot
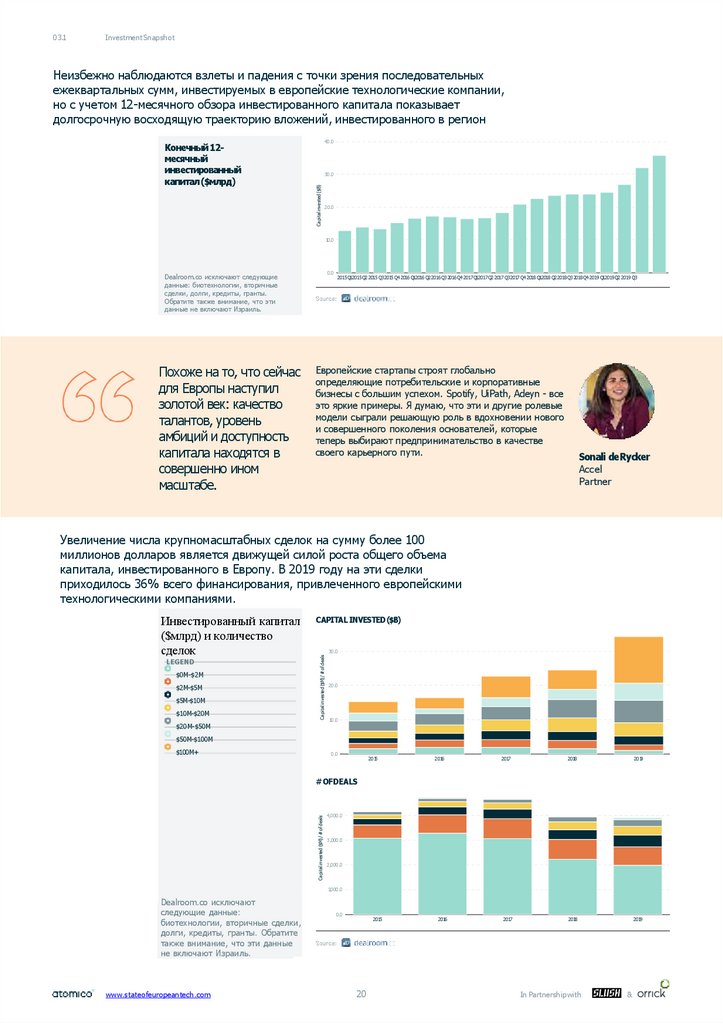
Неизбежно наблюдаются взлеты и падения с точки зрения последовательных
ежеквартальных сумм, инвестируемых в европейские технологические компании,
но с учетом 12-месячного обзора инвестированного капитала показывает
долгосрочную восходящую траекторию вложений, инвестированного в регион
40.0
30.0
Capital invested ($B)
Конечный 12месячный
инвестированный
капитал ($млрд)
20.0
10.0
0.0
Dealroom.co исключают следующие
данные: биотехнологии, вторичные
сделки, долги, кредиты, гранты.
Обратите также внимание, что эти
данные не включают Израиль.
Похоже на то, что сейчас
для Европы наступил
золотой век: качество
талантов, уровень
амбиций и доступность
капитала находятся в
совершенно ином
масштабе.
2015 Q12015 Q2 2015 Q3 2015 Q4 2016 Q12016 Q2 2016 Q3 2016 Q4 2017 Q12017 Q2 2017 Q3 2017 Q4 2018 Q12018 Q2 2018 Q3 2018 Q4 2019 Q12019 Q2 2019 Q3
Европейские стартапы строят глобально
определяющие потребительские и корпоративные
бизнесы с большим успехом. Spotify, UiPath, Adeyn - все
это яркие примеры. Я думаю, что эти и другие ролевые
модели сыграли решающую роль в вдохновении нового
и совершенного поколения основателей, которые
теперь выбирают предпринимательство в качестве
своего карьерного пути.
Sonali deRycker
Accel
Partner
Увеличение числа крупномасштабных сделок на сумму более 100
миллионов долларов является движущей силой роста общего объема
капитала, инвестированного в Европу. В 2019 году на эти сделки
приходилось 36% всего финансирования, привлеченного европейскими
технологическими компаниями.
LEGEND
$0M-$2M
$2M-$5M
$5M-$10M
$10M-$20M
CAPITAL INVESTED($B)
30.0
Capital invested ($M) / #of deals
Инвестированный капитал
($млрд) и количество
сделок
$20M-$50M
20.0
10.0
$50M-$100M
$100M+
0.0
2015
2016
2017
2018
2019
2018
2019
Capital invested ($M) / #of deals
#OFDEALS
4,000.0
3,000.0
2,000.0
1,000.0
Dealroom.co исключают
следующие данные:
биотехнологии, вторичные сделки,
долги, кредиты, гранты. Обратите
также внимание, что эти данные
не включают Израиль.
www.stateofeuropeantech.com
0.0
2015
20
2016
2017
In Partnership with
&
21.
03.1Investment Snapshot
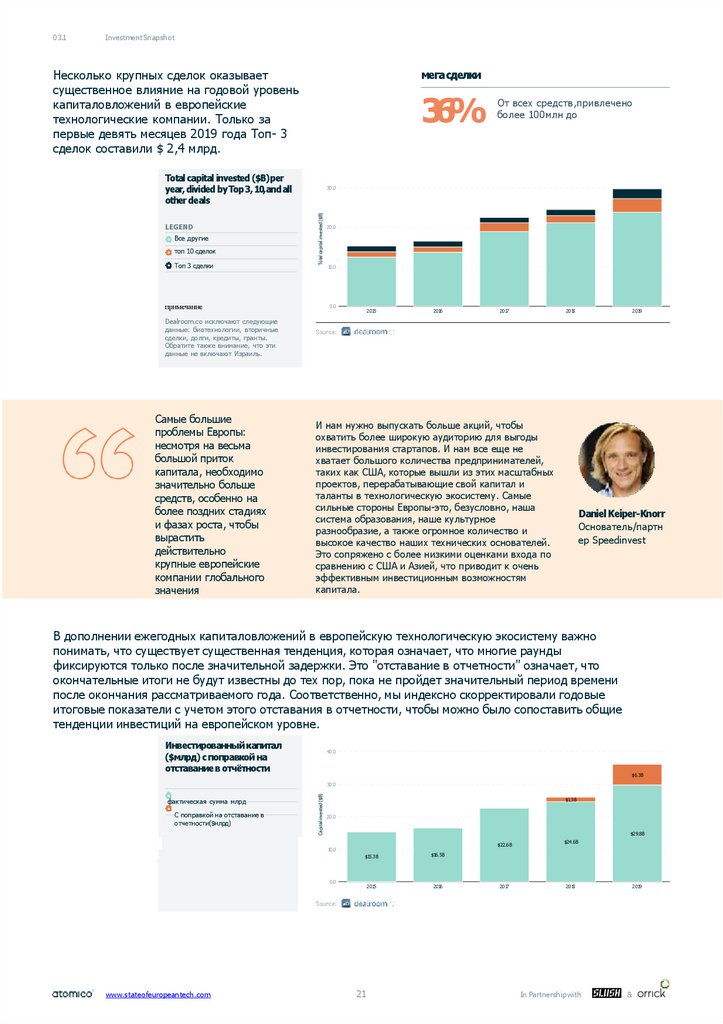
Несколько крупных сделок оказывает
существенное влияние на годовой уровень
капиталовложений в европейские
технологические компании. Только за
первые девять месяцев 2019 года Топ- 3
сделок составили $ 2,4 млрд.
мега сделки
36%
Total capital invested ($B)per
year, divided by Top 3, 10,and all
other deals
Все другие
топ 10 сделок
Топ 3 сделки
30.0
Total capital invested ($B)
LEGEND
От всех средств,привлечено
более 100млн до
примечание
20.0
10.0
0.0
2015
2016
2017
2018
2019
Dealroom.co исключают следующие
данные: биотехнологии, вторичные
сделки, долги, кредиты, гранты.
Обратите также внимание, что эти
данные не включают Израиль.
Самые большие
проблемы Европы:
несмотря на весьма
большой приток
капитала, необходимо
значительно больше
средств, особенно на
более поздних стадиях
и фазах роста, чтобы
вырастить
действительно
крупные европейские
компании глобального
значения
И нам нужно выпускать больше акций, чтобы
охватить более широкую аудиторию для выгоды
инвестирования стартапов. И нам все еще не
хватает большого количества предпринимателей,
таких как США, которые вышли из этих масштабных
проектов, перерабатывающие свой капитал и
таланты в технологическую экосистему. Самые
сильные стороны Европы-это, безусловно, наша
система образования, наше культурное
разнообразие, а также огромное количество и
высокое качество наших технических основателей.
Это сопряжено с более низкими оценками входа по
сравнению с США и Азией, что приводит к очень
эффективным инвестиционным возможностям
капитала.
Daniel Keiper-Knorr
Основатель/партн
ер Speedinvest
В дополнении ежегодных капиталовложений в европейскую технологическую экосистему важно
понимать, что существует существенная тенденция, которая означает, что многие раунды
фиксируются только после значительной задержки. Это "отставание в отчетности" означает, что
окончательные итоги не будут известны до тех пор, пока не пройдет значительный период времени
после окончания рассматриваемого года. Соответственно, мы индексно скорректировали годовые
итоговые показатели с учетом этого отставания в отчетности, чтобы можно было сопоставить общие
тенденции инвестиций на европейском уровне.
Инвестированный капитал
($млрд) с поправкой на
отставание в отчётности
40.0
$6.3B
фактическая сумма млрд
С поправкой на отставание в
отчетности($млрд)
Capital invested ($B)
30.0
$1.3B
20.0
$29.8B
$22.6B
10.0
$15.3B
$16.5B
2015
2016
0.0
www.stateofeuropeantech.com
21
2017
$24.6B
2018
In Partnership with
2019
&
22.
03.1Investment Snapshot
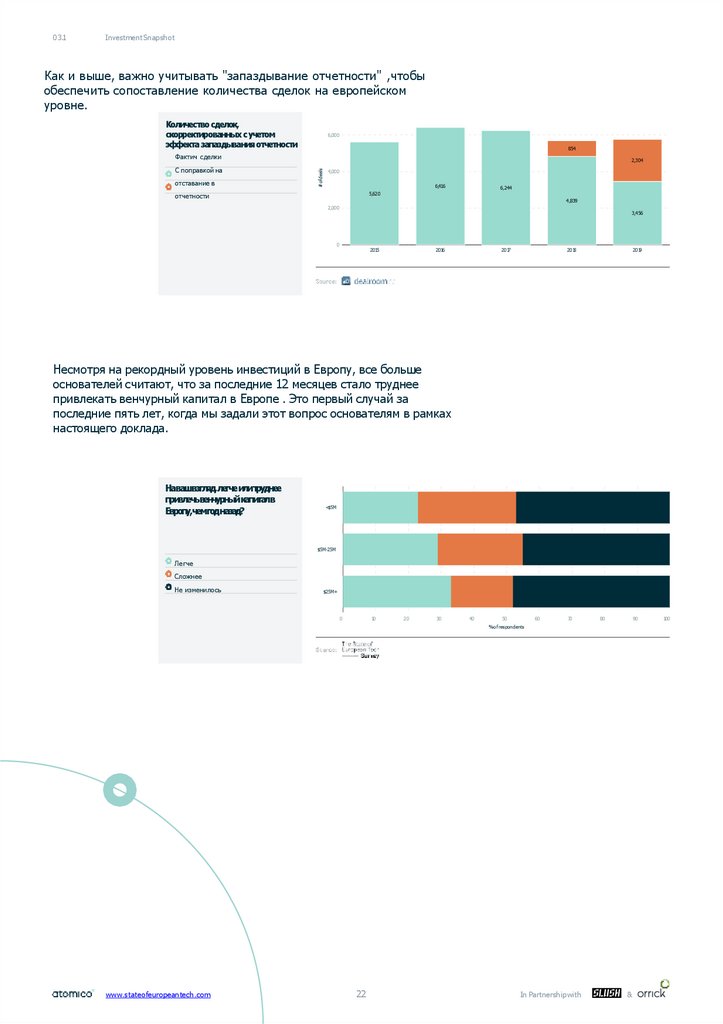
Как и выше, важно учитывать "запаздывание отчетности" ,чтобы
обеспечить сопоставление количества сделок на европейском
уровне.
Количество сделок,
скорректированных с учетом
эффекта запаздывания отчетности
6,000
854
Фактич сделки
отставание в
2,304
# ofdeals
С поправкой на
4,000
6,416
6,244
5,620
отчетности
4,839
2,000
3,456
0
2015
2016
2017
2018
2019
Несмотря на рекордный уровень инвестиций в Европу, все больше
основателей считают, что за последние 12 месяцев стало труднее
привлекать венчурный капитал в Европе . Это первый случай за
последние пять лет, когда мы задали этот вопрос основателям в рамках
настоящего доклада.
Навашвзгляд,легчеилитруднее
привлечьвенчурныйкапиталв
Европу,чемгодназад?
<$5M
$5M-25M
Легче
Сложнее
Не изменилось
$25M+
0
10
20
30
40
50
60
70
80
90
% of respondents
www.stateofeuropeantech.com
22
In Partnership with
&
100
23.
03.1Investment Snapshot
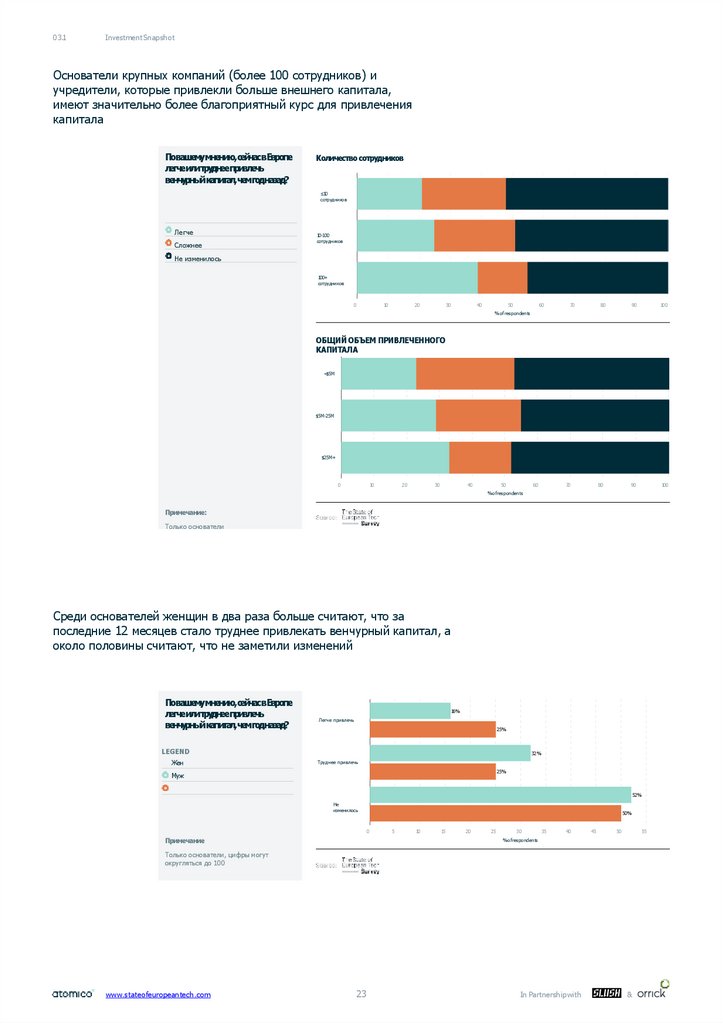
Основатели крупных компаний (более 100 сотрудников) и
учредители, которые привлекли больше внешнего капитала,
имеют значительно более благоприятный курс для привлечения
капитала
Повашемумнению,сейчасвЕвропе
легчеилитруднеепривлечь
венчурныйкапитал,чемгодназад?
Количество сотрудников
≤10
сотрудников
Легче
Сложнее
10-100
сотрудников
Не изменилось
100+
сотрудников
0
10
20
30
40
50
60
70
80
90
100
90
100
% of respondents
ОБЩИЙ ОБЪЕМ ПРИВЛЕЧЕННОГО
КАПИТАЛА
<$5M
$5M-25M
$25M+
0
10
20
30
40
60
50
70
80
% ofrespondents
Примечание:
Только основатели
Среди основателей женщин в два раза больше считают, что за
последние 12 месяцев стало труднее привлекать венчурный капитал, а
около половины считают, что не заметили изменений
Повашемумнению,сейчасвЕвропе
легчеилитруднеепривлечь
венчурныйкапитал,чемгодназад?
16%
Легче привлечь
25%
LEGEND
Жен
32%
Труднее привлечь
25%
Муж
52%
Не
изменилось
50%
0
Примечание
5
10
15
20
25
30
35
40
45
50
55
% ofrespondents
Только основатели, цифры могут
округляться до 100
www.stateofeuropeantech.com
23
In Partnership with
&
24.
03.1Investment Snapshot
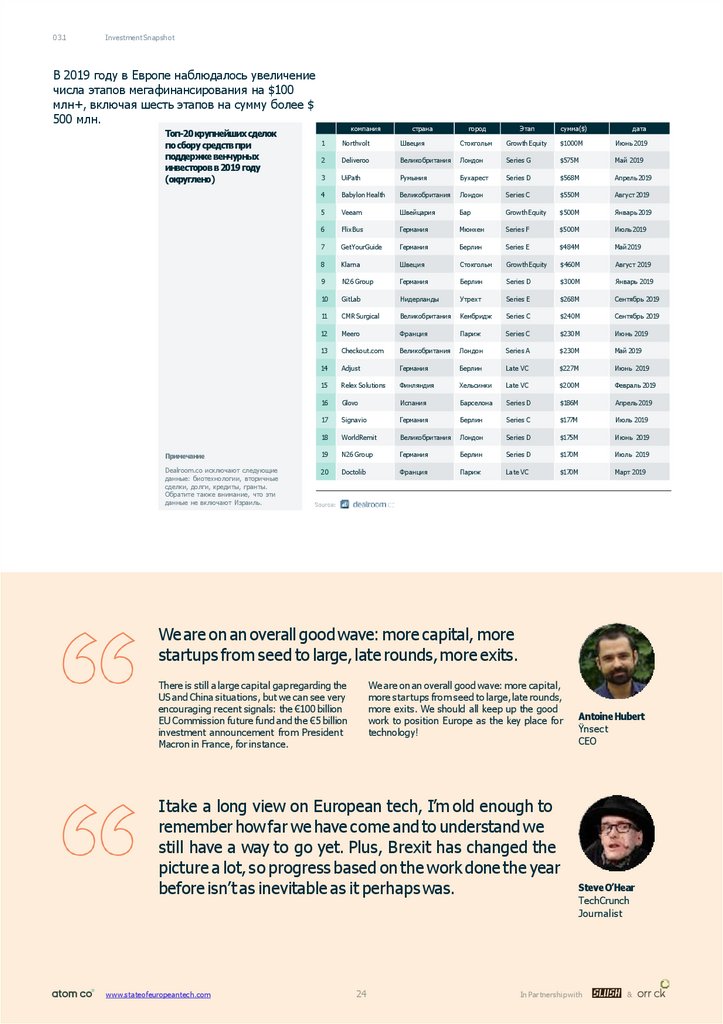
В 2019 году в Европе наблюдалось увеличение
числа этапов мегафинансирования на $100
млн+, включая шесть этапов на сумму более $
500 млн.
Топ-20 крупнейших сделок
по сбору средств при
поддержке венчурных
инвесторов в 2019 году
(округлено)
город
Этап
1
Northvolt
компания
Швеция
страна
Стокгольм
Growth Equity
$1000M
сумма($)
Июнь 2019
дата
2
Deliveroo
Великобритания
Лондон
Series G
$575M
Май 2019
3
UiPath
Румыния
Бухарест
Series D
$568M
Апрель 2019
4
Babylon Health
Великобритания
Лондон
Series C
$550M
Август 2019
5
Veeam
Швейцария
Бар
Growth Equity
$500M
Январь 2019
6
FlixBus
Германия
Мюнхен
Series F
$500M
Июль 2019
7
GetYourGuide
Германия
Берлин
Series E
$484M
Май 2019
8
Klarna
Швеция
Стокгольм
Growth Equity
$460M
Август 2019
9
N26 Group
Германия
Берлин
Series D
$300M
Январь 2019
10
GitLab
Нидерланды
Утрехт
Series E
$268M
Сентябрь 2019
11
CMR Surgical
Великобритания
Кембридж
Series C
$240M
Сентябрь 2019
12
Meero
Франция
Париж
Series C
$230M
Июнь 2019
13
Checkout.com
Великобритания
Лондон
Series A
$230M
Май 2019
14
Adjust
Германия
Берлин
Late VC
$227M
Июнь 2019
15
Relex Solutions
Финляндия
Хельсинки
Late VC
$200M
Февраль 2019
16
Glovo
Испания
Барселона
Series D
$186M
Апрель 2019
17
Signavio
Германия
Берлин
Series C
$177M
Июль 2019
18
WorldRemit
Великобритания
Лондон
Series D
$175M
Июнь 2019
Примечание
19
N26 Group
Германия
Берлин
Series D
$170M
Июль 2019
Dealroom.co исключают следующие
данные: биотехнологии, вторичные
сделки, долги, кредиты, гранты.
Обратите также внимание, что эти
данные не включают Израиль.
20
Doctolib
Франция
Париж
Late VC
$170M
Март 2019
Weare on an overall good wave: more capital, more
startups from seed to large, late rounds,more exits.
There is still a large capital gap regarding the
US and China situations, but we can see very
encouraging recent signals: the €100 billion
EU Commission future fund and the €5 billion
investment announcement from President
Macron in France, for instance.
We are on an overall good wave: more capital,
more startups from seed to large, late rounds,
more exits. We should all keep up the good
work to position Europe as the key place for
technology!
I take a long view on European tech, I’m old enough to
remember how far we have come and to understand we
still have a way to go yet. Plus, Brexit has changed the
picture a lot, so progress based on the work done the year
before isn’t as inevitable as it perhaps was.
www.stateofeuropeantech.com
24
AntoineHubert
Ÿnsect
CEO
SteveO’Hear
TechCrunch
Journalist
In Partnership with
&
25. 03.2 Инвестиции по отраслям
В течение последних пяти лет основнымибенефициарами капитала были финтехкомпании и компании, занимающиеся
корпоративным программным
обеспечением. В целом за последние пять
лет европейские компании только в этих
двух секторах привлекли около $ 50 млрд..
Инвестированный капитал ($млн) по
отраслям промышленности
КАПИТАЛ, ВЛОЖЕННЫЙ В ФИНТЕХ
$25млрд
Инвестировано в
финтехкомпании
2019
Энергетика
Здоровье
up to 10,000
4,000 to 8,000
Транспорт
Финансовые
технологии
2,000 to 4,000
1,500to 2,000
1,000to 1,500
Путешествия
Еда
750 to 1,000
Безопасность
Робототехника
Реклама
500 to 750
200 to 500
Корпоративное
программное
обеспечение
0to 100
up to 0
Интернет
Недвижимость Подбор
персонала
100 to 200
Маркетинг
Образо
Проведение
вание
мероприятий
Мода
Закон
Красота
Дом
Связь
Хостинг
Игры
спорт приборы
музыка
дети
2015-2019
Транспорт
Health
Маркетинг
Еда
Финансовые
технологии
Энергетика
Путешествия
Безопас
ность
Корпоративное
программное
обеспечение
Робототехни
ка
Дом
Игры
Связь
персонал
Интернет
музыка
образов
Реклама
Недвижим
ость
www.stateofeuropeantech.com
Мода
25
приборы
спорт
меропр
In Partnership with
красота закон
&
Дети
26.
03.2Investment by Industry
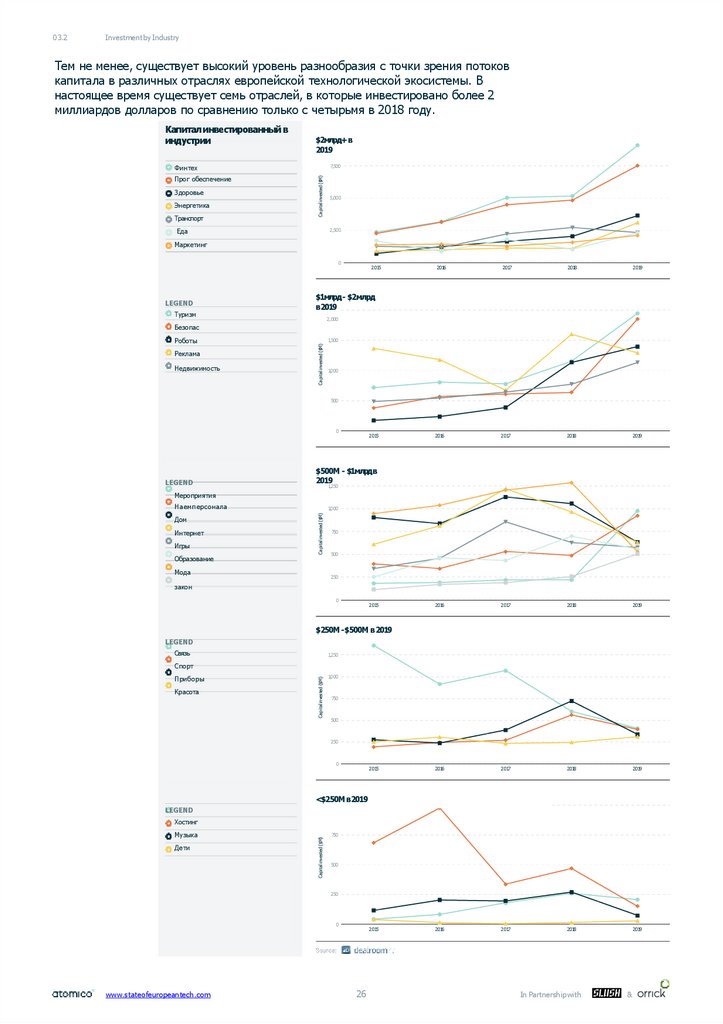
Тем не менее, существует высокий уровень разнообразия с точки зрения потоков
капитала в различных отраслях европейской технологической экосистемы. В
настоящее время существует семь отраслей, в которые инвестировано более 2
миллиардов долларов по сравнению только с четырьмя в 2018 году.
Капитал инвестированный в
индустрии
$2млрд+ в
2019
7,500
Прог обеспечение
Здоровье
Энергетика
Транспорт
Capital invested ($M)
Финтех
Еда
5,000
2,500
Маркетинг
0
LEGEND
Туризм
2015
2016
2017
2018
2019
2016
2017
2018
2019
2016
2017
2018
2019
2015
2016
2017
2018
2019
2015
2016
2017
2018
2019
$1млрд- $2млрд
в2019
2,000
Безопас
Реклама
Недвижимость
1,500
Capital invested ($M)
Роботы
1,000
500
0
LEGEND
2015
$500M - $1млрдв
2019
1,250
Мероприятия
Наемперсонала
Интернет
Игры
1,000
Capital invested ($M)
Дом
Образование
Мода
750
500
250
закон
0
2015
$250M -$500M в2019
LEGEND
Связь
1,250
Приборы
Красота
Capital invested ($M)
Спорт
1,000
750
500
250
0
<$250M в2019
1,000
LEGEND
Музыка
Дети
Capital invested ($M)
Хостинг
750
500
250
0
www.stateofeuropeantech.com
26
In Partnership with
&
27.
03.2Investment by Industry
Я считаю, что сейчас в Европе есть значительные технологические возможности в области финтеха. Более
жесткой макроэкономический подход, отрицательные процентные ставки и более мягкая денежно-кредитная
политика потенциально открывают путь для захватывающих новых бизнес-моделей, поскольку действующие
лица сталкиваются с рисками платежеспособности и продолжают терять позиции перед лицом
разрушительных инноваций. На мой взгляд, это больше, чем платежи, торговля и другие технологии, которые
мы наблюдаем в последние годы, и может означать фундаментальное изменение государственной
финансовой инфраструктуры, включая льготы, налоги и субсидии.
Akshay Naheta
Инвестиционный
Консультант
SoftBank
управляющий
партнер
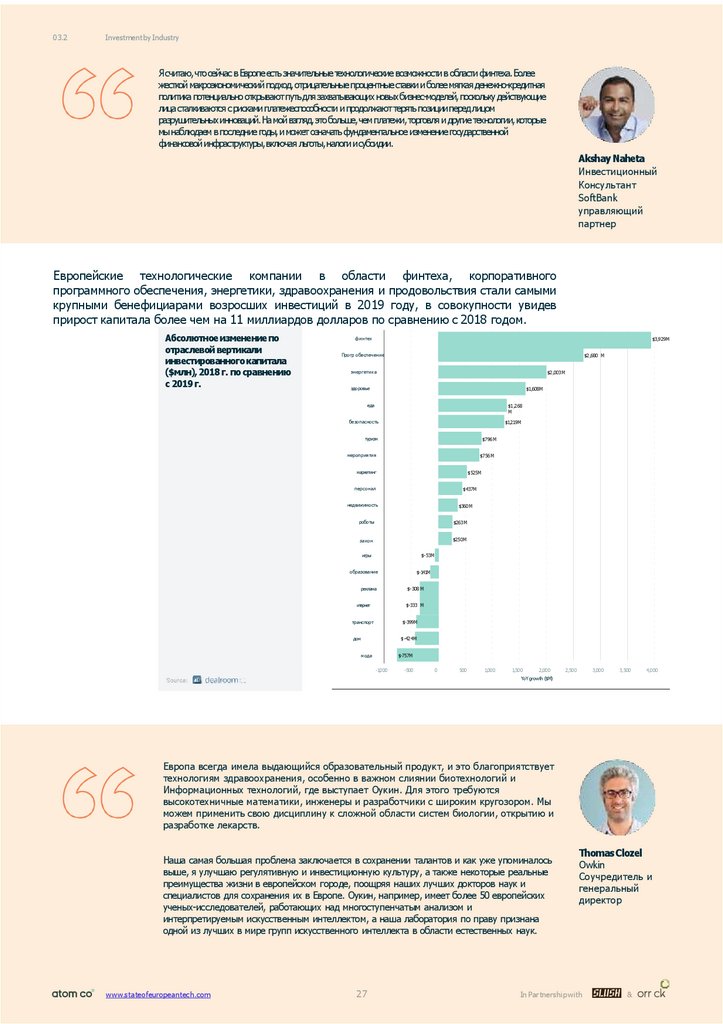
Европейские технологические компании в области финтеха, корпоративного
программного обеспечения, энергетики, здравоохранения и продовольствия стали самыми
крупными бенефициарами возросших инвестиций в 2019 году, в совокупности увидев
прирост капитала более чем на 11 миллиардов долларов по сравнению с 2018 годом.
Абсолютное изменение по
отраслевой вертикали
инвестированного капитала
($млн), 2018 г. по сравнению
с 2019 г.
финтех
$3,929M
Прогр обеспечение
$2,680 M
энергетика
$2,003M
здоровье
$1,608M
еда
$1,268
M
безопасность
$1,219M
туризм
$796M
мероприятия
$756M
маркетинг
$525M
персонал
$437M
недвижимость
$360M
роботы
$263M
$250M
закон
игры
$-53M
образование
реклама
$-141M
$-308 M
$-333 M
итернет
транспорт
$-399M
дом
$-424M
$-757M
мода
-1,000
-500
0
500
1,000
1,500
2,000
2,500
3,000
3,500
4,000
YoYgrowth ($M)
Европа всегда имела выдающийся образовательный продукт, и это благоприятствует
технологиям здравоохранения, особенно в важном слиянии биотехнологий и
Информационных технологий, где выступает Оукин. Для этого требуются
высокотехничные математики, инженеры и разработчики с широким кругозором. Мы
можем применить свою дисциплину к сложной области систем биологии, открытию и
разработке лекарств.
Наша самая большая проблема заключается в сохранении талантов и как уже упоминалось
выше, я улучшаю регулятивную и инвестиционную культуру, а также некоторые реальные
преимущества жизни в европейском городе, поощряя наших лучших докторов наук и
специалистов для сохранения их в Европе. Оукин, например, имеет более 50 европейских
ученых-исследователей, работающих над многоступенчатым анализом и
интерпретируемым искусственным интеллектом, а наша лаборатория по праву признана
одной из лучших в мире групп искусственного интеллекта в области естественных наук.
www.stateofeuropeantech.com
27
ThomasClozel
Owkin
Соучредитель и
генеральный
директор
In Partnership with
&
28.
03.2Investment by Industry
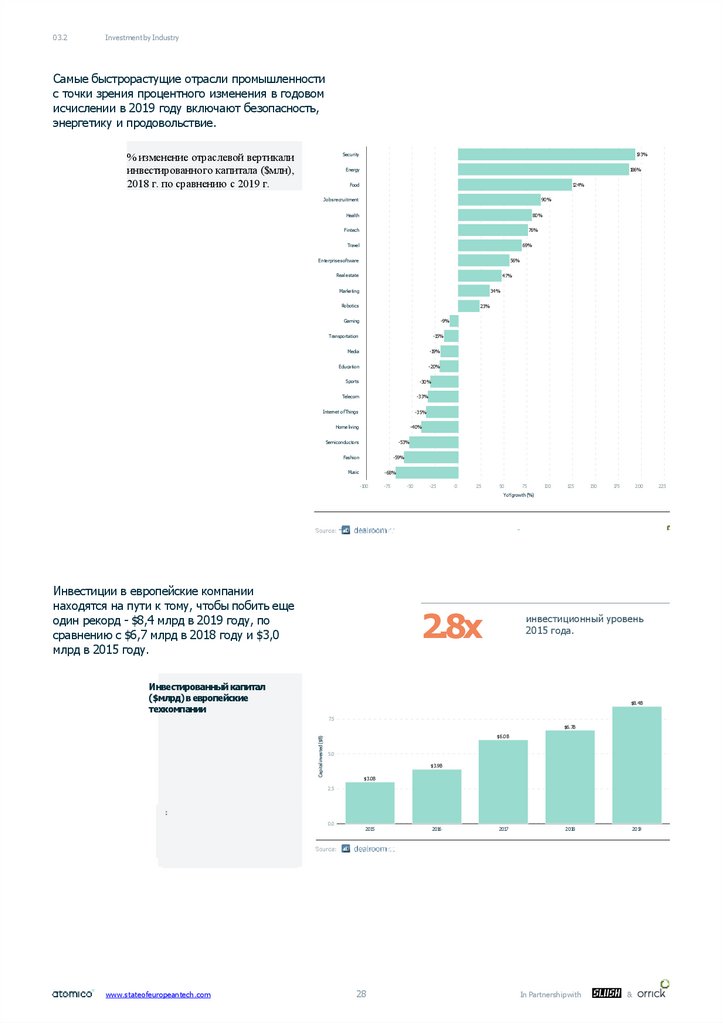
Самые быстрорастущие отрасли промышленности
с точки зрения процентного изменения в годовом
исчислении в 2019 году включают безопасность,
энергетику и продовольствие.
% изменение отраслевой вертикали
инвестированного капитала ($млн),
2018 г. по сравнению с 2019 г.
193%
Security
186%
Energy
124%
Food
90%
Jobs recruitment
80%
Health
76%
Fintech
Travel
69%
Enterprisesoftware
56%
Real estate
47%
Marketing
34%
Robotics
23%
-9%
Gaming
-15%
Transportation
-19%
Media
-20%
Education
Sports
-30%
Telecom
-33%
Internet ofThings
-35%
Home living
-40%
Semiconductors
-53%
Fashion
-59%
Music
-68%
-100
-75
-50
-25
0
25
50
75
100
125
150
175
200
YoYgrowth (%)
Инвестиции в европейские компании
находятся на пути к тому, чтобы побить еще
один рекорд - $8,4 млрд в 2019 году, по
сравнению с $6,7 млрд в 2018 году и $3,0
млрд в 2015 году.
2.8x
инвестиционный уровень
2015 года.
Инвестированный капитал
($млрд) в европейские
техкомпании
$8.4B
7.5
Capital invested ($B)
$6.7B
$6.0B
5.0
$3.9B
$3.0B
2.5
:
0.0
www.stateofeuropeantech.com
2015
28
2016
2017
2018
In Partnership with
2019
&
225
29.
03.2Investment by Industry
По всей Европе наблюдается сильный рост капитала для компаний, занимающихся
сложными технологиями....тем не менее, объем инвестированного капитала все еще
не является репрезентативным для качества и потенциальной стоимости потока
сделок в Европе.
Существует сильное увеличение капитала для глубинных
технологических компаний по всей Европе. (Глубинные
технологии — это уникальные, дифференцированные, часто
защищенные патентами или трудно поддающиеся копированию
технологические или научные достижения). Такие компании, как
Insect, cam или AMSilk, использование конвергентных
технологии для создания реальных ценностей в крупных,
глобальных и сложных отраслях промышленности. Признавая
эти возможности, инвесторы (и покупатели) из Европы и из-за
рубежа инвестируют в европейские активы глубинные
технологии (большинство приобретений в США теперь
приходится на компании глубинной технологии ). В то же
время создается новое поколение политиков ЕС, стремящихся
сохранить “технологический суверенитет", что помогает
снизить риск инвестиций в эти предприятия.
Тем не менее, объем инвестированного капитала
все еще не является репрезентативным для
качества и потенциальной стоимости потока
сделок в Европе. Этот дисбаланс особенно
бросается в глаза, когда вы рассматриваете
размер
рыночных
возможностей,
которые
преследуют эти компании, таких как мясо ($1
трлн), строительство ($10 трлн) или чистая
энергия ($2,5 трлн). Иными словами, капитал
остается неравномерно распределенным по всему
спектру возможностей. Две основные причины
такого " дефицита финансирования” (1) многие
венчурные инвесторы не имеют необходимых
экспертных знаний и структур для оценки и
поддержки этих компаний, и (2) некоторые
исторические
атрибуты
более
глубоких
технологических инвестиций (время выхода на
рынок, капиталоемкость...) все еще мешают
инвесторам, даже если они не применимы ко всем
типам глубоких технологических компаний.
Искусственный интеллект доминирует над капиталом,
вложенным в глубинные технологии, в то время как
квантовый еще не сделал своего скачка в Европе. В 2019
году европейские компании, отнесенные к категории
компаний "искусственного интеллекта", привлекли почти
$5 млрд-самую крупную отдельную подкатегорию.
Капитал, вложенный в
глубинные технологии
Искуств.интеллект
$1249M
Данные
комп зрение
роботы
нанотехнол.
Блокчейн
поиск
интернет
Оборудов.
Прогноз.анализ
$1053M
$468M
$160M
3D
Обучение
Прогр обесп
дроны
приборы
Вирт ре
радары
речь
квантум
Количество сделок
Капитал, инвестированный в 2019
году в европейские
технологические компании,
классифицированные как компании
искусственного интеллекта.
$1750M
$1025M
$2947M
$1267M
$3252M
$1892M
$4884M
$2577M
$543M
$232M
$605M
$376M
$1052M
$1548M
$1391M
$586M
$220M
$748M
$885M
$1050M
$353M
$684M
$377M
$585M
$1246M
$1011M
$235M
$1098M
$805M
$851M
$433M
$1072M
$1381M
$307M
$379M
$409M
$366M
$563M
$562M
$347M
$81M
$163M
$130M
$233M
$314M
$719M
$327M
$283M
$320M
$202M
$89M
$213M
$237M
$146M
$183M
$319M
$163M
$303M
$677M
$157M
$557M
$256M
$164M
$259M
$252M
$272M
$131M
$116M
$75M
$88M
$124M
$88M
$50M
2015
$0M
2016
$10M
2017
$10M
2018
$112M
$20M
2019
$351M
$89M
$622M
$696M
$793M
$330M
$846M
$700M
$684M
$626M
$600M
$148M
$135M
603
780
839
716
451
Данные
395
416
432
303
175
комп зрение
роботы
нанотехно
317
379
367
246
128
87
112
163
191
103
367
282
225
83
Блокчейн
124
151
164
144
76
поиск
интернет
Оборудов.
166
167
157
121
75
175
163
150
93
73
Прогноз.анализ
202
201
186
145
71
106
135
129
126
64
97
103
105
72
45
48
73
98
53
44
79
105
115
61
33
93
114
83
73
31
41
35
51
40
27
65
70
55
68
23
46
52
52
50
23
23
20
18
11
9
1
1
6
1
7
2015
2016
2017
2018
2019
Искуств.интеллект
3D
Обучение
Прогр обесп
дроны
приборы
Вирт
радары
речь
квантум
www.stateofeuropeantech.com
$4.9млрд
Sofia Hmich
основатель
положительного
капитала
326
29
In Partnership with
&
30.
03.2Investment by Industry
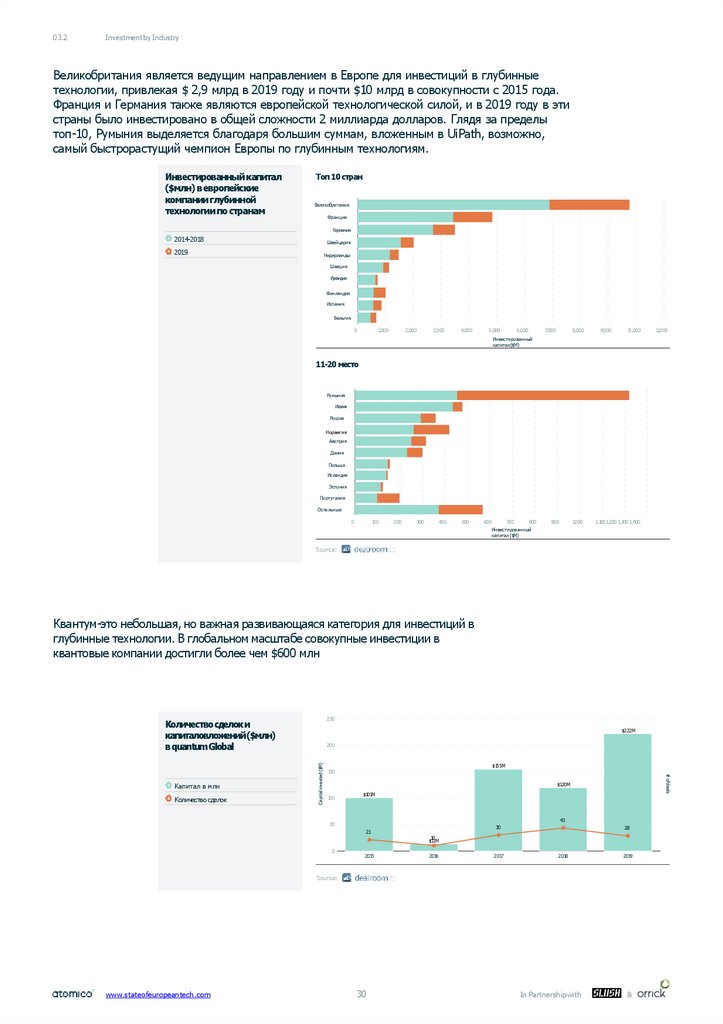
Великобритания является ведущим направлением в Европе для инвестиций в глубинные
технологии, привлекая $ 2,9 млрд в 2019 году и почти $10 млрд в совокупности с 2015 года.
Франция и Германия также являются европейской технологической силой, и в 2019 году в эти
страны было инвестировано в общей сложности 2 миллиарда долларов. Глядя за пределы
топ-10, Румыния выделяется благодаря большим суммам, вложенным в UiPath, возможно,
самый быстрорастущий чемпион Европы по глубинным технологиям.
Инвестированный капитал
($млн) в европейские
компании глубинной
технологии по странам
Топ 10 стран
Великобритания
Франция
Германия
2014-2018
Швейцария
2019
Нидерланды
Швеция
Ирландия
Финляндия
Испания
Бельгия
0
1,000
2,000
3,000
4,000
5,000
7,000
6,000
8,000
9,000
10,000
11,000
Инвестированный
капитал($M)
11-20 место
Румыния
Италия
Россия
Норвегия
Австрия
Дания
Польша
Исландия
Эстония
Португалия
Остальные
0
100
200
300
400
500
600
700
800
900
1,000
1,100 1,200 1,300 1,400
Инвестированный
капитал ($M)
Квантум-это небольшая, но важная развивающаяся категория для инвестиций в
глубинные технологии. В глобальном масштабе совокупные инвестиции в
квантовые компании достигли более чем $600 млн
250
Количество сделок и
капиталовложений ($млн)
в quantumGlobal
Capital invested ($M)
Количество сделок
$155M
150
$120M
100
$101M
43
50
21
0
www.stateofeuropeantech.com
# ofdeals
Капитал в млн
$222M
200
2015
30
30
28
10
$13M
2016
2017
2018
In Partnership with
2019
&
31.
03.2Investment by Industry
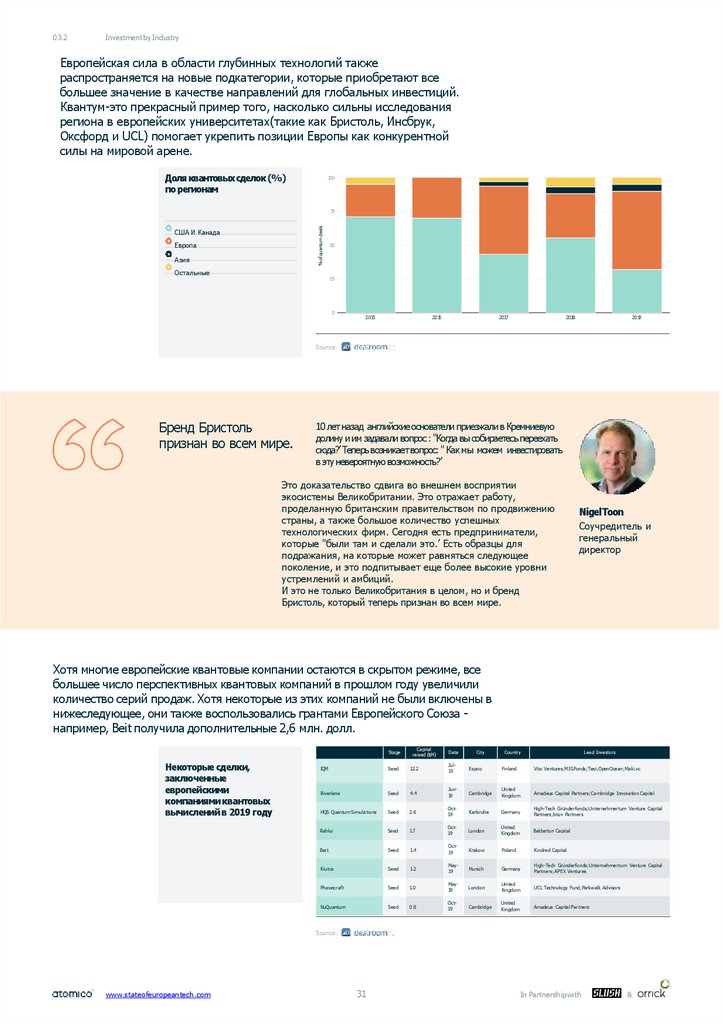
Европейская сила в области глубинных технологий также
распространяется на новые подкатегории, которые приобретают все
большее значение в качестве направлений для глобальных инвестиций.
Квантум-это прекрасный пример того, насколько сильны исследования
региона в европейских университетах(такие как Бристоль, Инсбрук,
Оксфорд и UCL) помогает укрепить позиции Европы как конкурентной
силы на мировой арене.
Доля квантовых сделок (%)
по регионам
100
%of quantum deals
75
США И Канада
Европа
Азия
Остальные
50
25
0
Бренд Бристоль
признан во всем мире.
2015
2016
2017
2018
2019
10 лет назад английские основатели приезжали в Кремниевую
долину и им задавали вопрос : "Когда вы собираетесь переехать
сюда?’ Теперь возникает вопрос: " Как мы можем инвестировать
в эту невероятную возможность?’
Это доказательство сдвига во внешнем восприятии
экосистемы Великобритании. Это отражает работу,
проделанную британским правительством по продвижению
страны, а также большое количество успешных
технологических фирм. Сегодня есть предприниматели,
которые "были там и сделали это.’ Есть образцы для
подражания, на которые может равняться следующее
поколение, и это подпитывает еще более высокие уровни
устремлений и амбиций.
И это не только Великобритания в целом, но и бренд
Бристоль, который теперь признан во всем мире.
NigelToon
Соучредитель и
генеральный
директор
Хотя многие европейские квантовые компании остаются в скрытом режиме, все
большее число перспективных квантовых компаний в прошлом году увеличили
количество серий продаж. Хотя некоторые из этих компаний не были включены в
нижеследующее, они также воспользовались грантами Европейского Союза например, Beit получила дополнительные 2,6 млн. долл.
Stage
Некоторые сделки,
заключенные
европейскими
компаниями квантовых
вычислений в 2019 году
Date
IQM
Seed
12.2
Jul19
Riverlane
Seed
4.4
Jun19
City
Country
Lead Investors
Espoo
Finland
Vito Ventures;MIGFonds;Tesi;OpenOcean;Maki.vc
Cambridge
United
Kingdom
Amadeus Capital Partners;Cambridge Innovation Capital
HQS Quantum Simulations
Seed
2.6
Oct19
Karlsruhe
Germany
High-Tech Gründerfonds;Unternehmertum Venture Capital
Partners;btov Partners
Rahko
Seed
1.7
Oct19
London
United
Kingdom
Balderton Capital
Beit
Seed
1.4
Oct19
Krakow
Poland
Kindred Capital
1.2
May19
Munich
Germany
High-Tech Gründerfonds;Unternehmertum Venture Capital
Partners;APEX Ventures
1.0
May19
London
United
Kingdom
UCL Technology Fund;Parkwalk Advisors
0.8
Oct19
Cambridge
United
Kingdom
Amadeus Capital Partners
Kiutra
Seed
Phasecraft
Seed
NuQuantum
www.stateofeuropeantech.com
Capital
raised ($M)
Seed
31
In Partnership with
&
32. 03.3 География инвестиций
Суммарные капитальные вложения с 2015года превысили $ 10 млрд в трех
европейских странах (Великобритания,
Германия, Франция) и более $1 млрд еще в
одиннадцати странах.
Инвестированный капитал
($млн) по странам в год с
2015
Топ 10 стран
40,000
2016
2017
2018
Capital invested ($M)
30,000
2015
2019
20,000
10,000
0
Великобритания
Германия
Франция
Швеция
Испания
Румыния
Норвегия
Швейцария Нидерланды
Исландия
Финляндия
Италия
Португалия
Эстония
11-20
2,000
Capital invested ($M)
1,500
1,000
500
0
Россия
Дания
Бельгия
Турция
Исландия
Люксембург
Австрия
Польша
другие
400
Capital invested ($M)
300
200
100
0
www.stateofeuropeantech.com
Кипр
32
Литва
Венгрия
Хорватия
Чехия
In Partnership with
Герн си
Украина
&
Монтенегро
33.
03.3Investment by Geography
Я даже более оптимистична,
чем 12 месяцев назад,
невероятно.
За последние 12 месяцев мы стали свидетелями рекордного
финансирования и появления новых французских компанийединорогов.. Мы также наблюдали некоторые очень
обнадеживающие инициативы со стороны правительства,
такие как новая французская техническая виза для талантов
и недавнее объявление Макрона о новом массовом фонде
для глубинных технологий. Мы видим все больше и больше
международных инвесторов и предпринимателей .Все это
очень многообещающе.
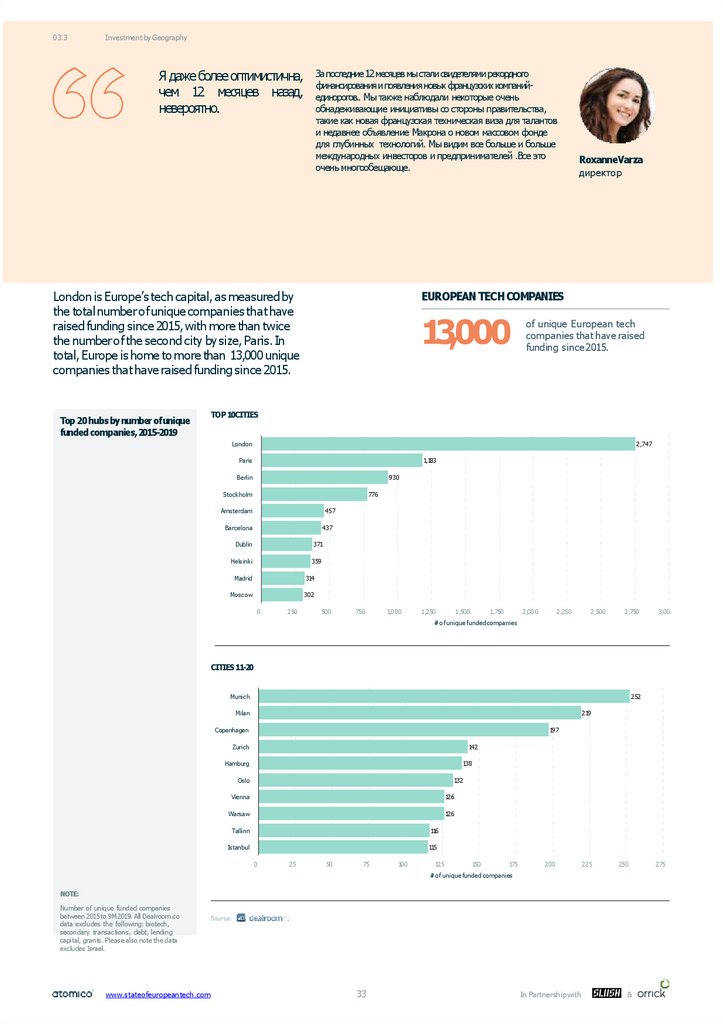
London is Europe’s tech capital, as measured by
the total number of unique companies that have
raised funding since 2015, with more than twice
the number of the second city by size, Paris. In
total, Europe is home to more than 13,000 unique
companies that have raised funding since 2015.
Top 20 hubs by number ofunique
funded companies,2015-2019
RoxanneVarza
директор
EUROPEAN TECHCOMPANIES
13,000
of unique European tech
companies that have raised
funding since 2015.
TOP 10CITIES
London
2,747
Paris
1,183
Berlin
930
Stockholm
776
Amsterdam
457
Barcelona
437
Dublin
371
Helsinki
359
Madrid
314
Moscow
302
0
250
500
750
1,000
1,250
1,500
2,000
1,750
2,250
2,500
2,750
3,00
# of unique funded companies
CITIES11-20
Munich
252
Milan
219
Copenhagen
197
Zurich
142
Hamburg
138
Oslo
132
Vienna
126
Warsaw
126
Tallinn
116
Istanbul
115
0
25
50
75
100
125
150
175
200
225
250
# of unique funded companies
NOTE:
Number of unique funded companies
between 2015 to 9M 2019. All Dealroom.co
data excludes the following: biotech,
secondary transactions, debt, lending
capital, grants. Please also note the data
excludes Israel.
www.stateofeuropeantech.com
33
In Partnership with
&
275
34.
03.3Investment by Geography
The distribution of capital invested per country
varies within key European tech industry
verticals. The UK, for example, is the most
important destination for investments in fintech,
accounting for half of all capital flows.
Share of capital invested(%)per
vertical per country, 2015-2017
vs. 2018-2019YTD
FINTECHINVESTMENTS
50%
UK share of total European
fintech investments since 2018.
FINTECH
100
LEGEND
United Kingdom
%of capital invested
Germany
Sweden
France
Switzerland
Netherlands
75
50
Spain
25
Denmark
Italy
Ireland
0
Rest of Europe
2015-2017
2018-2019YTD
2015-2017
2018-2019YTD
2015-2017
2018-2019YTD
ENTERPRISESOFTWARE
LEGEND
United Kingdom
Germany
100
France
Switzerland
%of capital invested
Romania
Spain
Belgium
Portugal
Sweden
75
50
Finland
Denmark
25
Ireland
Rest of Europe
0
HEALTH
LEGEND
United Kingdom
France
100
Germany
Switzerland
%of capital invested
Netherlands
Belgium
Sweden
Ireland
Spain
Denmark
Italy
75
50
25
Rest of Europe
0
NOTE:
All Dealroom.co data excludes the following:
biotech, secondary transactions, debt,
lending capital, grants. Please also note the
data excludes Israel. 2019 based on data to
September 2019.
www.stateofeuropeantech.com
34
In Partnership with
&
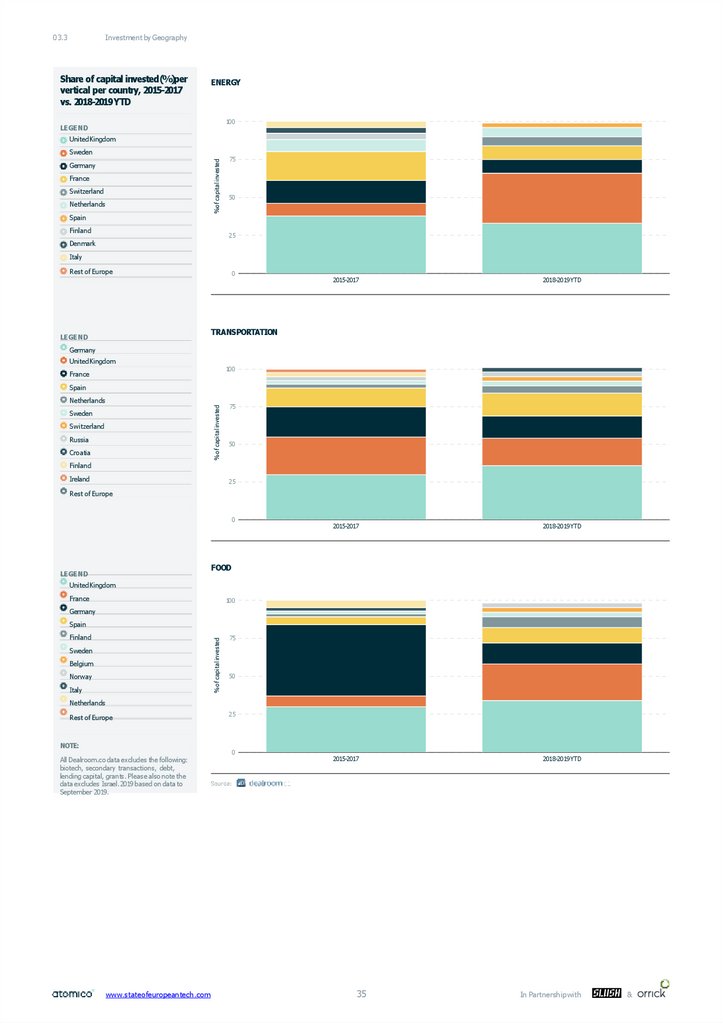
35.
03.3Investment by Geography
Share of capital invested(%)per
vertical per country, 2015-2017
vs. 2018-2019YTD
ENERGY
100
LEGEND
United Kingdom
%of capital invested
Sweden
Germany
France
Switzerland
Netherlands
Spain
Finland
75
50
25
Denmark
Italy
Rest of Europe
0
2015-2017
2018-2019YTD
2015-2017
2018-2019YTD
2015-2017
2018-2019YTD
TRANSPORTATION
LEGEND
Germany
United Kingdom
100
France
Spain
%of capital invested
Netherlands
Sweden
Switzerland
Russia
Croatia
75
50
Finland
Ireland
25
Rest of Europe
0
FOOD
LEGEND
United Kingdom
France
100
Germany
Spain
%of capital invested
Finland
Sweden
Belgium
Norway
Italy
75
50
Netherlands
Rest of Europe
NOTE:
All Dealroom.co data excludes the following:
biotech, secondary transactions, debt,
lending capital, grants. Please also note the
data excludes Israel. 2019 based on data to
September 2019.
www.stateofeuropeantech.com
25
0
35
In Partnership with
&
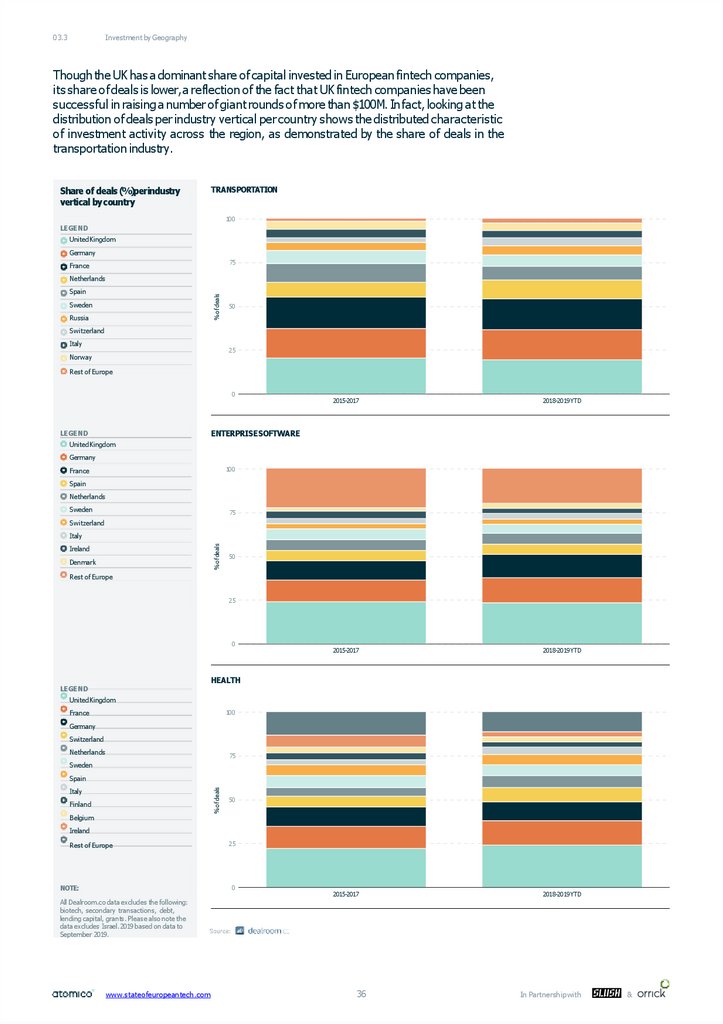
36.
03.3Investment by Geography
Though the UK has a dominant share of capital invested in European fintech companies,
its share of deals is lower, a reflection of the fact that UK fintech companies have been
successful in raising a number of giant rounds of more than $100M. Infact, looking at the
distribution of deals per industry vertical per country shows the distributed characteristic
of investment activity across the region, as demonstrated by the share of deals in the
transportation industry.
Share of deals (%)perindustry
vertical bycountry
TRANSPORTATION
100
LEGEND
United Kingdom
Germany
75
France
Netherlands
% of deals
Spain
Sweden
Russia
50
Switzerland
Italy
25
Norway
Rest of Europe
0
2015-2017
2018-2019YTD
2015-2017
2018-2019YTD
2015-2017
2018-2019YTD
ENTERPRISESOFTWARE
LEGEND
United Kingdom
Germany
100
France
Spain
Netherlands
Sweden
75
Switzerland
% of deals
Italy
Ireland
Denmark
50
Rest of Europe
25
0
HEALTH
LEGEND
United Kingdom
100
France
Germany
Switzerland
Netherlands
75
Sweden
% of deals
Spain
Italy
Finland
Belgium
50
Ireland
Rest of Europe
NOTE:
25
0
All Dealroom.co data excludes the following:
biotech, secondary transactions, debt,
lending capital, grants. Please also note the
data excludes Israel. 2019 based on data to
September 2019.
www.stateofeuropeantech.com
36
In Partnership with
&
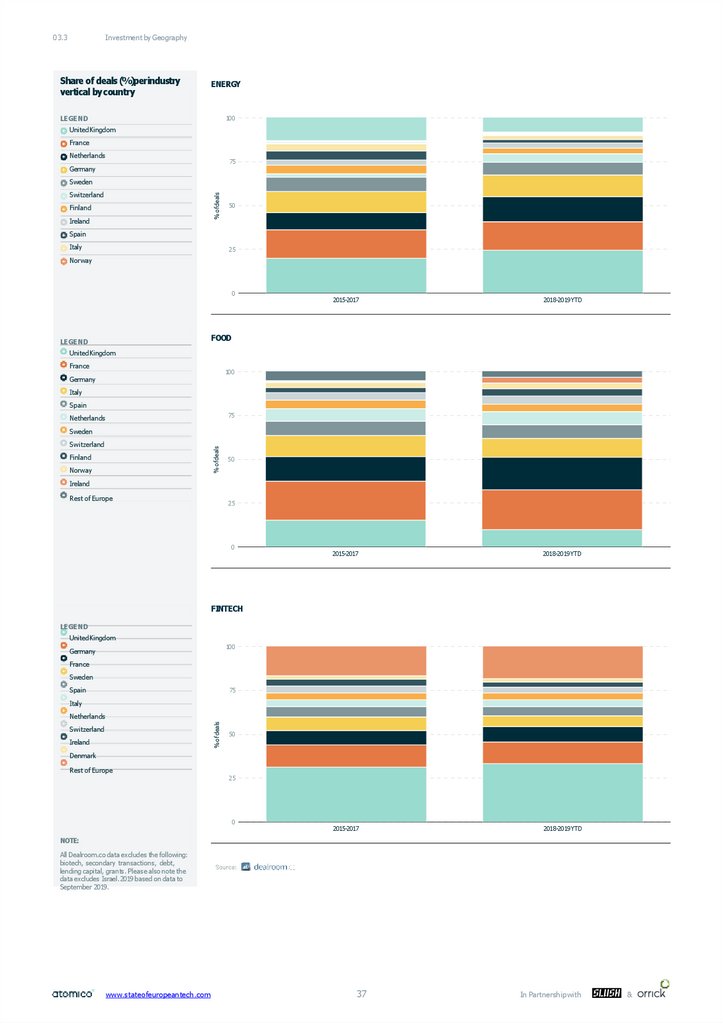
37.
03.3Investment by Geography
Share of deals (%)perindustry
vertical bycountry
ENERGY
LEGEND
100
United Kingdom
France
Netherlands
75
Germany
Sweden
% of deals
Switzerland
Finland
Ireland
50
Spain
Italy
25
Norway
0
2015-2017
2018-2019YTD
2015-2017
2018-2019YTD
2015-2017
2018-2019YTD
FOOD
LEGEND
United Kingdom
France
100
Germany
Italy
Spain
75
Netherlands
Sweden
% of deals
Switzerland
Finland
Norway
50
Ireland
Rest of Europe
25
0
FINTECH
LEGEND
United Kingdom
100
Germany
France
Sweden
Spain
75
Italy
% of deals
Netherlands
Switzerland
Ireland
50
Denmark
Rest of Europe
25
0
NOTE:
All Dealroom.co data excludes the following:
biotech, secondary transactions, debt,
lending capital, grants. Please also note the
data excludes Israel. 2019 based on data to
September 2019.
www.stateofeuropeantech.com
37
In Partnership with
&
38.
www.stateofeuropeantech.comIn Partnership with
&
39.
www.stateofeuropeantech.comIn Partnership with
&
40.
www.stateofeuropeantech.comIn Partnership with
&
41.
www.stateofeuropeantech.comIn Partnership with
&
42.
www.stateofeuropeantech.comIn Partnership with
&
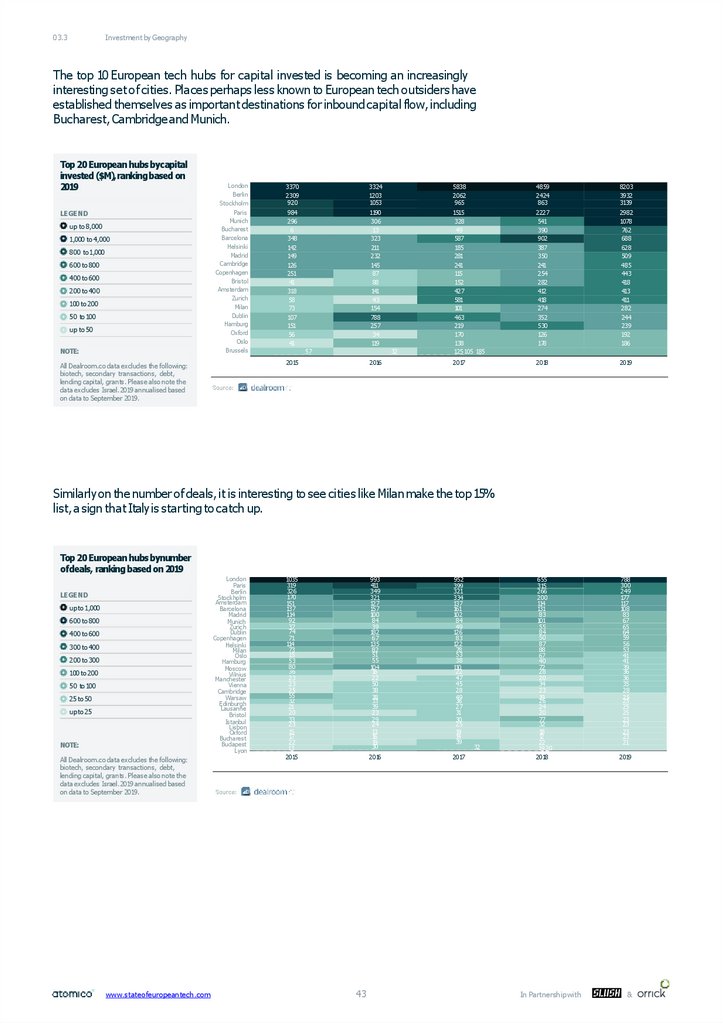
43.
03.3Investment by Geography
The top 10 European tech hubs for capital invested is becoming an increasingly
interesting set of cities. Places perhaps less known to European tech outsiders have
established themselves as important destinations for inbound capital flow, including
Bucharest, Cambridge and Munich.
Top 20 European hubs bycapital
invested ($M),ranking based on
2019
LEGEND
up to 8,000
1,000 to 4,000
800 to 1,000
600 to 800
400 to 600
200 to 400
100 to 200
50 to100
up to 50
NOTE:
London
Berlin
Stockholm
3370
2309
920
3324
1203
1053
5838
2062
965
4859
2424
863
8203
3932
3139
Paris
Munich
Bucharest
Barcelona
Helsinki
Madrid
Cambridge
Copenhagen
Bristol
Amsterdam
Zurich
Milan
Dublin
Hamburg
Oxford
Oslo
Brussels
984
296
6
348
142
149
126
251
41
318
58
73
107
151
56
41
1190
306
13
323
211
232
145
87
88
141
43
154
788
257
34
119
1515
328
49
587
185
281
241
115
152
427
581
101
463
219
170
138
125 105 185
2227
541
390
902
387
350
241
254
282
412
418
274
352
530
126
178
2982
1078
762
688
628
509
485
443
418
413
411
282
244
239
192
186
2017
2018
2019
655
315
266
200
114
131
83
101
55
84
50
87
88
67
40
72
28
20
34
23
19
26
24
20
77
32
18
12
22
19 20
788
300
249
177
117
108
83
67
65
64
59
56
53
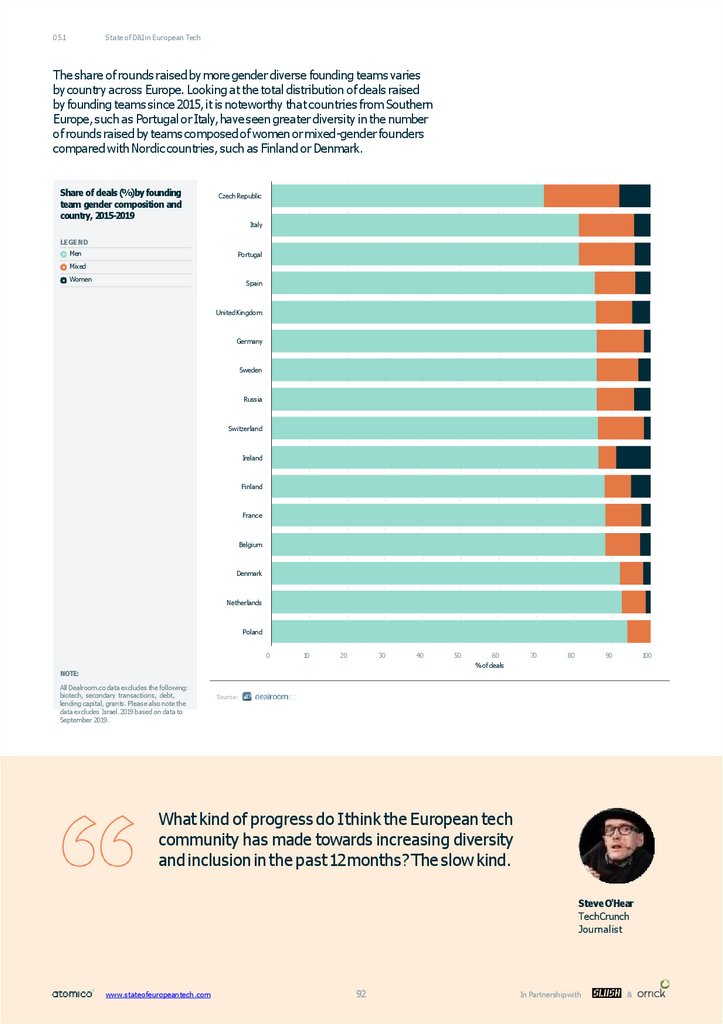
41
41
39
36
36
35
28
25
25
25
25
23
23
23
23
21
2018
2019
57
32
2015
All Dealroom.co data excludes the following:
biotech, secondary transactions, debt,
lending capital, grants. Please also note the
data excludes Israel. 2019 annualised based
on data to September 2019.
2016
Similarly on the number of deals, it is interesting to see cities like Milan make the top 15%
list, a sign that Italyis starting to catch up.
Top 20 European hubs bynumber
ofdeals, ranking based on 2019
London
Paris
Berlin
Stockholm
Amsterdam
Barcelona
Madrid
Munich
Zurich
Dublin
Copenhagen
Helsinki
Milan
Oslo
Hamburg
Moscow
Vilnius
Manchester
Vienna
Cambridge
Warsaw
Edinburgh
Lausanne
Bristol
Istanbul
Lisbon
Oxford
Bucharest
Budapest
Lyon
LEGEND
upto 1,000
600 to 800
400 to 600
300 to 400
200 to 300
100 to 200
50 to100
25 to 50
upto 25
NOTE:
All Dealroom.co data excludes the following:
biotech, secondary transactions, debt,
lending capital, grants. Please also note the
data excludes Israel. 2019 annualised based
on data to September 2019.
www.stateofeuropeantech.com
1035
319
326
170
151
137
114
92
37
74
71
114
73
15
53
80
36
23
23
25
55
32
21
20
33
23
15
17
22
13
993
411
349
321
127
157
100
84
39
182
67
135
82
51
55
104
16
22
50
38
38
33
39
23
29
24
13
16
19
30
952
399
321
334
137
161
102
84
49
126
83
122
78
53
38
110
22
47
45
28
49
36
27
31
30
25
19
14
39
2015
2016
2017
43
32
In Partnership with
&
44. 03.4 $1B+ Companies
03.4$1B+Companies
There are now at least 174 European tech companies that have scaled to a
valuation of more than $1 billion. Before entering this decade, that number
stood at just 13,meaning Europe has seen over 13xincrease in the number of
companies scaling to this milestone. This is a diverse set of companies, a large
proportion of which (43%)scaled to $1billion+ without raising venture capital.
Number of VC-backed& non-VCbacked $1B+European tech
companies peryear (cumulative)
150
# of VC-backed
# of non-VC-backed
#of companies
LEGEND
100
50
0
2010
2011
2012
2013
2014
2015
2016
2017
2018
2019
NOTE:
All Dealroom.co data excludes the following:
biotech, secondary transactions, debt,
lending capital, grants. Please also note the
data excludes Israel.
European founder attitudes to venture capital have undergone a
transformation. While Europe has always produced tech companies that can
reach billion-dollar milestones, these companies have not historically used
venture capital as a means to finance themselves. As Europe’s venture capital
base has matured and as awareness of the benefits of partnering with VCs has
grown,this trend has reversed itself entirely.
Share of VC-backed & non-VCbacked $1B+European tech
companies (%)per foundingyear
decade
100
LEGEND
# of VC -backed companies
# of non-VC-backed companies
% ofcompanies
75
50
25
NOTE:
0
1990s
2000s
2010s
All Dealroom.co data excludes the following:
biotech, secondary transactions, debt,
lending capital, grants. Please also note the
data excludes Israel.
www.stateofeuropeantech.com
44
In Partnership with
&
45.
03.4$1B+Companies
At the time of publication, there are 99 $1billion+ VC-backed European tech companies.
If Europe’s not already surpassed 100, it’s only a matter of time before this milestone is surpassed.
Number of new and total $1B+
European tech companies per
year
# of VC-backed tech companies
LEGEND
100
Exisiting
New in year
75
50
25
NOTE:
0
All Dealroom.co data excludes the following:
biotech, secondary transactions, debt,
lending capital, grants. Please also note the
data excludes Israel.
2010
2011
2012
2013
2014
2015
2016
2017
2018
2019
The UK is the single largest source of $1billion+VC-backed tech companies from Europe with
29, followed by Germany (17)and France (11).There are now VC-backed $1billion+European tech
companies from 20 unique countries across Europe, including Austria, Poland and the Czech Republic.
Number of $1B+VC-backed
European tech companiesby
country of origin
Germany
France
Sweden
United Kingdom
Denmark
Switzerland
Ireland
Russia
Netherlands
Spain
Czech RepublLicuxemburg Poland Ukraine Romania
Ireland
NOTE:
Portugal
All Dealroom.co data excludes the following:
biotech, secondary transactions, debt,
lending capital, grants. Please also note the
data excludes Israel.
Austria
InFrance, the pipeline of potential $1B+companies has
neverbeen so promising, and has even started to deliver
with Doctolib. The first exits will follow soon, and with
them the ‘mafias’ of operators with firsthand rocketship
experience that we lack. We perceive this as the last
significant step before ecosystem maturity.
www.stateofeuropeantech.com
45
Estonia
Belgium
PierreEntremont
Frst
Co-Founder&
Partner
In Partnership with
&
46.
www.stateofeuropeantech.comIn Partnership with
&
47.
03.4$1B+Companies
The total aggregate value of $1billion+VC-backed companies from Europe is just short of $270B
with companies founded during the 2000s delivering the greatest share of value to date. Companies
founded during the 2010s are on track to comfortably exceed that total based on the current trajectory
of value accretion.
Total value of VC-backed
European $1B+techcompanies
by foundingdecade
Combined valuation of companies ($B)
150
NOTE:
All Dealroom.co data excludes the following:
biotech, secondary transactions, debt,
lending capital, grants. Please also note the
data excludes Israel.
$144B
100
$96B
50
$29B
0
1990s
2000s
There are more billion-dollar companiesfor fintech (20)than for any
other industry vertical,thoughthere are a growingnumberof$1billion+
VC-backed European enterprise software companies.
Number of $1B+VC-backed
European tech companiesby
industry, alltime
2010s
EUROPEANSAAS
16
Fashion
Europe has now produced 16$1
billion+ VC-backed enterprise
software companies.
Travel
Gaming & Entertainment
Health
Fintech
Social & Consumer Apps
Transportation
Security
Semiconductors
NOTE:
All Dealroom.co data excludes the following:
biotech, secondary transactions, debt,
lending capital, grants. Please also note the
data excludes Israel.
Enterprise Software
Real Estate Adtech & Martech
Food & Drink
Music
Classi ed
Retail (excl. Fashion)
Construction
Hosting
Media
The total value of VC-backed $1billion+ European fintech companies now exceeds $50 billion.
Total value of $1B+VC-backed
European tech companies by
industry
Social & consumer Apps
Music
Gaming & entertainment
Fintech
Food & drink
Transportation
Health
Fashion
Security
Enterprise software
Semiconductors Classi ed Real estate
Travel
NOTE:
Adtech & martech
All Dealroom.co data excludes the following:
biotech, secondary transactions, debt,
lending capital, grants. Please also note the
data excludes Israel.
www.stateofeuropeantech.com
47
Retail (excl. fashion) ConstructionHosting
Media
In Partnership with
&
48.
03.4$1B+Companies
I’mvery optimistic. We’veseen so many exciting ideas being developed
by firms and embraced by consumers, including here at Monzo.
People are appreciating how technology can provide them with a much
better level of transparency and control, and I expect that trend to
continue. We’re seeing multiple world-class, growth-stage companies
coming out of Europe across multiple sectors, really for the first time
ever. Indigital banking alone, we’ve got three or four companies with
multi-billion valuations.
TomBlomfield
Monzo
CEO
The latest cohort of $1billion+ VC-backed European tech companies founded during the 2010s
remains overwhelmingly in private hands.
Share of $1B+VC-backed
European tech companies(%)by
ownership status and founding
yeardecade
%of tech companies by ownership status
100
LEGEND
Private
Public
Acquired
NOTE:
75
50
25
0
All Dealroom.co data excludes the following:
biotech, secondary transactions, debt,
lending capital, grants. Please also note the
data excludes Israel.
1990s
2000s
2010s
Because fewer unicorn companies have started in Europe
than in America, we have a less fixed mindset as to what
a successful business or a successful founder should
be. We’re more open to quirky business ideas and teams
that don’t quite fit the ‘socially awkward white guy with a
hoodie’mould.
www.stateofeuropeantech.com
48
Valentina Milanova
Daye
Founder & CEO
In Partnership with
&
49.
03.4$1B+Companies
Europe’s now produced 13$1B+VC-backed tech companies that have scaled to more than $5B,
including four that have grownbeyondthe $10B milestone.
Number of $1B+VC-backed
European tech companiesby
valuationgroup
$5B+
13
$2-5B+
28
<$2B
NOTE:
58
0
5
10
15
20
30
25
All time $1B+ VC-backed European tech
companies. All Dealroom.co data excludes
the following: biotech, secondary
transactions, debt, lending capital, grants.
Please also note the data excludes Israel.
Share of VC-backedEuropean
$1B+tech companies (%)by
business model
35
40
45
50
55
60
# of tech companies
Consumer
52%
Enterprise
41%
Deep tech
7%
0
5
10
15
20
25
30
35
40
45
50
55
%of VC-backed tech companies
NOTE:
All Dealroom.co data excludes the following:
biotech, secondary transactions, debt,
lending capital, grants. Please also note the
data excludes Israel.
Great operating talent came out of the first generation of consumer
tech companies in Europe - people who are great marketers, great at
product, great at finance. That talent has been key in supporting a new
generation of deep tech companies as they commercialise. Wenow have
the ingredients to build big companies.
NigelToon
Graphcore
Co-founder & CEO
www.stateofeuropeantech.com
49
In Partnership with
&
65
50. 03.5 European Exit Landscape
03.5European ExitLandscape
Many will be surprised to know that Europe has produced more tech IPOs
than the US for six consecutive years, including more tech IPOs in the first
nine months of 2019.
Number of tech IPOs byregion
100
LEGEND
87
Europe
75
United States
#of tech IPOs
63
49
50
41
0
32
30
28
25
33
29
20
2015
2016
2017
2018
2019
NOTE:
2019 based on data up to September 2019.
Photoby:Jussi Hellsten
50
In Partnership with
&
51.
03.5European Exit Landscape
But you have to dig beneath the headline numbers to get the full story. First of all, looking at the
magnitude of the tech IPOs, as measured by market cap ($B) at IPO, it is clear that the US had a
dominant year in 2019. The combined value of the Top 10tech IPOs in the US in the first nine months of
the year equated to a total market cap of $153B versus $22B for the ten largest European tech IPOs.
Uber’s market cap at IPOalone eclipsed the combined market cap of Europe’s top 10tech IPOs in 2019.
Largest tech IPOsbymarket cap
at IPO($M)in Europe and United
States, 2019
Uber
S75,463M
Nexi
S6,384M
Lyft
S20,583M
Adevinta
S6,218M
S10,058M
TeamViewer
S5,776M
Zoom
S9,230M
Trainline
S2,137M
Chew
S9,769M
HeadHunter
S675M
Datadog
S7,826M
FINEOS
S458M
CrowdStrike
S6,687M
LocoSoco
S390M
Tradeweb
S6,000M
BMIT
S113M
Dynatrace
S4,409M
essensys
S92M
CloudFlare
S4,400M
BoomBit
S67M
0
10,000
20,000
30,000
40,000
50,000
60,000
70,000
80,000
Marketcaр at IPO(SM)
Top 10largest tech IPOs by
proceeds raised ($M)atIPOin
Europe and US,2019
Uber
S8,100
Nexi
S2,323M
Lyft
S2,556M
TeamViewer
S2,166M
S1,639M
Trainline
S1,389M
Tradeweb
S1,242M
Adevinta
S387M
Chew
S1,177M
HeadHunter
S253M
Zoom
S864M
FINEOS
S146M
Datadog
S745M
BMIT
S55M
CrowdStrike
S704M
essensys
S35M
Dynatrace
S655M
InductionHealthcare
S22M
ChangeHealthcare
Zwiрe
S641M
S14M
0
1,000
2,000
3,000
4,000
5,000
6,000
7,000
8,000
Proceedsraised (SM)
www.stateofeuropeantech.com
51
In Partnership with
&
52.
03.5European Exit Landscape
Looking pastthe opening
day headlines, it’s notable
that Europe’s 2019 crop
of IPOs, large and small,
have delivered returns
for their investors
which exceed their US
contemporaries.
2019has been a highly eventful year in global tech listings,
with companies like Uber and Lyft in the US, and Nexi
and Trainline here in Europe. While numbers of European
listings have been a little subdued compared with 2018,
Europe has stretched its lead over the US in the number
of tech listings for the 6th year running. Looking past the
opening day headlines, it’s notable that Europe’s 2019crop
of IPOs, large and small, have delivered returns for their
investors which exceed their US contemporaries.
JamesClark
London Stock
Exchange
Head of Tech and
Lifesciences,
Primary Markets
The numbers of sponsor-backed tech IPOs per region are at similar levels in Europe and the US.
These relate to IPOs where typically financial investors, whether VCs or PE funds, play a ‘sponsoring’
role in bringing these companies to the public market. The mix of VC versus PE sponsors between the
US and Europe in 2019 has been very different. Inthe US, VCs have been the dominant sponsor of tech
IPOs, while in Europe they’ve been led by PE funds. This marks a shift versus 2018, when Europe’s
largest tech public listings were ‘sponsored’ by VCs, including Spotify, Adyen and Farfetch.
Number of sponsor-backedtech
IPOs by region
Europe
United States
#of sponsor-backed tech IPOs by region
LEGEND
15
10
14
10
10
9
8
8
7
6
5
5
3
0
2015
2016
2017
2018
2019
NOTE:
2019 based on data up to September 2019.
There is a divergence between European and US public markets in terms of the ability of tech
companies of different scale (bymarket cap)to access them. While the number of US tech IPOs
with a market cap of less than $1B has been in persistent decline for several years, Europe has seen
the opposite trend as a result of the greater diversity in types of companies that can access the
region’s public markets.
Number of tech IPOswith less
than $1Bmarket cap at IPO by
year andregion
80
80
Europe
United States
#of tech IPOs
60
LEGEND
56
46
40
36
29
20
0
16
2015
15
2016
15
2017
11
8
2018
2019
NOTE:
2019 based on data up to September 2019.
www.stateofeuropeantech.com
52
In Partnership with
&
53.
03.5European Exit Landscape
At the other end of the market cap scale, while European has consistently delivered multiple billiondollar tech IPOs each year, the US has delivered a greater volume of larger tech IPOs of $1B+market
cap at issuance. Since 2015, there have 2.8x as many $1B+tech IPOs from the US versus Europe.
Number of tech IPOs with $1B+
market cap at IPOper year and
region
Europe
United States
#of tech IPOs per year
LEGEND
21
21
20
15
15
12
10
7
5
5
7
5
4
3
0
2015
2016
2017
2018
2019
NOTE:
2019 annualised based on data to September
2019.
Of course, the 2.8x difference should be put in additional context. It’s only one consideration to
account for the difference between Europe and the US, but it’s relevant to note the gap in terms of
relative levels of capital investment into tech in Europe and the US. Since 2015, the US saw a 4.0x
greater level of venture capital investment versus Europe, a number that puts into additional context
the 2.8x multiple on $1B+tech IPOs.
S423)
400
o te htO/ ttla t hthet OeBhetc tahto S)
Number of tech IPOs withmarket
cap at IPOof $1B+and total
capital invested ($B) byregion
300
200
S109)
100
74
26
0
EurtBt
us
us
EurtBt
o tehtO/ttla
CeB het c tahto S)
The long-standing dominance of the US in the global tech industry and the sustained decades-long
gaps in relative capital investment in tech in different regions are best captured by the difference
in total market cap of public tech companies by region. The total aggregate value of public US tech
companies (around $5.9T) is 5.5x greater than Europe (around $1T). This too, however, is in part a
reflection of the fact that relative levels of venture capital investment in the US and Europe have
been on very different scales. More than $800B of venture capital has been invested in the US
since 2000 versus between $150-200B in Europe.
Total market cap ($B) of public
techcompanies by region in 2019
$5,880B
Market capitalisation ($B)
6,000
4,000
2,000
0
United States
$1,070B
$1,060B
China
Europe
NOTE:
Data as of 21October 2019.
www.stateofeuropeantech.com
53
In Partnership with
&
54.
03.5European Exit Landscape
Though Europe has yet to produce a company that comes close to rival the value creation of
trillion-dollar market cap companies to rival Microsoft or Apple, it’s often forgotten that Europe has
produced more than one $100B tech company. SAP, Europe’s largest public tech company by market
cap, has now grown to be valued at more than $150B. If SAP has done it, why can’t others?
Top 10largest tech companiesby
market cap ($B) in Europe, US
and China in2019
EUROPE
SAP
$158B
ASML
$108B
Dassault
$40B
Amadeus
$31B
Ericsson
$31B
Nokia
$30B
Infineon
$23B
Spotify
$21B
Ayden
$21B
Capgemini
$20B
0
20
40
60
80
120
100
140
160
180
Market cap ($B)
UNITEDSTATES
Apple
$1,068B
Microsoft
$1,057B
Amazon
$874B
Alphabet
$863B
$530B
Intel
$228B
Cisco
$198B
Oracle
$179B
Adobe
$129B
Salesforce
$126B
0
100
200
300
400
500
600
700
800
900
1,000
1,100
1,200
Market cap ($B)
CHINA
Alibaba
$463B
Foxconn
$43B
Hikvision
$40B
NetEase
$37B
Baidu
$36B
Qihoo360
$22B
Tencent
$22B
Luxshare Precision
$22B
BOE Technology
$18B
Avary
$14B
0
50
100
150
200
250
300
350
400
450
500
Market cap($B)
NOTE:
Based up data up to 21October 2019.
www.stateofeuropeantech.com
54
In Partnership with
&
55.
03.5European Exit Landscape
Whilst the US had a bumper year in terms of the scale of its tech IPOs in 2019, those companies have
not gained value as a cohort since listing, as the public markets have been impacted by increased
volatility. The weighted aftermarket performance of the 2019 class of tech IPOs from the US was
down 6%at the end of October 2019; Europe’s 2019 vintage was up 18%at the end of the same period.
Of course, it’s still much too early to judge the performance of these companies.
Weighted aftermarket
performance of techIPOs by
vintage year(%)
Weighted aftermarket performance (%)
LEGEND
Europe
United States
205%
200
154%
150
106%
100
80%
50
42%
30%
40%
22%
18%
0
-6%
-50
NOTE:
2015
2016
2017
2018
2019
Aftermarket performance is weighted by
market cap at IPO. 2019 based on data to 21
October 2019.
There are a lot of things happening right now in tech that are raising a lot
of questions. Looking at what happened to WeWork most recently, we’re
seeing investors shy away from companies that might not
be clearly profitable from the get-go.
Ithink there will be some kind of movement when it comes to funding
for startups. Startups will need to prove themselves, and their business
models even more. It’sgoing to be trickier; if you rely on funding, a far
more uncertain future is ahead. Combined with the delay of Brexit in the
UK, we’re entering an extended state of uncertainty for businesses.
MariaRaga
Depop
CEO
Photoby:Jussi Railainen
www.stateofeuropeantech.com
55
In Partnership with
&
56.
03.5European Exit Landscape
Besides simply looking at the scale of public tech companies, there are a number of other cultural
differences between European and US public markets. One is a greater level of openness to existing
investors selling down their position at IPOfor liquidity. As a result, there is a materially higher share
of secondary share sales on European than on US markets.
LEGEND
Europe
United States
PRIMARY SHARESALES
100
Average share of secondary/primary shares sold
Average share ofprimary versus
secondary shares sold at IPOby
region
99%
98%
96%
94%
94%
91%
90
89%
88%
87%
81%
80%
80
76%
76%
74%
70
60
67%
2012
2013
2014
66%
2015
2016
2017
2018
2019
SECONDARY SHARESALES
34%
Average share of secondary/primary shares sold
33%
30
26%
24%
19%
20
24%
20%
13%
12%
11%
9%
10
6%
6%
4%
2%
0
2012
2013
2014
1%
2015
2016
2017
2018
2019
NOTE:
2019 based on data up to September 2019.
There is a strong pool of sophisticated European public market investors that have built large
portfolios of holdings in public European tech companies. Norway’s giant sovereign wealth fund,
Norges Bank Investment Management,is the single largest European investor in European public
tech companies, as measured by the size of its portfolio at the end of September 2019.
# of Investments in European Tech Companies
Top 10European investorsin
European tech companies
www.stateofeuropeantech.com
Norges Bank Investment Management
332
Legal & General Investment Management
203
DWS Investment
255
Baillie Gifford
143
BNP Paribas Asset Management
162
Allianz GlobalInvestors
208
Amundi AssetManagement
152
UBS AssetManagement
257
Henderson GlobalInvestors
224
ABN AMRO
157
56
In Partnership with
&
57.
03.5European Exit Landscape
2018 was a record year for European VC-backed exits, including the IPOs of Spotify, Adyen
and Farfetch, amongst other highlights. By comparison, 2019 has been a very quiet year in terms
of large-scale VC-backed exits, with the largest exit coming in at just over $850M.
Top 10largest VC-backed exits
by value at exit in2019
NOTE:
Kiwi.com
Exit Type
Country
Acquisition
Czech Republic
City
Value at IPO/EV in M&A ($M)
Brno
853
Acquirers (if any)
General Atlantic
Drivy
Acquisition
France
Paris
300
Getaround
MeilleursAgents.com
Acquisition
France
Paris
220
Axel Springer
Audio Network
Acquisition
United Kingdom
London
215
Entertainment One
Graze
Acquisition
United Kingdom
Richmond
200
Unilever
iyzico
Acquisition
Turkey
Istanbul
165
PayU
data Artisans
Acquisition
Germany
Berlin
103
Alibaba
Crypto Facilities
Acquisition
United Kingdom
London
100
Kraken
Usabilla
Acquisition
Netherlands
Amsterdam
80
SurveyMonkey
mnubo
Acquisition
Spain
Sant Pere de Ribes
78
Aspen Technologies
EUR to USD conversion taken by date of exit
from Bloomberg; Graze value at exit based
on rumours.
The slow year in terms of VC-backed exits is reflected in the count of total M&A transactions.
VC-backed M&A exit countby
deal size
600
500
<$100M
$100M-$250M
$250M-$500M
>$500M
VC-backed exit count
LEGEND
400
300
200
100
0
NOTE:
2015
2016
2017
2018
2019
All Dealroom.co data excludes the following:
biotech, secondary transactions, debt,
lending capital, grants. Please also note the
data excludes Israel. 2019 based on data up
to September 2019.
Looking beyond just venture-backed European tech M&A activity, total deal value hit $88B
in the first nine months of 2019 and is on track to surpass 2018’s total for the year of nearly
$100B. Non-VC-backed companies have been the key driver of that figure, accounting for
almost 80% of total deal value up until the end of September 2019.
European M&A exit value($B)
per year by VC-backed ornot
VC-backed exit value
Non-VC backed exit value
Exit value ($B)/exitcount
LEGEND
100
100
75
72
67
66
48
50
45
32
31
25
20
8
0
2015
2016
2017
2018
2019
NOTE:
2019 is based on data up to September 2019.
www.stateofeuropeantech.com
57
In Partnership with
&
58.
03.5European Exit Landscape
European tech M&A is dominated by exits to European
buyers, which accounted for 60%of exit by deal count in
2019.Onein four M&Atransactions in 2019was a US buyer,
a record high over the past five years.
Share ofM&A exits by buyer
region byyear
%of M&A exits
Other (incl. unknown buyer country)
of European tech companies are
sold to European buyers.
75
Europe
Asia
60%
100
LEGEND
United States and Canada
TECH M&ABUYERS
50
25
NOTE:
VC-backed and non-VC backed deals
included. All Dealroom.co data excludes the
following: biotech, secondary transactions,
debt, lending capital, grants. Please also
note the data excludes Israel. 2019 based on
data to September 2019.
0
2015
2016
2017
2018
2019
Despite the slow exit year in 2019, Europe has a large pipeline of potential exit candidates with close
to $103B of unrealised $1B+candidates for exits across a number of industries.
Realised and unrealised $1B+
exits by industry vertical
$91B
Fintech
$50B
$41B
Enterprisesoftware
LEGEND
$19B
$47B
Gaming
$2B
Value of realised $1B+exits
Value of unrealised $1B+startups
$39B
Food
$6B
$21B
Transportation
$11B
$21B
Music
$1B
$7B
Travel
$10B
$6B
$4B
Health
0
10
20
30
40
50
60
70
80
90
Realised and unrealised value ($B) of $1B+ startups
NOTE:
All Dealroom.co data excludes the following:
biotech, secondary transactions, debt,
lending capital, grants. Please also note the
data excludes Israel. Data from 2013 to 2019;
2019 based on data up to September 2019.
Entrepreneurs
believe they can build
extraordinarysuccess
stories in Europe,
because either they know
of others, or perhaps,
increasingly, they know
someone directly who
has been a part of one
of those stories. That’s
hugely powerful.
www.stateofeuropeantech.com
I tend to think that a high-performing ecosystem is
made up of three main things: talent, capital and a ‘belief
system’. Ithink Europe has more and more phenomenal
talent, including people who move from the US to come to
Europe for any number of reasons - for their studies, for
lifestyle or world experience, to move back to where their
families are, etc.
I don’t have to tell you there’s more capital than ever
before, and more high-quality capital, Ishould add. But
it’s really the ‘belief system’ that Ithink has had the most
marked change. Entrepreneurs believe they can build
extraordinary success stories in Europe, because either
they know of others, or perhaps, increasingly, they know
someone directly who has been a part of one of those
stories. That’s hugely powerful.
58
LeilaRastegar
Zegna
Kindred Capital
Founding General
Partner
In Partnership with
&
100
59. Investors
04Investors
What is the definition of a European tech investor?
As investment into European startups continues to set records,
capitalprovidershaveproliferatedatallstagesfromangeltogrowth.
Investors at more than 100 funds are on track to raise over $100B,
and we saw a record number of first-time funds.
www.stateofeuropeantech.com
59
In Partnership with
&
60. 04.1 VCs and LPs
04.1VCs andLPs
It’s hard to point to a single reason why the level of interest in European tech
has increased in the way it has over the past five years. But it would be foolish
to look past the hard data. The fact is that European VC returns are now globally
competitive andthat has caused LPs to wake up. On a one-, three- and fiveyear horizon, Cambridge Associates data, the most widely cited benchmark of
venture capital performance, shows that its index for European VC performance
is either on par or significantly outperforming indices for both US VC and,
importantly, European Private Equity.
Horizon pooled return (net)by
fund index, June2019
Europe Developed Venture Capital Index
($)
Cambridge Associates US Venture Capital
Index
Europe Developed Private Equity Index ($)
MSCI Europe Index ($)
Horizon Pooled Net Return (%)
30.0
LEGEND
20.0
10.0
0.0
25 year
20 year
15year
10year
5 year
3 year
1year
NOTE:
As of 30 June 2019, $
LPs from around the world are becoming increasingly
interested in European tech. They recognise the quality
of technical talent in Europe and want access to this
potential. There is also a realisation that the next Silicon
Valley isn’t going to be a single location; instead, it will be
a numberof cities that attract and aggregate the world’s
best talent and build ecosystems aroundthis.
w w w.s t atate
eof eu
eurrope
pea
ant ec h.c om
60
60
Alice Bentinck
Entrepreneur First
Co-founder
In P ar t ner s hi p wi t h
&
61.
04.1VCs and LPs
2018 was another record year with European VCs
raising more than $13B,and fundraising activity in
the first six months of 2019 (>$7.5B)indicates that
the full year total for 2019 could go on to surpass
that level. Larger funds of greater than €250M
represent over 40% of capital raised in 2018.
LEGEND
<€25M
€25-50M
€50-100M
€100-250M
66%
of all VC funds raised in 2018
are from funds with a size of
>€100M.
FUNDSRAISED
12,500
Funds raised ($M) / #of funds closed
VC funds raised ($M)andnumber
of VC funds closed per year by
fund size (€M)
FUNDS>€100M
10,000
7,500
5,000
2,500
>€250M
0
2015
2016
2017
2018
H12019
FUNDSCLOSED
Funds raised ($M) / #of funds closed
250
200
150
100
50
0
2015
2016
2017
2018
H12019
NOTE:
H1 2019 gures are preliminary. Taken from
the European Data Cooperative, developed
by Invest Europe. EDC data converted at
EUR:USD of 1.1367,the rate on 30 June 2019.
The overall median fund size at final closing
reached $53M in the first six months of 2019,
continuing the gradual increase in average fund
size in Europe over the past five years.
AVERAGE VC FUNDSIZE
$53M
Median and mean fund size($M)
at nal closing byyear
120
L EGEND
100
Size of median VC fund closed in
Europe in H1 2019
$112M
$106M
$105M
$100M
$92M
Mean
Fund size ($M)
Median
80
60
$51M
$48M
$50M
$53M
$43M
40
NOTE:
20
2015
2016
2017
2018
H12019
H1 2019 gures are preliminary. Taken from
the European Data Cooperative, developed
by Invest Europe. EDC data converted at
EUR:USD of 1.1367,the rate on 30 June 2019.
www.stateofeuropeantech.com
61
In Partnership with
&
62.
04.1VCs and LPs
In the UK and Germany the mean fund size at final closing has surpassed $100M, but
elsewhere in Europe average fund sizes are still much lower. On a European-wide basis, the
mean VC fund has a final closing at $45M.
Median and mean fund size($M)
at nal closing by year by subregion, 2014-H12019
$117M
UK & Ireland
$186M
$101M
DACH
$156M
$46M
AllEurope
LEGEND
Median
Mean
$98M
$45M
France & Benelux
$73M
$28M
Southern Europe
$41M
$20M
CEE
$27M
$17M
Nordics
$65M
0
NOTE:
20
40
60
80
100
120
Fund size ($M) at nal closing
140
160
180
200
Taken from the European Data Cooperative,
developed by Invest Europe. EDC data
converted at EUR:USD of 1.1367,the rate on
30 June2019.
The median size of first-time VC funds closed in Europe hit $62.5m in the first half of 2019.
This is up nearly 3x on median fund sizes from five years ago.The increased fund size is a
reflection of the sophistication of new generation first-time fund managers in Europe, as
well as a necessary response to the increased round sizes in European early-stage venture.
Median and mean fund size ($M)
at nal closing per year by fund
type (2014-H12019)
INITIAL FIRST VCFUND
$122.0M
125.0
$97.3M
100.0
Median
Mean
Fund size ($M)
LEGEND
$82.6M
75.0
50.0
$62.5M
$45.7M
$43.5M
$44.6M
$32.5M
25.0
0.0
$22.7M
$24.6M
$22.9M
$15.9M
2014
2015
2016
2017
2018
H12019
$10.2M
$6.9M
2018
H12019
$105.5M
$105.4M
FIRST-TIME VC FUNDOF ESTABLISHED FIRM
Fund size ($M)
300.0
$280.9M
200.0
$97.3M
$90.9M
100.0
$69.9M
49
0.1
0M
$3
0.0
2014
2015
2016
2017
FOLLOW ON VCFUND
120.0
$112.0M
$99.7M
Fund size ($M)
100.0
$92.1M
80.0
$67.8M
60.0
$51.2M
NOTE:
H1 2019 gures are preliminary. Taken from
the European Data Cooperative, developed
by Invest Europe. EDC data converted at
EUR:USD of 1.1367,the rate on 30 June 2019.
$49.9M
2017
2018
$52.6M
40.0
20.0
www.stateofeuropeantech.com
$48.3M
$43.3M
$41.6M
2014
62
2015
2016
In Partnership with
H12019
&
63.
04.1VCs and LPs
Looking back on a cumulative basis at total funds
committed to European VCs since 2014, government
agencies have been the largest contributors - supporting
the European VC ecosystem with $9B. They are followedby
corporate investors and private individuals as the next two
largest LP types.
GOVERNMENTAGENCIES
$9B
Funds allocated by government
agencies to European VCs since
2014
VC funds raised ($B) by LPtype,
2014-2018cumulative
Private individuals
LEGEND
Fund of funds
Family o ces
Government agencies
upto 12.0
8.0to 10.0
6.0to 8.0
4.0to 6.0
2.0to 4.0
1.0to 2.0
Pension funds
0.0 to 1.0
Other asset managers (including PE houses ot her than fund of funds)
Banks
Insurance companies
Corporate investors
upto 0.0
Endowments andfoundations
Capital markeStoAsvceardeeigmniwceinaslthitufutinodns
NOTE:
Taken from the European Data Cooperative,
developed by Invest Europe. Excludes
Unclassi ed. EDC data converted at
EUR:USD of 1.1367,the rate on 30 June 2019.
The record high of more than $13B raised by European
VCs in 2018 came despite a decline in government agency
investment of almost $1B.This drop was more than offset
by large increases in investment by fund of funds, pension
funds and family offices.
www.stateofeuropeantech.com
63
In Partnership with
&
64.
04.1VCs and LPs
Indeed, pension funds appear to be waking up to the European VC
opportunity. They contributed just short of $1Bto European VCs in
2018, a material increase on the average commitment of just $395M
per year for the period between 2014 and 2017. The emergence of
fund of funds with a mandate for European VC is also notable. Fund of
funds contributed $1.2B in 2018, more than any other LP type except
government agencies.
Funds committed ($M)to VC
funds by LP type (>$500M),20142017vs2018
PENSIONFUNDS
$902M
Size of total investment by
pension funds in European VC in
2018 (arecord)
Government agencies
Fund of funds
Corporate investors
LEGEND
Family offices
VC Funds 2018 ($M)
Private individuals
Average VC Funds 2014-2017 ($M)
Pension funds
Other asset managers (including PE houses other than
fund offunds)
Banks
Insurance companies
Endowments andfoundations
NOTE:
0
250
500
750
1,000
1,250
1,500
1,750
2,000
Funds committed ($M)
Taken from the European Data Cooperative,
developed by Invest Europe. Excludes
Unclassi ed. EDC data converted at
EUR:USD of 1.1367,the rate on 30 June 2019.
Looking at 2018 commitments as a multiple of average commitments
in the four previous years, pension funds, family offices and
endowments and foundations have shown the greatest increase in
their allocations to European VC, a clear indication of the increased
institutional investor interest in the asset class.
Funds committed to VC fundsby
LP type (multiple), 2018versus
average per year2014-2017
Endowments andfoundations
2.9x
Family offices
2.4x
Pensionfunds
2.3x
Insurance companies
LEGEND
2.1x
Fund of funds
Multiple (2018vs. average 2014-2017)
2.0x
Banks
1.5x
Other asset managers (including PE houses other than
fund offunds)
1.4x
Private individuals
1.1x
Government agencies
1.0x
Corporate investors
0.9x
0.0
NOTE:
0.5
1.0
1.5
2.0
2.5
3.0
Multiple of funds committed in 2018vs average per year in 2014-2017
Taken from the European Data Cooperative,
developed by Invest Europe. Excludes
Unclassi ed. EDC data converted at
EUR:USD of 1.1367,the rate on 30 June 2019.
The value creation in venture
is based on innovation. Great
companies can be created
anywhere and at any time in a
market cycle. That makes venture
an interesting complement to
other asset classes where the
value creation are more related to
interest rates and stock markets.
www.stateofeuropeantech.com
The European VC market has matured and
grown and has been proven by successful
exits. Still, many managers are too young to
have experienced a market downturn. But
the increased market size makes the market
more resilient to a potential correction.
Christina Brinck
Sixth Swedish
National Pension
Fund - Investment
Director
64
In Partnership with
&
65.
04.1VCs and LPs
The diversification of the LP base for GPs in different regions is at very different levels depending
on the maturity of the local VC ecosystem. The GP investor base in the UK, the most developed
European VC market, benefits from access to a heavily diversified LP base. This is in contrast to
GPs based in Central & Eastern Europe, where there is still a large dependency on funds raised from
government agencies. The Nordics, meanwhile, has the strongest relative support from pension
funds, which make up 16%of all VC funds raised in the sub-region since 2014.
VC funds raised ($M)by GP
region and LP type,2014-2018
UK & Ireland
LEGEND
$1538M
$1218M
$1254M
$132M
$1692M
$430M
$274M
$935M
$1333M
$42M
$268M
$1081M
$709M
Southern Europe
$916M
$271M
$299M
$50M
$362M
$364M
$484M
$74M
$93M
$1M
$0M
$56M
$3M
Nordics
$428M
$169M
$130M
$104M
$262M
$265M
$197M
$87M
$324M
$5M
$0M
$54M
$0M
$3442M
$2695M
$2300M
$1228M
$1194M
$1194M
$868M
$673M
$526M
$128M
$86M
$74M
$11M
DACH
$1915M
$1738M
$280M
$163M
$173M
$474M
$193M
$914M
$172M
$40M
$26M
$35M
$2M
CEE
$788M
$104M
$109M
$0M
$62M
$38M
$163M
$13M
$33M
$0M
$4M
$0M
$7M
up to 3,500
2,500to 3,000
2,000 to 2,500
France & Benelux
1,500to 2,000
1,000to 1,500
500 to 1,000
250 to 500
100to 250
up to 100
NOTE:
Taken from the European Data Cooperative,
developed by Invest Europe. EDC data
converted at EUR:USD of 1.1367,the rate on
30 June2019.
UK-based VCs have raised $17B in cumulative funds since 2014,
followedby French ($11.7B)and German ($7.6B)VCs. Given its status
as Europe’s fourth-largest economy by GDP, the fact that Italian
VCs have raised only $1.2B over the same period is particularly
noteworthy. The launch of the recent €1B National Innovation Fund in
Italywith a mandate that includes investing in VC funds could help to
move that number in the right direction.
VC FUNDS RAISED INUK ANDITALY
$1.2B vs$17B
Total amount raised by Italian and UK funds
respectively since 2014
VC funds raised ($M)bycountry,
2014to H12019
LEGEND
France
Germany
Netherlands
up to 17,000
9,000to 13,000
5,000to 9,000
United Kingdom
1,000to 5,000
500 to 1,000
250 to 500
Spain
Italy
Belgium
Sweden
100to 250
Switzerland
50 to100
0 to 50
Norway
upto 0
Luxembourg
Austria
Finland
Hungary
Denmark Ireland
NOTE:
2019 based on data to H12019. H12019
gures are preliminary. Taken from the
European Data Cooperative, developed by
Invest Europe. EDC data converted at
EUR:USD of 1.1367,the rate on 30 June 2019.
www.stateofeuropeantech.com
65
Poland
Portugal LEitshtuoaniiCazechRepublGicreeLceaRt voimaaBnuialgUSakrleroiaravbianiakeia
In Partnership with
&
66.
04.1VCs and LPs
Ona population-adjusted basis, VCs based in Luxembourg and Switzerland have raised the highest
amount of funds, a reflection of their attractiveness as global financial centres. The Netherlands and
the UK also rank high on a per capita basis, while large European markets such as Italy, Spain
and even Germany still have relatively underdeveloped VC ecosystems compared with the most
advanced European countries. Estonia is an example of a country that has seen a rapid development
in the local VC ecosystem with the emergence of a new generation of VC funds, such as Karma
Ventures andTera Ventures.
VCfundsraised per capita by
country of GP byyear
TOP10
$280
Luxembourg
$ raised per capita (2013-2015)
$ raised per capita (2016-2018)
$771
$189
$191
Switzerland
LEGEND
$86
Netherlands
$183
$94
UnitedKingdom
$153
$99
Norway
$5
Estonia
$120
$55
France
$114
$56
Finland
$7
Sweden
$85
$80
$10
Hungary
$124
$72
0
200
100
300
400
500
600
700
800
Funds raised per capita ($)
RANKS11-20
$30
Germany
$57
$33
Ireland
$57
$23
Belgium
$54
$12
Denmark
$54
$20
Spain
Austria
$16
$5
Italy
$16
$0
Greece
$11
$2
Lithuania
$10
$3
Bulgaria
0
$30
$18
$8
5
10
15
20
25
30
35
40
45
50
55
60
Funds raised per capita ($)
REST OFEUROPE
$5
Czech Republic
$7
$5
Latvia
$7
$2
Poland
$7
$0
Serbia
$7
$0
Romania
$4
$4
Portugal
$3
0
1
2
3
4
5
6
8
7
Funds raised per capita ($)
NOTE:
Taken from the European Data Cooperative,
developed by Invest Europe. EDC data
converted at EUR:USD of 1.1367,the rate on
30 June2019.
www.stateofeuropeantech.com
66
In Partnership with
&
67.
04.1VCs and LPs
It’s interesting to look at the geographic distribution of VC funds raised in different subregions of Europe and their stage of focus. The distribution of VC funds with an earlystage venture focus is fairly even across Europe, but there are greater levels of regional
concentration for multi-stage and later-stage venture VC funds. Southern Europe stands
out for its smaller share of VC funds raised across Europe in the past five years.
Share of totalVCfundsclosed
(%)by GP region by venture
stage focus, 2014-H12019
17%
France & Benelux
21%
UK & Ireland
21%
32%
26%
26%
16%
LEGEND
DACH
9%
Southern Europe
9%
9%
15%
Early stage venture
Later stage venture
15%
Venture (allstages)
15%
3%
CEE
7%
17%
36%
Nordics
5%
NOTE:
0
5
10
20
15
25
30
35
40
% of total VC funds closed
H1 2019 gures are preliminary. Taken from
the European Data Cooperative, developed
by Invest Europe. Total may not sum to 100%
due to rounding.
But looking at the dollar-weighted distribution of VC funds raised by
VC across the region shows there is a greater level of concentration
of capital availability.VCs in the UK and France hold the greatest
firepower in terms of dollar amounts raised, while GPs in CEE and
Southern Europe have far less capital to deploy.
(%)by GP region byventure
stage focus, 2014-H12019
CEE VCFUNDING
4%
Share of total European early-stage
venture funds raised by VCs based in
CEE since 2014
50%
UK&Ireland
58%
35%
11%
France&Benelux
15%
31%
LEGEND
18%
Early stage venture
DACH
25%
17%
Later stage venture
13%
Nordics
Venture (allstages)
2%
8%
4%
Southern Europe 0%
7%
4%
CEE
1%
2%
0
NOTE:
5
10
15
20
25
30
35
40
45
50
55
60
% of total VC funds raised ($B)
H1 2019 gures are preliminary. Taken from
the European Data Cooperative, developed
by Invest Europe. Total may not sum to 100%
due to rounding.
The geographic target focus of funds raised by GPs from different European sub-regions
also stands out because of the wide variance. VC funds raised from the UK & Ireland are
most likely to be investing with a pan-regional or global mandate, while VC funds raised by
GPs based in the CEE are most likely to have a local mandate specific to one country or a
small set of neighbouring countries.
Distribution of VC funds by GP
region and geography targetfor
all venture stages,2014-H12019
% of local
% of pan-European/Global
Distribution of funds (%)
LEGEND
100
3%
45%
75
47%
69%
50
55%
25
H1 2019 gures are preliminary. Taken from
the European Data Cooperative, developed
by Invest Europe. Only includes VC funds
stating their geography targets.
www.stateofeuropeantech.com
0
83%
53%
31%
NOTE:
76%
97%
CEE
67
DACH
Southern Europe
Nordics
24%
France & Benelux
In Partnership with
17%
UK & Ireland
&
65
68.
04.1VCs and LPs
There are interesting differences in the LP composition of VC funds in different regions
across Europe. VC funds from less mature markets in CEE are more dependent on
government agency funding, while those funds from more advanced markets like the
UK have a greater level of LP type diversity.
VCfundsraised byGPregion and
LP type,2014-2018
CEE
LEGEND
Southern Europe
Governmentagencies
Corporate investors
DACH
Private individuals
Fund offunds
France & Benelux
Family o ces
Nordics
Other asset managers (includingPE
houses other than fund of funds)
UK & Ireland
Pension funds
0
10
20
30
40
50
60
70
80
90
Banks
Insurance companies
Endowments and foundations
Capital markets
Sovereign wealth funds
Academic institutions
The overwhelming share of VC funds raised in Europe flows to follow-on funds,
which account for almost 80% of the total. That being said, more than $1.7Bhas
been committed to 28 first-time Europe VC fund managers in just the first six
months of 2019.
LEGEND
First-time VCfund
First-time VC fund of established rm
Follow-on VCfund
FUNDSRAISED
12.5
Funds raised ($B) / #of funds closed
Funds raised ($B) and numberof
funds closed per year by fund
type
10.0
7.5
5.0
2.5
0.0
2015
2016
2017
2018
H12019
2017
2018
H12019
FUNDSCLOSED
Funds raised ($B) / #of funds closed
250.0
200.0
150.0
100.0
50.0
NOTE:
0.0
2015
2016
H1 2019 gures are preliminary. Taken from
the European Data Cooperative, developed
by Invest Europe. EDC data converted at
EUR:USD of 1.1367,the rate on 30 June 2019.
www.stateofeuropeantech.com
68
In Partnership with
&
100
69.
04.1VCs and LPs
First-time fund managers are most dependent on raising from government agencies
and corporate investors, but also receive meaningful contributions from private
individuals and banks. Follow-on funds, unsurprisingly, are able to raise from a more
diversifiedLP base.
Share of funds (%)raisedby fund
type and type of LP,2014-2018
28%
Corporate investors
14%
20%
Government agencies
LEGEND
26%
Initial rst VC fund
Follow on VC fund
17%
Other asset managers (including PE houses other than
fund offunds)
5%
10%
Banks
4%
8%
Private individuals
13%
5%
Fund of funds
11%
5%
Insurance companies
5%
4%
Family offices
8%
3%
Pensionfunds
8%
2%
Endowments andfoundations
4%
0%
Academic institutions
0%
0%
Sovereign wealth funds
1%
0%
Capitalmarkets
3%
0
5
10
15
20
25
30
%of funds raised
NOTE:
Taken from the European Data Cooperative,
developed by Invest Europe. Excludes
Unclassi ed. Total may not sum to 100% due
Europe has produced some very strong performing first-time VC fund managers. The
European Investment Fund’s returns analysis shows that first-time VC fund managers
make a large share - approaching half - of their Top 10best-performing funds.
Distribution of top-performing
EIF backed VC fund managers
split by emerging versus
established funds
IRR, Emerging
TVPI, Emerging
IRR, Established
TVPI,Established
Distribution of funds
LEGEND
20
15
10
5
0
IRR
TVPI
Top5
NOTE:
IRR
TVPI
Top 10
IRR
TVPI
Top 20
Data relates to EIF-backed European ICT
funds only. Emerging funds are de ned as
any fund between Fund Iand III.Based on
data up to Q2 2019.
www.stateofeuropeantech.com
69
In Partnership with
&
70.
04.1VCs and LPs
Isee far more openness
to European VC than
when we raised our first
fund four years ago.
I see far more openness to European VC than when we
raised our first fund four years ago. There are more
examples of big outcomes in recent years that Ithink are
fuelling that interest, and far lower in-prices and relatively
less competition (although I think that’s changing in the
later stage rounds when it’s more of a global investor
universe). There are also more operators coming onto the
investment side (instead of retiring!), and that’s a really
positive force for the ecosystem as a whole.
LeilaRastegarZegna
Kindred Capital
Founding General
Partner
Based on their interactions with different LP types VC respondents to the survey stated
that corporates, family offices and private individuals are the LP types, most frequently
cited as having shown an increased appetite for investment in the European VC asset class
in the last 12months.
Inthe last 12months, which LP
types have you spoken to and
how has their appetite for
European Venture Investment
changed?
Family offices & Private HNW individuals
Corporate investors
Sovereign wealth Funds
Insurance companies
Government agencies (e.g. EIF)
LEGEND
Fund of funds
Increased appetite
Same appetite
Decreased appetite
Pensionfunds
Endowments, foundations & fcademic institutions
0
NOTE:
10
20
30
40
50
60
70
80
90
% ofrespondents
Venture Capitalist respondents only,
excluding respondents that answered 'I do
not feel su ciently informed to comment'
and 'Ihave not interacted with any LPs of this
type'. Numbers may not add to 100 due to
rounding.
European Buyout raises funds from a diverse LP geographic footprint, with European LPs
accounting for less than 50% of total LP commitments. By contrast, European VC funds
are still overwhelmingly backed by European investors. There are, however, clear signs of
the geographic diversification of the European VC LP base as international interest in the
asset class grows. Non-European investors accounted for 20% of commitments to
European VCs in 2018 versus an average of 10%for the period 2014-2017.
Funds raised by fund type andLP
region, 2014-2017vs 2018
100
LEGEND
75
North America
Asia & Australia
Rest of the world
%of funds raised
Europe
50
25
NOTE:
0
VC funds (2014-2017)
VC funds (2018)
Buyout funds (2014-2017)
Buyout funds (2018)
Taken from the European Data Cooperative,
developed by Invest Europe. Excludes
Unclassi ed. Total may not sum to 100% due
to rounding.
www.stateofeuropeantech.com
70
In Partnership with
&
100
71.
04.1VCs and LPs
A large share of European VCs reported increased appetite for European venture
investment from LPs inside and outside Europe and across all regions, most obviously
from Asia and the Middle East.
Inthe last 12months, how has
the appetite for European
venture investment ofLimited
Partners from the following
regionschanged?
Europe
NorthAmerica
LEGEND
Increased appetite
Asia
Same appetite
Decreased appetite
Middle East
0
NOTE:
10
20
30
40
50
60
70
80
90
100
% of respondents
Venture Capitalist respondents only,
excluding respondents that answered 'I do
not feel su ciently informed to comment'
and 'Ihave not interacted with any LPs of this
type'. Numbers may not add to 100 due to
rounding.
US LP interest in European VC has strengthened as the European
tech industry has proven its ability to deliver outsized returns. This is
reflected in a 5x increase in funds committed from US-based LPs in
2018 versus 2017.There is also an increase, though much smaller, in
LP commitments from Asia.
Funds committed ($B) to VC
funds by LP region per year,
2014-2018
Europe
Asia& Australia
North America
5x
Increase in commitments to European
VC funds from US LPs in 2018
$8.7B
$8.2B
7.5
Funds committed ($B)
LEGEND
US LP INTEREST INEUROPEANVC
$7.1B
5.0
$4.4B
$4.2B
2.5
$1.7B
$0.5B
0.0
NOTE:
$0.0B
$0.1B
2014
2015
$0.5B
$0.7B
$0.2B
$0.3B $0.3B
$0.3B
2016
2017
2018
Taken from the European Data Cooperative,
developed by Invest Europe. Excludes
Unclassi ed. EDC data converted at
EUR:USD of 1.1367,the rate on 30 June 2019.
As venture capital and innovation continue their global
growth, Europe and its surrounding ecosystem remain
increasingly attractive on many fronts, including
valuations and capital flows. OurSilicon Valley neighbours
have echoed this sentiment and are moving teams to
Europe in increasing numbers.
www.stateofeuropeantech.com
71
DavidYork
Top Tier Capital
Partners
Managing Director
In Partnership with
&
72.
04.1VCs and LPs
The scale of European VC is small when compared against the level
of LP commitments to European Buyout funds. Since the beginning
of 2018, more than a $100B has been raised by Buyout funds versus
around $20B raised by European VC funds. That said, the gap is
closing. Inthe first six months of 2019, the difference was 3.7x versus
7x as recently as 2017.
Funds raised ($B) by fundtype
per year
$82.6B
80.0
$75.6B
$71.2B
LEGEND
Funds raised ($B)
Buyoutfunds
VC funds
60.0
40.0
$38.1B
$28.6B
20.0
0.0
2015
2016
$13.0B
$11.7B
$10.3B
$7.7B
2017
$7.7B
2018
H12019
NOTE:
H1 2019 gures are preliminary. Taken from
the European Data Cooperative, developed
by Invest Europe. EDC data converted at
EUR:USD of 1.1367,the rate on 30 June 2019.
Pension funds have invested $100B in European
Buyout funds since 2014,but only $3B in European
VC funds, a difference of 40x. The multiple is
even more extreme for sovereign wealth funds,
which have invested 79x more capital in European
Buyout funds than European VC funds.
Funds committed ($B) to VCand
Buyout funds by LP type, 20142018
NOTE:
PENSION FUNDCOMMITMENTS
40x
Difference in pension funds
commitments to European Buyout funds
versus European VC funds
1
Sovereign wealth
2
Pension funds
3
Insurance compan
4
Fund of funds
5
Endowments and
6
Other asset mana
than fund of funds
7
Family offices
8
Banks
9
Academic institut
10
Private individuals
11
Capitalmarkets
12
Corporate investo
13
Government agen
14
All LP types
Taken from the European Data Cooperative,
developed by Invest Europe. Excludes
Unclassi ed. EDC data converted at
EUR:USD of 1.1367,the rate on 30 June 2019.
www.stateofeuropeantech.com
72
In Partnership with
&
73.
04.1VCs and LPs
The share of capital deployed by different LP types into European VC and Buyout funds varies
significantly. While government agencies allocate a greater share of their dollar commitments into
European VCs, pension funds allocated a 3%share of the combined commitment to European Buyout
and VC funds to the region’s venture capital funds. Sovereign wealth funds and insurance companies
also allocated at single-digit percentage levels into European VC.
Share of totalcommitments (%)
to European Buyout and VC
funds by LP type,2018
55%
Government agencies
45%
46%
Capitalmarkets
54%
LEGEND
36%
Corporate investors
Venture
64%
Buyout
Private individuals
27%
73%
Family offices
26%
74%
19%
Endowments andfoundations
16%
Banks
Fund of funds
Other asset managers (including PE houses other than
fund offunds)
Academic institutions
Taken from the European Data Cooperative,
developed by Invest Europe. Excludes
Unclassi ed. Total may not sum to 100% due
to rounding.
84%
13%
87%
12%
88%
11%
89%
7%
Insurance companies
NOTE:
81%
93%
Pension funds 3%
97%
Sovereign wealth funds 2%
98%
0
10
20
30
40
50
60
70
80
90
100
% of commitments
As a result of these vast differences in capital allocation, the composition of the LP base of European
Buyout and VC funds looks very different. Pension funds make up 36%of all funds raised since 2014
by Buyout funds, but only 7%of funds raised by European VCs.
Funds raised by fund type andLP
type, 2014-2018
24%
Government agencies
2%
16%
Corporate investors
2%
LEGEND
VC funds
12%
Private individuals
4%
Buyoutfunds
10%
Fund of funds
14%
7%
Family offices
6%
7%
Other asset managers (including PE houses other than
fund offunds)
6%
7%
Pensionfunds
36%
6%
Banks
4%
4%
Insurance companies
11%
3%
Endowments andfoundations
4%
2%
Capitalmarkets
1%
1%
Sovereign wealth funds
11%
NOTE:
Taken from the European Data Cooperative,
developed by Invest Europe.
1%
Academic institutions
0%
0
5
10
15
20
25
30
35
%of funds raised
www.stateofeuropeantech.com
73
In Partnership with
&
40
74. 04.2 Investors
We asked European VCs to give their perspective on a number of trends related to the underlyingdynamics of the market. The sentiment was clear; competition has intensified. There was a strong
level of agreement that competition between local VCs has increased and that T1US VCs have
become more active in Europe, even at the early stages. This intensification of competition is felt
in valuations, the compression of fundraising timelines and more pre-emptive term sheets being
offered to companies.
Thinking about the past 12
months, do you agree or
disagree with thefollowing
statements:
LEGEND
Agree
Disagree
Neither agree nor disagree
Competitionbetween European VCs has intensified
Early-stage (Seed to Series B) US VCs are more active in
Europe
European VCs are demonstrating greater concern about
the potential societal and/or environmental impact of
their portfoliocompanies
More companies are receiving pre-emptive term sheets
European VCs have taken meaningful steps to improve
the diversity of the founders they back
Valuations for early-stage companies are at healthy
levels
0
10
20
30
40
50
60
70
80
90
% of respondents
NOTE:
Venture Capitalist respondents only.
Numbers may not add to 100 due to
rounding.
One driver of increased competition is the increase in the number of active investors deploying
capital into European tech. This investor base continues to expand, with over 2,600 unique
institutions participating in at least one deal in 2019. We can expect this number to come close
to 3,000 once adjusted for the reporting lag.
AT LEAST ONEDEAL PER YEAR
3,000
2,802
2,656
2,604
2018
2019
2,323
#of unique institutions
Number of unique institutions
that have participated in atleast
1and 5 investment deals in
Europe per year
2,000
1,774
1,000
0
2015
2016
2017
AT LEAST FIVE DEALS PER YEAR
307
NOTE:
Number of unique investors (incl. investment
funds, corporate investors & accelerators,
but excl. angel investors) that have
participated in at least 1investment round
per year. 2019 annualised based on data to
September 2019.
www.stateofeuropeantech.com
#of unique institutions
300
280
269
233
232
200
100
0
2015
74
2016
2017
2018
In Partnership with
2019
&
100
75.
04.2Investors
The depth of the pool of investors varies according to the size of the round. While there are
more than 1,500+unique institutions that have made at least one investment into rounds of
less than $10M, the number reduces to just over 100 unique institutions that have invested
in a round of $100M or more.
NUMBER OF UNIQUEINSTITUTIONS BY ROUND SIZE AND BYYEAR
<$10M
$10M-$20M
500
2,000
1,813
447
426
1,644
# of unique institutions
# of unique institutions
1,500
1,191
1,140
398
400
1,520
1,000
300
300
224
200
500
100
0
2015
2016
2017
2018
0
20199M
$20M-$50M
379
300
2018
20199M
151
119
# of unique institutions
285
234
190
100
93
75
50
41
100
0
2017
150
356
# of unique institutions
2016
$50M-$100M
400
200
2015
2015
2016
2017
2018
0
20199M
2015
2016
2017
2018
20199M
$100M+
125
113
102
# of unique institutions
100
75
71
60
53
50
NOTE:
All Dealroom.co data excludes the following: biotech, secondary transactions,
debt, lending capital, grants. Please also note the data excludes Israel. 2019
based on data to September 2019.
25
0
2015
2016
2017
2018
20199M
There has never been stronger interest in Europe from US investors, who are more active
in terms of their activity in the region, but also are spending an increasing amount of time
on the ground to build their European network and dealflow.
600
Number of unique USinstitutions
that have participated in at least
1investment round in Europe per
year
525
500
481
507
421
# ofinstitutions
400
363
300
200
100
NOTE:
Number of unique investors (incl. investment
funds, corporate investors & accelerators,
but excl. angel investors) that have
participated in at least 1investment round
per year. 2019 annualised based on data to
September 2019.
www.stateofeuropeantech.com
0
2015
75
2016
2017
2018
In Partnership with
2019
&
76.
04.2Investors
One in five rounds raised in Europe in 2019 involved the participation
of at least one US or Asian investor, up from just 10%in 2015.
Share of European deals(%)per
year with at least one US or
Asian investor
US AND ASIAN INVESTORS INEUROPEANTECH
21%
Share of rounds raised in Europe
with at least one US or Asian investor
participating
21%
19%
20
15%
% ofdeals
15
10
13%
10%
9%
13%
11%
10%
11%
2%
2%
2%
2016
2017
2018
4%
5
NOTE:
1%
All Dealroom.co data excludes the following:
biotech, secondary transactions, debt,
lending capital, grants. Please also note the
data excludes Israel. 2019 based on data up
to September 2019.
0
2015
2019
US and Asian investors have been particularly important for the rise
of large-scale funding rounds of $100M+in Europe. In2019, 90% of all
$100M+rounds involved the participation of at least one investor from
the US or Asia.
90%
%of deals >$100M involving non-European investors
Share of deals(%)>$100M
involving non-European
investors
NOTE:
90
88%
80
73%
70%
70
63%
60
All Dealroom.co data excludes the following:
biotech, secondary transactions, debt,
lending capital, grants. Please also note the
data excludes Israel. 2019 based on data up
to September 2019.
2015
2016
The growth in US and Asian investor activity in Europe is reflected
in the total capital commitments from investors based in those
regions. In2019, the total capital invested into Europe from US-based
investors is approaching $10B, up nearly 3x since 2015.
2017
2018
2019
US AND ASIANINVESTORS
90%
of $100M+ rounds raised in 2019 involved
at least one US or Asian investor
Venturecapital invested(SB)
Venture capital invested ($B)
into Europe
7.5
S5.8B
5.0
S4.4B
S4.0B
S3.4B
S2.5B
2.5
S1.7BS1.7B
S0.5B
0.0
S0.8B
S0.4B S0.3B
S0.8B
S1.1B
20152016 2017 2018 2019
20152016 2017 2018 2019
20152016 2017 2018 2019
NorthAmerica
Asia
Rest ofworld
NOTE:
All Dealroom.co data excludes the following:
biotech, secondary transactions, debt,
lending capital, grants. Please also note the
data excludes Israel. 2019 annualised based
on data to September 2019.
www.stateofeuropeantech.com
S0.8B
76
In Partnership with
&
77.
04.2Investors
I’dsay the European funding gap has moved a lot more to later stages
than in the past. Today,there are a lot of high-quality investors available
from the seed stages until maybe Series B (referring to up to €30-50m
rounds). However, from Series C onwards (now talking about €100m+
rounds), there are a lot fewer options available in Europe than elsewhere.
For instance, in our case over 2/3 of the investors we spoke with for
our Series C came from outside Europe, while we’dmostly focused on
speaking with European investors up until our Series B.
MikiKuusi
Wolt
Co-Founder & CEO
The volume of investment activity by corporate investors has also expanded considerably in recent
years. In 2019, almost 700 unique corporate investors participated in at least one investment round
involving a European tech company.
#of unique corporate investors
# of corporate rounds
750
600
500
500
250
400
NOTE:
Unique corporate investor count is based on
number of corporate (i.e. non investment
fund) investors that have participated in at
least 1round per year. 2019 annualised based
on data to September 2019.
0
2015
2016
2017
2018
300
2019
The rise of corporate investor participation has been even more marked than the rise of US and Asian
investors. 22%of rounds closed in Europe in 2019 involved at least one corporate investor, up from
just 9%in 2015.
Share of European deals (%)per
year with at least one corporate
investor
22%
23
%of European deals
20
18
15%
15
13%
13
10
11%
9%
NOTE:
All Dealroom.co data excludes the following:
biotech, secondary transactions, debt,
lending capital, grants. Please also note the
data excludes Israel. 2019 based on data up
to September 2019. Includes corporate VC
funds as well as corporate investors.
www.stateofeuropeantech.com
8
2015
77
2016
2017
2018
In Partnership with
2019
&
#of unique corporate investors
LEGEND
#of corporate deals
Number of unique corporate
investors per year and numberof
deals involving at least one
corporate investor, 2015-2019
78.
04.2Investors
On the other hand, the most active Corporate VCs span a wide range
of industries. With 4 of the top 10,Germanyis home to some of the
most active Corporate VCs, each one having at least one unicorn in
portfolio - Graphcore, Fair,Bolt and N26.
Top 10most active corporate
venture capital investors in
European tech by number of
deals in the last 12months
NOTE:
# of Deals Last 12 Months
%of Portfolio Size
1
Next47 (Siemens)
Germany
Country
16
12
2
Unilever Ventures
United Kingdom
15
38
3
Santander Innoventures
United Kingdom
11
41
4
M Ventures (Merck KGaA)
Germany
10
14
5
Sabadell VentureCapital
Spain
9
31
6
Swisscom Ventures
Switzerland
9
13
7
Robert Bosch Venture Capital
Germany
9
18
8
InMotion ventures (Jaguard Land Rover)
United Kingdom
8
44
9
AXA VenturePartners
France
7
14
10
Allianz X
Germany
6
33
All Dealroom.co data excludes the following:
biotech, secondary transactions, debt,
lending capital, grants. Please also note the
data excludes Israel. 2019 based on data as
ofSeptember 2019.
The depth of the corporate investor base is also apparent from a
vertical perspective. Young companies can tap into a specialised pool
of investors to navigate their scaling journey. It’s also remarkable to
see some of our homegrown European scale-ups such as Just Eat
and Delivery Hero become active investors in the ecosystem.
Top 10most active corporate
investors for select vertical
ranked by number ofdeals, 20152019
Fintech
1
Health
Enterprise
Software
Transportation
Food
Salesforce
Ventures
Crédit Agricole
Rakuten
Serena
R/GA Ventures
Daimler Technology &
Venture
Swisscom
Ventures
Caixa Capital
Caixa Capital
ProSiebenSat.1
Accelerator
ING Ventures
ZKB
InMotion ventures
2
Collector Ventures
Crédit Agricole
3
OrangeDigital
Ventures
Axel Springer Plug and Play
Accelerator
4
Credit Mutuel Arkea
Parkwalk Advisors
Deutsche Bahn
5
Goldman Sachs
M Ventures
Crédit Agricole
Sapphire Ventures
Mail.ru Group
6
Schibsted Growth
Hax
BOOST Programs
R/GA Ventures
Just Eat
7
Allianz X
Boehringer Ingelheim Venture Fund
Macif
Parkwalk Advisors
ZKB
8
Santander
Innoventures
Oxford TechnologyManagement
Shell
Pi Labs
Metro Group
9
BNP Paribas
BNP Paribas
Delivery Hero
GV
Collector Ventures
10
Uniqa
Sabadell VentureCapital
RATP
M12
Unilever Ventures
NOTE:
2019 based on data up to September 2019.
www.stateofeuropeantech.com
78
In Partnership with
&
79. 04.3 Angels
European angel investinglandscapePre-seed stage investments are particularly difficult to monitor given most
angel investments are not tracked until much later in the life of the startup.
The European Business Angels Network organisation (‘EBAN’) estimates that
the ‘visible’ market only represents 10%of the overall angel investments.
As such there is an inherent bias in our datasets towards ‘super-angels’ and/
or startups that have already managed to progress through multiple stages
of investments. The reporting lag is also much more likely to impact the
performance for 2018 and 2019.
EBAN estimates that $8.6B (€7.5B) was invested across all
European countries in 2018 by angel investors, based on the
extrapolation of the ‘visible’ market. Angel investors with
the deepest pockets reside in the UK, Germanyand Spain.
CAPITAL INVESTED($B)
$8.6B
invested by angel investors in
Europe in2019.
'Visible' capital invested ($M)by
angels bycountry
LEGEND
upto 120
80 to 100
60 to 80
40 to 60
20 to 40
10to 20
upto 10
NOTE:
EUR to USD conversion taken at 1EUR to
1.145 USD from December 31, 2018.
Displaying 'visible market' capital invested
($M)in the EU-28 countries.
www.stateofeuropeantech.com
79
In Partnership with
&
80.
04.3Angels
A significant number of founders surveyed
mentioned receiving angel investments to start
their company from these countries.
Share of respondents(%)who
raised initial nancing from
angel investors byregion
UK & Ireland
30%
Nordics
29%
Southern Europe
28%
CEE
26%
DACH
25%
France & Benelux
23%
Rest of Europe
20%
0
3
5
8
10
13
15
18
20
23
25
28
30
33
% ofrespondents
NOTE:
Founder respondents only.
Though we can see only a small part of the ‘visible’ market, EBAN
estimates there are well over 300,00 angel investors in Europe. Still,
the number of active angels (those who participate in at least one
investment every year)is significantly lower - though rising quickly.
# of investments
# of angels participating in at least one
investment
NOTE:
1,500
1,314
923
1,000
# ofinvestments
LEGEND
1,648
#of angels participating in at least one investment
Number of unique angel
investors participating in atleast
one investment and #of angel
investment
970
726
733
2015
2016
500
0
2017
All Dealroom.co data excludes the following:
biotech, secondary transactions, debt,
lending capital, grants. Please also note the
data excludes Israel.
Angel investingin Europe
has grown significantly
from just a handful of
investor networks on the
continent in the late 90s
to a market that today
sees more than 450
active communities of
angels scattered across
the map.
www.stateofeuropeantech.com
Angel investing in Europe has grown significantly from
just a handful of investor networks on the continent in the
late 90s to a market that today sees more than 450 active
communities of angels scattered across the map.
This strong growth is also reflected in the size of the angel
market in terms of investments made annually in early
stage startups. Nearly €7.5Bare estimated to be invested
each year by European angels, with approximately forty
thousand startups receiving pre-seed, seed and series A
funding from this category of private investors. Toput this
number into perspective, in 2009 the angel investor market
in Europe was estimated to be worth approximately€2.6B.
EBAN has been monitoring the angel investment market
in Europe since 2004 when we first launched our annual
‘Statistics Compendium’ publication.
80
Jacopo Losso
EBAN
Director of
Secretariat
In Partnership with
&
81.
04.3Angels
Founders are becoming more likely to make investments back in the ecosystem in comparison with
the period 2015-2018, leading to the increased sophistication of the investor pool.
Share ofangel investments (%)
by founders, 2015-2018vs 2019
21%
20
Average %of deals
17%
NOTE:
15
10
All Dealroom.co data excludes the following:
biotech, secondary transactions, debt,
lending capital, grants. Please also note the
data excludes Israel. 2019 as of September
2019.
5
0
Angel investorsform
a critical part of any
successful ecosystem.
2015-2018
2019
Angel investors form a critical part of any successful
ecosystem. Looking back a dozen or so years ago, there
were very few angel investors in Europe, and even fewer
founders turned angels. For TransferWise, it was a huge
coup to get the likes of Max Levchin (founder of PayPal)
and David Yu (then the CEO of Betfair) to invest in our seed
round. Besides the credibility, it gives startup teams lots
of experience to tap into for problem solving as you grow.
Seed funds like Seedcamp, who often act together with the
angels, also have a vital role to play in fulfilling this need.
TaavetHinrikus
TransferWise
Co-Founder &
Chairman
The top 15most active angel investors are all founders (orin the case of Sophia Bendz, operator) except for 3.
Top 15angel investors inEurope
by deal count,2015-2019
Deal Count
Former Founder?
1
Xavier Niel
Investor
54
Yes
Iliad
Company
2
Charlie Songhurst
35
No
n/a
3
Theo Osborne
24
No
n/a
4
Pierre Kosciusko-Morizet
23
Yes
PriceMinister
5
Taavet Hinrikus
22
Yes
TransferWise
6
Chris Adelsbach
21
No
n/a
7
Carlos Blanco
19
Yes
Akamon Entertainment
8
Sophia Bendz
19
No (operator)
Spotify
9
Alex Chesterman
18
Yes
Zoopla
10
Thibaud Elziere
18
Yes
Fotolia
11
Andreas Mihalovits
16
Yes
dreamfab
12
Eduardo Ronzano
16
Yes
KelDoc
13
Hampus Jakobsson
15
Yes
brisk.io
14
Michael Benabou
15
Yes
Vente privée
15
David Helgason
15
Yes
unity
FORMERFOUNDERS
40%
www.stateofeuropeantech.com
of angel investors surveyed by EBAN have also been a
founder in the past.
81
with
In Partnership with
&
82.
04.3Angels
The age profile of angels varies widely. InFrance, the average angel investor is 62,
while in CEE countries they are 43.
Average age of businessangels
byregion
France
62
Austriaand Germany
55
Switzerland
55
Benelux
53
Northern Europe +UK
52
Southern Europe
NOTE:
50
Central & Eastern Europe
43
Based on a study performed by EBAN and
funded by the European commission,
'Understanding the nature and impact of the
business angels in funding research and
innovation', November 2017. The dataset
includes 592 angel respondents across
Europe.
0
10
20
30
40
50
60
70
Average age
CEE countries also have the largest proportion of women angel investors.
Share of angels (%)bycountry
and bygender
LEGEND
Switzerland
73%
27%
Bulgaria
24%
76%
Macedonia
24%
76%
% of women
% of men
Spain
NOTE:
Based on a study performed by EBAN and
funded by the European commission,
'Understanding the nature and impact of the
business angels in funding research and
innovation', November 2017. The dataset
includes 592 angel respondents across
Europe.
85%
15%
Slovenia
13%
Cyprus
12%
88%
Finland
11%
89%
Ukraine
10%
90%
Slovakia
10%
90%
Croatia
87%
8%
92%
Latvia 4%
Ireland
96%
96%
4%
0
10
20
30
40
50
60
70
80
90
100
%of business angels
We are also noticing an
increase in diversity within the
angel investor population, not
just in terms of gender with more
female investorsparticipating in
angel networks,but also in terms
of age and background profile of
the individuals beginning their
investor careers.
www.stateofeuropeantech.com
We are seeing consolidation of angel
investment activity in many countries in
Western Europe and strong expansion
into regions such as Central and Eastern
Europe and South Eastern Europe. We’re
also noticing an increase in diversity within
the angel investor population, not just in
terms of gender with more female investors
participating in angel networks, but also in
terms of age and background profile of the
individuals beginning their investor careers.
What has never changed in these years,
though, is the fundamental role played by
the angels in getting ideas to the market and
scaling up businesses in their early days.
82
81
Jacopo Losso
EBAN
Director of
Secretariat
with
In Partnership with
&
110
83.
04.3Angels
Atomico AngelInvestor Programme
The first Atomico angels cohort has invested into 42 companies to
date, mostly in climate tech, and 45% of investments have been into
female founded companies.
RoxanneVarza
RohanSilva
GregoryGazagne
SuviHaimi
Station F,France
Second Home,UK
Criteo,France
Sulapac, Finland
TuvaPalm
DoreenHuber
EmilyBrooke
JohanBrand
NordNet,Sweden
Lemoncat, Germany
Beryl, UK
We Are Human, Norway
JosefinLandgard
ClareJohnston
StefanoBernardi
RituJain
Kry, Sweden
The Up Group, UK
Token Economy, Italy
LifeX, Denmark
We started Atomico’s inaugural angel programme last year with 12
angels from across the European ecosystem. Theyreceived no guidance
about sectors. Currently, 34%of the deals have been in startups with an
environmental impact,and 34% of the deals are with female founders.
This just goes to show that a diverse set of people becoming angels –
whether that is through capital earned at a successful tech company
or through angel programmes –is key to increasing the diversity gap in
funding and supporting solutions to big societal problems.
www.stateofeuropeantech.com
83
SophiaBendz
Atomico
Partner
In Partnership with
&
84.
04.3Angels
Repeat founders with significant experience in scaling a company are much
more likely to use angel investments for initial financing of their company.
How did you nance the initial
setup and earliest phase ofyour
most recent company?
40
37%
% ofrespondents
30
27%
25%
20
10
0
Repeat founder with limited experience in scaling Repeat founder with significant experience in scaling
company
company
First-time founder
NOTE:
Founders only. Respondents could select
multiple options.
‘Super angel’ investors and venture capital investors have similar investment
selection criteria. Venture capital investors are more focussed on exit potential,
while ‘super angels’ are more interested in valuation and deal terms.
Investment selection criteriaby
angels andVCs
85%
84%
Managment team
55%
56%
Technology/product's value proposition
45%
Scalabilityof the business
L EGEND
32%
Market size (actual or potential)
% of angels
Valuation and deal terms
% ofVCs
18%
Referral by other investors
Past performance
12%
5%
10%
10%
5%
6%
ESG considerations
0
Angel data are based on the EIF BA Survey, a
survey of 60 angel investors or 65% of the
‘European Angels Fund’ programme
population at the time the survey was
conducted. VC data is based on the EIF VC
Survey 2019.
34%
13%
4%
Strategic fit in investment portfolio
NOTE:
22%
12%
Exit potential
50%
37%
10
20
30
40
50
60
70
80
90
% of respondents
Angel investors spend a significant amount of time supporting
founders every month. They spend most of their time giving general
advice, followedclosely by operationalcontributions.
Angels' median time spentper
month on theirportfolio
10
NUMBER OFINVESTMENTS
3
is the median number of investments made by
angel investors over the past 12months.
10h
hours spent per month
8h
8
5h
5
5h
4h
3
0
NOTE:
Advice
Board activities
Support with introductions
Operational contributions
Financial intermediation
Based on EBAN survey respondents
including 90 different angels across Europe
in 2019.
www.stateofeuropeantech.com
84
In Partnership with
&
85.
04.3Angels
Still, on average angel investors are likely to say they participate in board
activities and leverage their network with introductions more than on
operationalcontributions.
How are angels typicallyinvolved
with companies they investin?
Advice
92%
Board activities
78%
Support with introductions
73%
Operational contributions
59%
Financial intermediation
59%
0
10
20
40
30
50
60
70
80
90
100
% of respondents / median time spent (hours/month)
NOTE:
Based on EBAN survey respondents
including 90 angels across Europe in 2019.
Regarding specific ‘hot topic’ sectors, angel investors are most excited about
artificial intelligence, e-commerce and digital health, but a number of angel
investors are also actively investing in sustainability and cleantech.
Share of VC and angel investors
(%)with portfolio companies in
selected sectors
68%
Artificial intelligence/machine learning
76%
68%
E-commerce
55%
LEGEND
% of angels
52%
Digital health
58%
% of VCs
47%
Fintech
56%
38%
Deep tech
56%
30%
Energy efficiency/renewable energy
36%
23%
Cybersecurity
35%
18%
Social economy
23%
17%
Agriculture/bio-economy
31%
17%
Blockchain technology
23%
7%
Dual use (civi/defense) technologies
14%
5%
Blue economy/sustainable use of maritime resources
9%
0%
Space
10%
0
NOTE:
10
20
30
40
50
60
70
80
%ofrespondents
Angel data are based on the EIF BA Survey, a
survey of 60 angel investors or 65% of the
‘European Angels Fund’ programme
population at the time the survey was
conducted. Source for VC data: Botsari, A.,
Crisanti, A., and Lang, F. (2019).
www.stateofeuropeantech.com
85
In Partnership with
&
86.
04.3Angels
Angels tell us the lack of favourable tax systems is a barrier to investing.
Over 30% of respondents picked this element as the most important
consideration out of 17options available.The EIS/SEIS scheme introduced
in the United Kingdom has been an incredibly effective tool to attract angel
investments into the country.
Top 10most underdeveloped
elements forangel investing
Favourable tax systems
VC funds for follow-on rounds
LEGEND
Most important
Second most important
Third mostimportant
Vibrant start-up hubs
Capital market integration across borders
Regulatory framework
General economicconditions
Involvement of corporate investors
Highly experienced VC funds
Cultural attitude towards entrepreneurship
R&D environment
0
5
10
15
20
25
30
35
40
45
50
% of respondents who ranked these different considerations in top 3
NOTE:
Based on the EIF BA Survey, a survey of 60
angel investors or 65% of the ‘European
Angels Fund’ programme population at the
time the survey was conducted.
Photoby:Jussi Hellsten
www.stateofeuropeantech.com
86
In Partnership with
&
55
87. Diversity & Inclusion
05Diversity &Inclusion
Does European tech still lack diversity and inclusion?
Despiteincreasedawareness alackof diversity,theproblemremains
entrenched. There is only one woman CTO among a sample of VCbackedtech companies. Nearlya quarterofpeople inthe ecosystem
say they’ve experienced discrimination on factors from ethnicity to
age. Some initiatives - such as more organisations serving talent
from underrepresented backgrounds - give hope, but change will
require a concerted effort from everyone in the ecosystem.
www.stateofeuropeantech.com
87
In Partnership with
&
88. 05.1 State of D&I in European Tech
05.1State of D&Iin EuropeanTech
Oursurveypolledover 1,200 Europeantech founders andaskedthemtoselfidentifybasedonanumberofcharacteristics, includinggender, ethnicity,
educationandtheirfinancialstatuspriorto founding theircompany. Wealsoasked
these founders tosharewhethertheyhadraisedexternalfundingorwhetherthey
hadbootstrappedtheircompanies. Whilethisdatasethaslimitations, itprovides
aninterestinginsightintowho Europe’sfounders areandwho’sraisedfunding.
Basedonthisdata, 21%ofall founders whorespondedarewomen,thoughthey
makeuponly 15%of founderrespondentswhohaveraisedexternalcapital.
Share of founder respondents
(%)who have raised external
funding by self-identi edgender
Women
Men
LEGEND
All founders
Non-Binary
Alreadyraised external capital
Bootstrapped todate
Other
Prefer not to say
NOTE:
Share of founders who reported having
already raised external capital (of any
amount) versus reporting having
bootstrapped their companies. Excludes
founders who responded 'Other'. Founder
respondents only. Numbers may not add to
100 due to rounding.
0.0
10.0
20.0
30.0
50.0
40.0
60.0
70.0
80.0
90.0
% of respondents
Ifwelookatthecompositionofthe founder respondentsbasedonself-reported
ethnicity,wefoundthat84%ofallfoundersidentifiedas White/Caucasian.Only0.9%
ofall founder respondentsself-identifiedas Black/African/Caribbean, andthose
respondentsmadeuponly 0.5%ofallfounderswhohaveraisedexternalcapital.
Share of founderrespondents
(%)who have raised external
funding by self-identi ed
ethnicity
LEGEND
All founders
Alreadyraised external capital
Bootstrapped todate
Asian
Black/African/Caribbean
Caucasian/White
Hispanic/Latinx
Middle Eastern/NorthAfrican
Mixed
Other
NOTE:
Prefer not to say
0.0
Share of founders who reported having
already raised external capital (of any
amount) versus reporting having
bootstrapped their companies. Excludes
founders who responded 'Other'. Founder
respondents only. Numbers may not add to
100 due to rounding.
www.stateofeuropeantech.com
10.0
20.0
30.0
40.0
50.0
60.0
70.0
80.0
90.0
% of respondents
88
In Partnership with
&
89.
05.1State of D&I in European Tech
Ifwe look at the highest educationalattainment of the founder respondents to the survey, 82.3%
of all founders reported having a university education (bachelor’sdegree or higher), compared to just
35%of the EU-28 population aged 25-54 who have attained tertiary education or higher,according to
Eurostat. Examining the share of founders who have raised external capitalor are bootstrapped, there
are observed differences between founders who have a university education or not.
Share of founderrespondents
(%)who have raised external
funding by education
background
82.3%
University educated
85.9%
79.7%
LEGEND
All founders
17.7%
Alreadyraised external capital
Bootstrapped todate
No university education
14.1%
20.3%
NOTE:
0.0
10.0
20.0
30.0
40.0
50.0
60.0
70.0
80.0
90.0
% of respondents
Share of founders who reported having
already raised external capital (of any
amount) versus reporting having
bootstrapped their companies. Excludes
founders who responded 'Other'. Founder
respondents only. Numbers may not add to
100 due to rounding.
We’rebeginning to see the industry pay attention to other intersections beyond
gender, such as race, class, ability and more. This intersectional approach
supports and celebrates individuals who have multiple identities, such as black
women. Over the past couple of months, there have been a number of initiatives
supporting these underrepresented groups, such as EITFood Change Makers
Programme; a two-day hackathon for women and people of colour in the
agricultural sector and Included VC; a 12-month venture capital fellowship group
for marginalised communities, such as veterans and refugees.
DeborahOkenla
YSYS
Founder & CEO
The survey asked founders to share details of their financial situation immediatelyprior to starting
their company to provide an insight into the financial background of European tech founders.
According to the responses shared, 80%of all founders stated they lived comfortably or at levels that
left disposable income once basicexpenses were met. This compares to 39%of the EU-28 population
that live easily, fairly easily or very easily, according to Eurostat. Again, looking at any variance
between the share of founders based on whether they have raised external funding or not, there is also
an observable difference between founders based on their self-reported prior financial situation.
Share of founder respondents
(%)who have raised external
funding by prior nancial status
before startingcompany
Lived comfortably
Met basic expenses with some left over for extras
LEGEND
Just met basic expenses
All founders
Alreadyraised external capital
Bootstrapped todate
Struggled to meet basic expenses
Didn't have enough to meet basic expenses
Rather not say
NOTE:
0.0
Share of founders who reported having
already raised external capital (of any
amount) versus reporting having
bootstrapped their companies. Excludes
founders who responded 'Other'. Founder
respondents only. Numbers may not add to
100 due to rounding.
www.stateofeuropeantech.com
10.0
20.0
30.0
40.0
50.0
60.0
% ofrespondents
89
In Partnership with
&
90.
05.1State of D&I in European Tech
D&Iand investment data: the limitations
If you have access to, or suggestions for, data sets which would
help us tell this story, please email research@atomico.com.
Funding for all women teams is actually going down.There
is no material improvement in the share of capital invested
in European tech companies going to diverse founding
teams. Infact, the share of capital invested in companies
founded by women decreased in 2019 versus 2018. This
means that in 2019, $92 in every $100 invested in Europe
went to founding teams that were all men.
Share of capital raised anddeals
(%)by founding team gender
composition
CAPITAL RAISED BY FOUNDING TEAMGENDER
$92 in every$100
invested in Europe went to founding teams that were all men
CAPITALRAISED
100.0
89.0%
LEGEND
91.7%
90.4%
89.1%
91.6%
Men
Mixed
%of capital raised / deals
75.0
Women
50.0
25.0
9.5%
8.4%
0.0
7.0%
2.5%
1.5%
2015
2016
8.0%
6.8%
2.6%
1.4%
2017
0.4%
2018
2019
DEALS
86.7%
85.4%
86.2%
86.9%
85.5%
%of capital raised / deals
75.0
50.0
25.0
10.8%
9.9%
3.9%
0.0
2015
2016
4.0%
2017
11.0%
10.6%
9.9%
3.3%
3.9%
2018
2.1%
2019
NOTE:
All Dealroom.co data excludes the following:
biotech, secondary transactions, debt,
lending capital, grants. Please also note the
data excludes Israel. 2019 annualised based
on data to September 2019.
www.stateofeuropeantech.com
90
In Partnership with
&
91.
05.1State of D&I in European Tech
The gender diversity of founding teams varies according to the size of the round. There is a greater
level of diversity at round sizes of less than $10M,though it is notable that there has not been any
material change in the trends over recent years. It’s also notable that larger rounds are typically
raised by founding teams that are all men, and so the more these large rounds are raised, the greater
the dilutive impact on the overall share of capital raised by more gender diverse teams.
LEGEND
Men
<$10M
86%
86%
85%
85%
84%
75
% ofdeals
Share of deals (%)by roundsize,
year and founding team gender
composition
50
Women
Mixed
25
10%
0
10%
13%
12%
10%
4%
4%
4%
5%
3%
2015
2016
2017
2018
2019
$10M-$20M
100
92%
94%
90%
84%
82%
% ofdeals
75
50
25
15%
0
13%
4%
4%
2015
2016
8%
7%
6%
2%
2%
0%
2017
2018
2019
$20M-$50M
100
92%
89%
91%
91%
82%
% ofdeals
75
50
25
15%
11%
5%
9%
3%
4%
0%
0
2015
2016
2017
9%
0%
0%
2018
2019
$50M-$100M
100
90%
75%
75
% ofdeals
94%
90%
89%
50
25%
25
11%
0
10%
10%
6%
0%
0%
0%
0%
0%
2015
2016
2017
2018
2019
$100M+
100%
100
100%
95%
92%
93%
% ofdeals
75
NOTE:
All Dealroom.co data excludes the following:
biotech, secondary transactions, debt,
lending capital, grants. Please also note the
data excludes Israel. 2019 annualised based
on data to September 2019.
www.stateofeuropeantech.com
50
25
8%
0
91
0%
0%
2015
2016
0%
5%
2017
7%
0%
0%
0%
0%
2018
In Partnership with
2019
&
92.
05.1State of D&I in European Tech
The share of rounds raised by more gender diverse founding teams varies
by country across Europe. Looking at the total distribution of deals raised
by founding teams since 2015, it is noteworthy that countries from Southern
Europe, such as Portugal or Italy, have seen greater diversity in the number
of rounds raised by teams composed of women or mixed-gender founders
compared with Nordic countries, such as Finland or Denmark.
Share of deals (%)by founding
team gender composition and
country, 2015-2019
Czech Republic
Italy
LEGEND
Men
Portugal
Mixed
Women
Spain
UnitedKingdom
Germany
Sweden
Russia
Switzerland
Ireland
Finland
France
Belgium
Denmark
Netherlands
Poland
0
10
20
30
40
50
60
70
80
90
100
% of deals
NOTE:
All Dealroom.co data excludes the following:
biotech, secondary transactions, debt,
lending capital, grants. Please also note the
data excludes Israel. 2019 based on data to
September 2019.
What kind of progress do Ithink the European tech
community has made towards increasing diversity
and inclusion in the past 12months? The slow kind.
SteveO'Hear
TechCrunch
Journalist
www.stateofeuropeantech.com
92
In Partnership with
&
93.
05.1State of D&I in European Tech
It's particularly notable that, when looking at the evolution of the share of deals by the gender
composition of founding teams over time in different European countries, there's been minimal
movement in recent years in almost all countries.
UNITEDKINGDOM
TASET: UNITED KINGDOM
Share of deals (%)by founding
team gender composition and
country
100
86%
85%
LEGEND
NOTE:
Men
Mixed
% of deals
All Dealroom.co data excludes the following:
biotech, secondary transactions, debt,
lending capital, grants. Please also note the
data excludes Israel. 2019 based on data to
September 2019.
Women
89%
86%
85%
75
50
25
10%
0
BELGIUM
88%
87%
2015
2016
2017
2018
9%
2%
2019
94%
93%
97%
89%
75
% of deals
% of deals
6%
89%
85%
75
50
25
50
25
15%
14%
2%
0%
0
2015
11%
7%
5%
2016
5%
9%
0%
3%
2017
0
2019
2018
FINLAND
2%
2%
2015
2016
4%
6%
0%
4%
2017
7%
0%
2019
2018
FRANCE
100
100
89%
87%
90%
87%
89%
88%
86%
75
90%
87%
86%
75
% of deals
% of deals
5%
100
93%
86%
50
25
50
25
14%
10%
0
3%
4%
2015
2016
8%
7%
9%
5%
5%
5%
0%
2017
2018
0
2019
GERMANY
13%
10%
9%
8%
3%
2%
3%
2%
2%
2015
2016
2017
2018
2019
IRELAND
100
100
89%
87%
87%
85%
83%
90%
88%
88%
83%
75
75%
75
% of deals
% of deals
5%
DENMARK
100
50
25
50
25
14%
3%
0
10%
10%
9%
5%
2015
14%
13%
10%
13%
15%
12%
6%
2%
1%
1%
0%
2016
2017
2018
2019
www.stateofeuropeantech.com
0
93
0%
2015
2016
10%
10%
9%
8%
4%
2%
2017
2018
In Partnership with
2019
&
94.
www.stateofeuropeantech.comIn Partnership with
&
95.
05.1State of D&I in European Tech
Looking across industries, there are significant differences in the distribution of rounds
to founding teams of different gender compositions. Industries such as health and food show
a higher level of founding team diversity.
Share of deals (%)by founder
team gender and industry,20152019
MOST GENDERDIVERSE
100
16%
17%
18%
18%
20%
21%
22%
22%
23%
30%
36%
42%
75
Men
Women +mixedgender
% ofdeals
LEGEND
50
84%
83%
82%
82%
80%
79%
78%
78%
77%
70%
64%
58%
25
0
LEASTGENDER DIVERSE
100
7%
7%
9%
9%
10%
11%
12%
12%
13%
14%
14%
16%
93%
93%
91%
91%
90%
89%
88%
88%
87%
86%
86%
84%
% ofdeals
75
50
25
0
NOTE:
All Dealroom.co data excludes the following:
biotech, secondary transactions, debt,
lending capital, grants. Please also note the
data excludes Israel.
There are other reasons to be optimistic that greater diversity can be achieved across all industry
verticals. Inquantum computing, for example, a rapidly growing deep tech sub-sector, we found that
23%of European quantum companies had a mixed or woman-led founding team, more than double
the European average of 13%.
Share of deals (%)in quantum
companies by founding team
gender composition,2015-2019
Europe
77%
23%
LEGEND
Men-only teams
83%
NorthAmerica
17%
Mixed gender and women-only teams
Global
NOTE:
0
10
Based on a sample of 85 companies globally
of which 35 are in North America and 44 in
Europe. All Dealroom.co data excludes the
following: biotech, secondary transactions,
debt, lending capital, grants. 2019 YTD is as
ofOctober 2019.
www.stateofeuropeantech.com
19%
81%
20
30
40
60
50
70
80
90
% ofdeals
95
In Partnership with
&
100
96.
05.1State of D&I in European Tech
The fact that Quantum is more inclusive should not be a surprise given the
large proportion of women scientists and engineers in Europe. Womenactually
account for more than half of the population of scientists and engineers in
Lithuania, Bulgaria, Latvia and Denmark.
Share of women scientistsand
engineers (%)in Europe by
country
Lithuania
43%
57%
Bulgaria
48%
52%
Latvia
48%
52%
Denmark
49%
51%
LEGEND
Men
Women
Portugal
50%
Ireland
51%
49%
Poland
51%
49%
Romania
51%
49%
50%
Spain
52%
48%
Sweden
52%
48%
54%
Austria
46%
Croatia
55%
Belgium
56%
45%
44%
57%
Slovenia
43%
EU-28
59%
41%
Estonia
59%
41%
United Kingdom
59%
41%
France
60%
Czech republic
61%
39%
Greece
61%
39%
Slovakia
61%
39%
40%
Netherlands
62%
Malta
63%
38%
37%
Italy
66%
Germany
67%
Luxembourg
69%
Hungary
70%
Finland
71%
0
10
20
30
34%
33%
31%
30%
29%
40
50
60
70
80
90
% of women scientists and engineers
NOTE:
Data is sourced from Eurostat and gathered
by CERN.
The quality and diversity of talent in deep tech fields are also evident when
looking at the gender composition of the student population of Europe's
leading technical universities, which rank amongst the highest-rated globally
for engineering and technical qualifications. These institutions have female
participation levels in terms of share of students that are typically far higher
than European tech industry benchmarks.
Share of female students(%)and
rank of select European
universities among global top
100in engineering and
technology
NOTE:
Rank refers to position in global list of top
100 institutions for engineering and
technology quali cations. Includes 1,008
universities across the world. Share of
females refers to share of female students
attending the university.
www.stateofeuropeantech.com
University
Country
Female Share (%)
88
TU Dresden
Germany
42
25
Technical University of Munich
Germany
34
60
Technical University of Berlin
Germany
34
62
KTH Royal Institute of Technology
Sweden
33
8
ETH Zurich
Switzerland
32
30
RWTH AachenUniversity
Germany
32
71
Chalmers University of Technology
Sweden
32
69
Technical University of Denmark
Denmark
30
21
Delft University of Technology
Netherlands
29
19
École Polytechnique Fédérale de Lausanne
Switzerland
28
74
Karlsruhe Institute of Technology
Germany
28
96
In Partnership with
&
100
97.
05.1State of D&I in European Tech
We revisited prior analysis exploring the gender
composition of the leadership teams of European tech
companies that raised a Series A or Series B round in the
past 12months and found that men continue to account for
the overwhelming majority of executives in Cx0 positions.
For example, there was only one CTO that is a woman out
of more than 119 CTOs in the sample set. Executive roles
in Finance, Marketing and Operations are most likely to be
filled by women.
Gender composition byC-level
title
Chief TechnologyOfficer
Women
97%
95%
5%
7%
Chief Revenue Officer
93%
9%
91%
Chief Financial Officer
16%
CxOOther
17%
Chief MarketingOfficer
84%
83%
18%
Chief Operating Officer
NOTE:
82%
79%
21%
0
10
20
30
40
Based on a sample of executives in CxO
positions at 251 European VC-backed tech
companies that raised a Series A or B round
between 1October 2018 and 30 September
2019 with more than $10M funding.
Share of women (%)by
executive-level positions of
selected European Series A and
B venture-backed companies
2018
2019
www.stateofeuropeantech.com
80
1
90
100
1woman CTO out of 119CTOs
working at VC-backed European
tech companies that raised a
Series A or B in the past year with
more than $10Mof funding.
9%
9%
8%
8
6%
6%
6%
5%
5
3
0
Based on a sample of founders and
executives in CxO positions at 382 European
VC-backed tech companies that raised a
Series A or B round between 1October 2018
and 30 September 2019.
70
WOMANC-LEVEL EXECUTIVE
5%
5%
2%
1%
NOTE:
60
10
%of women by executive-level position
2017
50
% of Executives
We have now produced this analysis across
three cohorts of companies since 2017, and there has
been no positive change in either the gender composition
of founders and CEO's, or at the full executive leadership
teams. Infact, the numbers declined slightly in 2019.
Women made up just 8%of all leaders in CxO positions in
the 'class of 2019' cohort, versus 9%in the previous two
cohorts analysed.
LEGEND
For every woman executive,
there are 12men executives.
99%
Chief Product Officer 3%
Chief Scientific Officer
Men
1in12
1%
Chief ExecutiveOfficer
LEGEND
GENDER COMPOSITIONINEXECUTIVE-LEVEL
POSITIONS
% of CEOs
%of CTOs
97
1%
%of founders
In Partnership with
%of all CxO leaders
&
98.
05.1State of D&I in European Tech
Though there is a near absence of women in technical leadership positions
within European venture-backed tech companies, there is not an absence
of developer talent with significant experience in either gender.
Experience and gender
breakdown ofprofessional
developers inEurope
MEN
<5years
22%
5 to 9 years
30%
10 to14 years
18%
15 to 19 years
13%
20+years
16%
0
3
5
8
10
13
15
18
20
23
25
28
30
33
% of respondents
NON-BINARY
<5years
28%
5 to 9 years
30%
10 to14 years
21%
15 to 19 years
11%
20+years
10%
0
3
5
8
10
13
15
18
20
23
25
28
30
33
% of respondents
WOMEN
<5years
40%
5 to 9 years
32%
10 to14 years
13%
8%
15 to 19 years
20+years
7%
0
5
10
15
20
25
30
35
40
45
% ofrespondents
NOTE:
Based on Stack Over ow's 2019 survey.
Experience relates to years since learning to
code.
www.stateofeuropeantech.com
98
In Partnership with
&
99.
05.1State of D&I in European Tech
Lookingonacountry-by-countrybasisattheexperiencelevelofthe Europeandeveloperbase, anumber
ofcountriesstandoutwithamaterialshareofwomendeveloperswithmorethan 15 yearsofexperience.
Top 5 countries by share of
women developers with over15
years of experience
29%
Finland
36%
22%
United Kingdom
38%
LEGEND
Women
17%
Germany
30%
Men
13%
France
23%
9%
Sweden
39%
0
5
10
15
20
25
30
35
40
% ofrespondents
NOTE:
Based on Stack Over ow's 2019 survey.
Though there is a difference of opinion over how meaningful these steps that have been taken have
been, VC respondents shared that they have made changes to the way they source new investment
opportunities over the last 12 months. The most frequently cited changes by respondents were
diversifying their networks of partner funds and angel investors, while the least frequently cited
changes were running open office hours and responding positively to cold inbound opportunities.
Inthe last 12months, have you
made any changes to how you
source new investment
opportunities?
LEGEND
Diversify network of partner funds
Diversify network of angel investors
Attend events with stronger participation from diverse
founders
Organise events for diverse founders
Increased focus
Decreased focus
Focus on sectors with greater founder diversity
Stayed the same
Run open office hours
Respond to cold inbound opportunities
0
10
20
30
40
50
60
70
80
90
% of respondents
NOTE:
Venture capitalists only. Numbers may not
add to 100 due to rounding.
If investors are more
representative of
society's diversity, we will
reach a more diverse set
of entrepreneurs.They,in
turn, can create a whole
range of companies and
services that we havenot
previously thought of.
www.stateofeuropeantech.com
92% of all funding went to all-men teams this year,
which is not much better than last year. It’s obvious that
capital is not being allocated in a way that reflects our
society or encourages a broader set of people to become
entrepreneurs. Diversity of all kinds is lacking in our
ecosystem. I am passionate about changing the status
quo, and increasing diversity at VC funds is one important
piece to encourage more diverse founders. If investors
are more representative of society's diversity, we will
reach a more diverse set of entrepreneurs, we will reach
more diverse entrepreneurs. They, in turn, can create a
whole range of companies and services that we have not
previously thought of.
99
SophiaBendz
Atomico Partner
In Partnership with
&
100
100.
05.1State of D&I in European Tech
Given these static numbers, it's important to examine the steps that investors
have taken to try to improve the diversity of the founders they invest in. Venture
capitalist respondents to the survey were divided over whether the European
VC industry has taken meaningful steps to improve the diversity of the founders
they back. In fact, for this particular question, there was a greater level of
divergence of opinion between the VC respondents than for all other questions
where VCs were asked to share their sentiment on major industry issues.
39%
40
37%
30
% ofrespondents
Thinking about the past 12
months, do you agree or
disagree with the following:
European VCs have taken
meaningful steps toimprove the
diversity of the founders they
back
24%
20
10
0
Agree
NOTE:
Disagree
Neither agree nor disagree
Venture capitalists only. Numbers may not
add to 100 due to rounding.
I think we have made huge steps in understanding and
admitting the problem. Now, action will be key. In the
words of Alan Turing, 'wecan only see a short distance
ahead,but we can see plenty there that needs to be done'.
SurangaChandratillake
BaldertonCapital
General Partner
We found important differences in the changes to sourcing activities reported
by VC respondents who were men and women that suggests the focus on
improving diversity is itself not equally shared. For example, 63% of VC
respondents who are women said they had increased their focus on attending
events with stronger participation from diverse founders, compared to just 36%
of respondents who are men.
100
Inthe last 12months, have you
made any changes to how you
source new investment
opportunities?
Increased focus
% ofrespondents
LEGEND
75
50
Decreased focus
Stayed the same
25
0
Women
Men
NOTE:
Venture capitalists only. Numbers may not
add to 100 due to rounding.
www.stateofeuropeantech.com
100
In Partnership with
&
101.
05.1State of D&I in European Tech
We also found large differences between men and women when it came
to sourcing activities such as running open office hours or focusing on
sectors with greater founder diversity.
Inthe last 12months, have you
made any changes to how you
source new investment
opportunities?
70%
Diversifynetwork of partner funds
64%
63%
Attend events with stronger participation from diverse
founders
36%
56%
Diversify network of angel investors
LEGEND
Increasedfocus (women)
53%
51%
Organise events for diverse founders
40%
Increased focus (men)
45%
Focus on sectors with greater founder diversity
28%
38%
Run open office hours
21%
23%
Respond to cold inbound opportunities
16%
0
10
20
30
40
50
60
70
% of respondents
NOTE:
Venture capitalists only. Respondents that
answered 'Increased focus' only. Numbers
may not add to 100 due to rounding.
It's important context to show the level of female representation within the VC
industry. Diversity VC's data shows that VC funds in the UK have improved the
representation of women at junior levels, but there has not been any material
change in the share of women venture professionals at more senior levels, with
no movement at the partner level.
Share ofwomen investors by
seniority, 2017vs2019
40
37%
LEGEND
2017
%of woman investors
30
2019
29%
25%
26%
20
13%
13%
10
0
NOTE:
Junior (analyst, associate or equivalent)
Middle (principals or equivalent)
Senior (partner or equivalent)
Diversity VC analysis 2019. Based on a
sample of 987 and 1,436 venture
professionals in 2017 and 2019 respectively.
www.stateofeuropeantech.com
101
In Partnership with
&
80
102.
05.1State of D&I in European Tech
Tech startups and scale ups are taking action to
improve diversity and inclusion but there is still
work to be done in terms of adopting D&Ipolicies
and implementing training programmes.
Inthe last 12months, has your
company taken any of the
following actions to improve
diversity andinclusion?
LEGEND
Already actioned
Yes
No
FOUNDERS & TECH/SCALEUPEMPLOYEES
Introduced more flexible working arrangements (e.g.
remote working, flexiblehours
Introduced more generous maternity leave policies
Introduced more generous paternity leave policies
Introduced anti-harassment code of conduct
Introduced specific diversity and inclusionhiring policies
Offered relevant training for employees (e.g.
unconscious bias training)
Introduced specific diversity and inclusiontalent
development programmes
Appointed a diversity & inclusionrepresentative
0
10
20
30
40
50
60
70
80
90
100
60
70
80
90
10
% of respondents
VENTURE CAPITALISTS
Introduced more flexible working arrangements (e.g.
remote working, flexiblehours
Introduced more generous maternity leave policies
Introduced more generous paternity leave policies
Introduced anti-harassment code of conduct
Introduced specific diversity and inclusionhiring policies
Offered relevant training for employees (e.g.
unconscious bias training)
Introduced specific diversity and inclusiontalent
development programmes
Appointed a diversity & inclusionrepresentative
0
NOTE:
10
20
30
40
50
% of respondents
Venture capitalists, founders and
startup/scaleup employees only. Numbers
do not add to 100 as respondents could
choosemultiple responses.
It's our responsibility to build an open and inclusive tech
ecosystem in Europe. We have taken the first step and
started a conversation aroundthe topic.Now we needa
firm commitment,actions and measures to moveforward,
as thereis clearly value to be captured throughdiversity.
Iwish more LPs wouldstart demandingventurecapitalists
to be the change theywantto see in the industry.
www.stateofeuropeantech.com
102
EkaterinaGianelli
Inventure Partner
In Partnership with
&
103.
05.1State of D&I in European Tech
Last year, our survey found that 46% of women working in the European tech industry had
experiencedsome form of discrimination at some point in the past. This year, we found that 38%of
respondents who are womenhad experienced some form of discrimination in just the past 12months.
Infact, almost half (49%)of all founders who are womenand more than 40% of founders from minority
ethnicgroups report having experienced some form of discrimination during the last 12months.
Inthe last 12months, have you
experienced any form of
discrimination while workingin
the European techindustry?
GENDER FOUNDERSONLY
100
% of respondents
75
LEGEND
Yes
No
51%
60%
85%
50
25
49%
40%
15%
0
Women
Men
Prefer not to say
ETHNICITY FOUNDERSONLY
% of respondents
100
75
56%
57%
58%
54%
55%
42%
46%
45%
MiddleEastern/North
African
Mixed
Other
64%
81%
50
25
44%
43%
36%
19%
0
Asian
Black/African/Caribbean Caucasian/White
Hispanic/Latinx
GENDER ALLRESPONDERS
100
% of respondents
75
62%
64%
85%
50
25
38%
36%
15%
0
Women
Men
Prefer not to say
ETHNICITY ALL RESPONDERS
% of respondents
100
75
60%
55%
67%
67%
63%
67%
67%
37%
33%
33%
Mixed
Other
Prefer not to say
81%
50
25
40%
45%
33%
33%
19%
0
NOTE:
Asian
Black/African/CaribbeanCaucasian/White
Numbers may not add to 100 due to
rounding.
www.stateofeuropeantech.com
103
Hispanic/Latinx
Middle
Eastern/North
African
In Partnership with
&
104.
05.1State of D&I in European Tech
Discrimination in the European tech industry takes many forms. Women
respondents most commonly report having experienced gender-based
discrimination, while men most commonly report age-based discrimination.
The survey can't accurately quantify the level of discrimination based on all
forms of discrimination (for example, disability or sexual orientation), but the
data points to these being very prevalent here too.
What kind of discriminationhave
youexperienced?
Gender
Age
Nationality
LEGEND
Women
Language
Men
Ethnicity
Education
Socio-economic status
Sexual orientation
Disability
Religion
0
NOTE:
10
20
30
40
60
50
70
80
90
% of respondents
Respondents who reported having
experienced some form of discrimination
only. Numbers may not add to 100 as
respondents could select multiple choices.
Respondents who self-identified as belonging to different minority ethnic
groups also reported different experiences of discrimination while working in
the European tech industry. For example, 80% of respondents that said they
had experienced a form of discrimination in the past 12months while working in
the European tech industry and that self-identified as Black/African/Caribbean
reported they had experienced discrimination on the basis of their ethnicity.
ASIAN - KIND OFDISCRIMINATION EXPERIENCED
Gender
BLACK /AFRICAN /CARIBBEAN - KIND OF DISCRIMINATIONEXPERIENCED
Gender
23%
Age
Nationality
Ethnicity
Education
8%
Education
Socio -economic status
8%
Socio -economic status
0%
0%
10%
Sexual orientation
2%
Religion
80%
Language
38%
0%
Religion
4%
Disability
10%
Ethnicity
65%
L anguage
40%
Nationality
35%
Sexual orientation
30%
Age
29%
0%
Disability
2%
0
10
20
30
40
50
60
10%
0
70
10
20
30
40
CAUCASIAN /WHITE -KIND OF DISCRIMINATIONEXPERIENCED
1%
Disability
1%
0
7%
Socio -economic status 0%
7%
Sexual orientation
5%
Religion
21%
Education
6%
Sexual orientation
21%
L anguage
15%
8%
Socio -economic status
43%
Ethnicity
L anguage
90
36%
Nationality
11%
Education
80
50%
Age
24%
Ethnicity
70
Gender
61%
44%
Nationality
60
HISPANIC /LATINX - KIND OF DISCRIMINATIONEXPERIENCED
Gender
Age
50
% of respondents
% of respondents
Religion
7%
Disability 0%
5
10
15
20
25
30
35
40
45
50
55
60
65
0
70
www.stateofeuropeantech.com
5
10
15
20
25
30
35
40
45
50
% of respondents
% of respondents
104
In Partnership with
&
55
105.
106. 05.2 Industry Sentiment on D&I
05.205.1
State of D&I in European Tech
Industry Sentiment onD&I
The survey included a large number of questions exploring industry sentiment on a range of different
issues related to progress on building a more diverse and inclusive European tech industry in the
past 12 months. There is strong agreement in the European tech and VC community about the
importance of creating a more diverse and inclusive industry. While many feel better informed and
more empowered to take actions towards this goal and have changed their behaviours accordingly,
it's also clear that for many the industry is a long way from creating equal opportunity for people of all
demographics,backgrounds and experiences.
Do you agree or disagreewith
the followingstatements?
LEGEND
NOTE:
Venture capitalists, founders and
startup/scale-up employees only.
Numbers may not add to 100 due to
rounding.
Agree
Disagree
Neither agree nor disagree
THE EUROPEAN TECH ECOSYSTEM PROVIDES EQUAL OPPORTUNITY FOR PEOPLE
OF ALL DEMOGRAPHICS, BACKGROUNDS AND EXPERIENCES
100
100
75
75
% of respondents
% of respondents
THE FOCUS ONCREATING A MOREDIVERSE AND INCLUSIVE EUROPEAN TECH
ECOSYSTEM ISIMPORTANT
50
25
0
25
Founder or employee at a tech startup/scale-up
0
Venture Capitalist
THE EUROPEAN TECH ECOSYSTEM HAS MADE MEANINGFULPROGRESS IN
IMPROVING ITS LEVELOF DIVERSITY AND INCLUSION
% of respondents
% of respondents
25
50
25
Founder or employee at a tech startup/scale-up
0
Venture Capitalist
IFEEL MORE EMPOWERED TO TAKE POSITIVE STEPS TO IMPROVE DIVERSITY AND
INCLUSIONWITHINMY COMPANY COMPARED TO 12MONTHSAGO
100
100
75
75
50
Founder or employee at a tech startup/scale-up
Venture Capitalist
IHAVE CHANGED MYBEHAVIOUR AS A RESULT OFINCREASED FOCUSONDIVERSITY
ANDINCLUSION
% of respondents
% of respondents
Venture Capitalist
75
50
25
0
Founder or employee at a tech startup/scale-up
IFEEL BETTER INFORMED ONTHE TOPIC OFDIVERSITY AND INCLUSIONCOMPARED
TO 12MONTHSAGO
75
0
50
50
25
Founder or employee at a tech startup/scale-up
www.stateofeuropeantech.com
0
Venture Capitalist
106
Founder or employee at a tech startup/scale-up
Venture Capitalist
In Partnership with
&
107.
www.stateofeuropeantech.comIn Partnership with
&
108.
05.2Industry Sentiment on D&I
It's also clear that the experience of working in the European tech industry varies greatly based on
background. For example, respondents from minority ethnic groups are much less likely to believe
that the industry has made meaningful progress towards being more diverse and inclusive and much
less likely to believe that it provides equal opportunity for all.
Do you agree or disagreewith
the followingstatements?
NOTE:
Numbers may not add to 100 due to
rounding.
LEGEND
Agree
Disagree
Neither agree nor disagree
THE EUROPEAN TECH ECOSYSTEM PROVIDES EQUAL OPPORTUNITY FOR PEOPLE
OF ALL DEMOGRAPHICS, BACKGROUNDS AND EXPERIENCES
THE EUROPEAN TECH ECOSYSTEM HAS MADE MEANINGFULPROGRESS IN
IMPROVING ITS LEVELOF DIVERSITY AND INCLUSION
Asian
Asian
Black/African/Caribbean
Black/African/Caribbean
Caucasian/White
Caucasian/White
Hispanic/Latinx
Hispanic/Latinx
Middle Eastern/North African
Middle Eastern/North African
Mixed
Mixed
Other
Other
0
10
20
30
40
50
60
70
80
90
100
0
10
20
30
40
% of respondents
50
60
70
80
90
100
% of respondents
THE FOCUS ONCREATING A MOREDIVERSE AND INCLUSIVE EUROPEAN TECH
ECOSYSTEM ISIMPORTANT
IFEEL BETTER INFORMED ONTHE TOPIC OFDIVERSITY AND INCLUSIONCOMPARED
TO 12MONTHSAGO
Asian
Asian
Black/African/Caribbean
Black/African/Caribbean
Caucasian/White
Caucasian/White
Hispanic/Latinx
Hispanic/Latinx
Middle Eastern/North African
Middle Eastern/North African
Mixed
Mixed
Other
Other
0
10
20
30
40
50
60
70
80
90
100
0
10
20
30
40
% of respondents
50
60
70
80
90
100
% of respondents
IFEEL MORE EMPOWERED TO TAKE POSITIVE STEPS TO IMPROVE DIVERSITY AND
INCLUSIONWITHINMY COMPANY COMPARED TO 12MONTHSAGO
IHAVE CHANGED MYBEHAVIOUR AS A RESULT OFINCREASED FOCUSONDIVERSITY
ANDINCLUSION
Asian
Asian
Black/African/Caribbean
Black/African/Caribbean
Caucasian/White
Caucasian/White
Hispanic/Latinx
Hispanic/Latinx
Middle Eastern/North African
Middle Eastern/North African
Mixed
Mixed
Other
Other
0
10
20
30
40
50
60
70
80
90
100
0
% of respondents
www.stateofeuropeantech.com
10
20
30
40
50
60
70
80
90
% of respondents
108
In Partnership with
&
100
109.
05.2Industry Sentiment on D&I
Four in ten women and men believe there has been an increase in the past 12months, but more than
half felt things hadn't changed, including 56%of respondents who are founders of work in a tech
startup or scale-up. This sentiment is reflected at similar levels across respondents from all ethnic
groups too. Respondents from the UK were most likely to share the view that there has been an
increase in inclusiveness, while respondents from France and the Benelux were least likely to say
there has been an increase.
Thinking only about the last 12
months, have you experienced
any change in theinclusiveness
of the techindustry in Europe?
GENDER
Women
Men
LEGEND
Increase
Non-binary
Decrease
Nochange
Other
Prefer not to say
0
10
20
30
50
40
60
70
80
90
100
% of respondents
ETHNICITY
Asian
Black/African/Caribbean
Caucasian/White
Hispanic/Latinx
Middle Eastern/NorthAfrican
Mixed
Other
Prefer not to say
0
10
20
40
30
50
60
70
80
90
100
% ofrespondents
REGION
CEE
DACH
France & Benelux
Nordics
Rest of Europe
Southern Europe
UK & Ireland
0
10
20
30
40
50
60
70
80
90
100
% of respondents
OCCUPATION
Founder or startup/scale-up employee
Venture Capitalist
0
10
20
30
40
50
60
70
80
90
% ofrespondents
NOTE:
Numbers may not add to 100 due to
rounding.
www.stateofeuropeantech.com
109
In Partnership with
&
100
110.
05.2Industry Sentiment on D&I
When asked to share their sentiment on any change in the inclusiveness of the culture within their
own companies in the past 12months, the responses were similar to those based on the industrywide view. Half of all respondents said there had been no change in the past 12months, but 44%
were more positive and stated they had seen an increase in the inclusiveness of the culture at their
companies. Respondents based in the UK were most likely to have reported an increase.
Thinking only about the last 12
months, have you experienced
any change in theinclusiveness
of the culture atyour company?
LEGEND
GENDER
Women
Men
Non-binary
Increase
Decrease
Other
Nochange
Prefer not to say
0
10
20
30
50
40
60
70
80
90
100
% of respondents
ETHNICITY
Asian
Black/African/Caribbean
Caucasian/White
Hispanic/Latinx
Middle Eastern/NorthAfrican
Mixed
Other
Prefer not to say
0
10
20
40
30
50
60
70
80
90
100
% ofrespondents
REGION
CEE
DACH
France & Benelux
Nordics
Rest of Europe
Southern Europe
UK & Ireland
0
10
20
30
40
50
60
70
80
90
100
% of respondents
OCCUPATION
Founder or startup/scale-up employee
Venture Capitalist
0
10
20
30
40
50
60
70
80
90
% ofrespondents
NOTE:
Numbers may not add to 100 due to
rounding.
www.stateofeuropeantech.com
110
In Partnership with
&
100
111.
05.2Industry Sentiment on D&I
We asked respondents to share whether they felt more comfortable in bringing their whole selves
to work. A material share of respondents stated that they had increased comfort levels in this regard,
but there are also meaningful numbers of respondents who said they had felt no change or even
felt a decreased comfort level. For example. 10% of women and 16% of Black/African/Caribbean
respondents said they felt less comfortable over the last 12months.
Thinking only about the last 12
months, have youexperienced
any change regarding your
comfort level in bringing your
whole self to work inyour tech
company?
LEGEND
GENDER
Women
Men
Non-binary
Other
Increase
Decrease
Nochange
Prefer not to say
Mixed
0
10
20
30
50
40
60
70
80
90
100
% of respondents
ETHNICITY
Asian
Black/African/Caribbean
Caucasian/White
Hispanic/Latinx
Middle Eastern/NorthAfrican
Other
Prefer not to say
0
10
20
40
30
50
60
70
80
90
100
% ofrespondents
REGION
CEE
DACH
France & Benelux
Nordics
Rest of Europe
Southern Europe
UK & Ireland
0
10
20
30
40
50
60
70
80
90
100
% of respondents
OCCUPATION
Founder or startup/scale-up employee
Venture Capitalist
0
10
20
30
40
50
60
70
80
90
% ofrespondents
NOTE:
Numbers may not add to 100 due to
rounding.
www.stateofeuropeantech.com
111
In Partnership with
&
100
112.
05.2Industry Sentiment on D&I
Ithink we're rightly seeing more thought and attention being given
to diversity and inclusion. At Monzo we've taken a really important
step and hired our first head of diversity and inclusion, Sheree
Atcheson. Ifeel we're making progress in this space but there’s still
a long way to go.
TomBlomfield
Monzo CEO
The divided sentiment around progress on diversity and inclusion is also visible when asking
respondents to share their sentiment on the priority level at their companies to recruit, retain and
grow talent from diverse demographics, backgrounds or experiences. 45% of respondents who are
founders or working at tech startups and scale-ups reported an increase in priority level and 55%of
venture capitalist respondents. But, again,we found that more than four in ten respondents reported
they felt there had been no change in priority level.
Thinking only about the last 12
months, have you experienced
any change regarding thepriority
level of your company to recruit,
retain and grow talent from
diverse demographics,
backgrounds orexperiences?
GENDER
Women
Men
Non-binary
Other
LEGEND
Increase
Prefer not to say
Decrease
0
Nochange
10
20
30
50
40
60
70
80
90
100
% of respondents
ETHNICITY
Asian
Black/African/Caribbean
Caucasian/White
Hispanic/Latinx
Middle Eastern/NorthAfrican
Mixed
Other
Prefer not to say
0
10
20
40
30
50
60
70
80
90
100
% ofrespondents
REGION
CEE
DACH
France & Benelux
Nordics
Rest of Europe
Southern Europe
UK & Ireland
0
10
20
30
40
50
60
70
80
90
100
% of respondents
OCCUPATION
Founder or startup/scale-up employee
Venture Capitalist
NOTE:
Numbers may not add to 100 due to
rounding.
0
10
20
30
40
50
60
70
80
90
% ofrespondents
www.stateofeuropeantech.com
112
In Partnership with
&
100
113.
05.2Industry Sentiment on D&I
Inour experience hiring
in Europe, we assumed
there might have been
a challenge in terms of
gender diversity, but
this actually became an
advantage for us.
At Karma we're 60% female, which is unusual in a tech
company. And those women are across all teams, including
engineering and product. We feel extremely lucky to have
attracted this talent.
Another thing we had on our side was the level of English
spoken in Sweden; it was a clear advantage for us
expanding internationally. At Karma we spoke English
internally from the very beginning, even when all employees
were Swedish. Now that we have offices in 3 countries and
70 employees from over 20 countries, it's a no-brainer to
communicate in English.
Elsa Bernadotte
Karma
Co-Founder & COO
Despite large numbers of respondents reporting increases in the quantity of diverse talent hired into
their companies overall, far fewer respondents reported that the diversity of senior leadership in
their company had increased over the last 12months.
Thinking only about the last 12
months, have you experienced
any change regarding the levelof
diversity of senior leadership in
yourcompany?
GENDER
Women
Men
Non-binary
LEGEND
Increase
Other
Decrease
Nochange
Prefer not to say
0
10
20
30
50
40
60
70
80
90
100
% of respondents
ETHNICITY
Asian
Black/African/Caribbean
Caucasian/White
Hispanic/Latinx
Middle Eastern/NorthAfrican
Mixed
Other
Prefer not to say
0
10
20
40
30
50
60
70
80
90
100
% ofrespondents
REGION
CEE
DACH
France & Benelux
Nordics
Rest of Europe
Southern Europe
UK & Ireland
0
10
20
30
40
50
60
70
80
90
100
% of respondents
OCCUPATION
Founder or startup/scale-up employee
Venture Capitalist
NOTE:
Numbers may not add to 100 due to
rounding.
www.stateofeuropeantech.com
0
10
20
30
40
50
60
70
80
90
% ofrespondents
113
In Partnership with
&
100
114.
05.2Industry Sentiment on D&I
The net net is that there are still far too many
people who believe they must overcome
obstacles to be successful in the European
tech industry. 43%of women respondents and
more than 40% of respondents from minority
ethnic groups shared that they believe it is more
difficult to be successful in tech because of their
background and/oridentity.
Do you agree or disagree with
the following statement: Itis
more di cult for me to be
successful in tech because of my
background and/or identity
(socio-economic status, gender
and/or age)
LEGEND
Agree
GENDER
Women
Men
Non-binary
Disagree
Neither agree nor disagree
Other
0
10
20
30
40
50
60
80
70
90
100
% of respondents
ETHNICITY
Asian
Black/African/Caribbean
Caucasian/White
Hispanic/Latinx
Middle Eastern/NorthAfrican
Mixed
Other
Prefer not to say
0
10
20
30
40
50
60
70
80
90
% ofrespondents
NOTE:
Numbers may not add to 100 due to
rounding.
Ionly heard the concept
of 'part time' when I
moved out of Romania!
www.stateofeuropeantech.com
The CEE has more gender diversity in its tech workforce
than other regions in Europe. This is a 'side effect' of
the old communist regimes where it was the basis of
the society that both women and men worked equally.
Women often pursued careers in STEM fields, which
was encouraged due to the focus on industrialisation.
Iexperienced this firsthand as Iwas growing up in
Romania. It was natural for professional-age women to
work - most of our mothers worked full time as engineers,
entrepreneurs, doctors and lawyers, and took pride in
their careers. Ionly heard the concept of 'part time' when
Imoved out of Romania! They encouraged their children,
regardless of gender, to have educational and career
ambitions, and they provided role models. This doesn't
mean that there isn't work still to be done, including more
representation in key political roles, reporting of diversity
statistics and addressing pay gaps.
114
IrinaHaivas
Atomico Principal
In Partnership with
&
100
115. 05.3 Community-Led Change
We asked respondents to share their views on initiatives they believe have hadthe biggest impact on promoting or enabling greater diversity in the European
tech ecosystem. The most cited factors include better education on the topic,
greater awareness via media coverage and the impact of events focussed on
the topic of diversity and inclusion.
Inyour opinion, which initiatives,
if any, have had the biggest
impact in promoting or enabling
greater diversity and inclusion in
the European techecosystem?
Education & training
92
Media focus & coverage
60
D&I-focused events
45
Diversity reporting & measurement
42
Women in technology
39
#MeToo campaign
34
Diversity VC initiatives
3
2
Diversity policies
26
Equal treatment & pay focus
23
Inklusiiv
12
0
10
20
30
50
40
60
70
80
90
100
# ofmentions
NOTE:
Keyword analysis performed on open-ended
answers, similar spellings and keywords
aggregated.
Intuitively, it feels like diversity and inclusion have gained an increased level of
prominence in the news narrative around the European tech industry. But our
analysis of more than 450,000 tech-related articles published in the past year by
over 1,000 European news sources shows that diversity and inclusion actually
declined as a relative share of total news coverage, even though it increased in
absolute terms versus 2018. By contrast, the relative share of news coverage
focussed on topics such as fundraising or AIincreased in 2019.
Share of total tech news
narrative (%)by topic areaand
year
54%
Fundraising
56%
22%
LEGEND
Artificial Intelligence
22%
2018
2019
11%
Blockchain/crypto
12%
10%
Diversity & inclusion
9%
NOTE:
0
www.stateofeuropeantech.com
5
10
15
20
25
30
35
40
45
50
55
% ofstories
Based on ~5,460 stories across 1,094
European news sources from 1October 2017
to 30 September 2018 (2018data) and on
5,300 stories across 1,105European news
sources from 1October 2018 to 30
September 2019 (2019 data).
115
In Partnership with
&
60
116.
117.
05.3Community-Led Change
One of the most powerful reasons to be optimistic about the possibility of making and accelerating
positive change towards a more diverse and inclusive European tech ecosystem is the large and
growing number of initiatives working directly to achieve this goal. Last year, we included a list 28
initiatives identified by Diversity VC in just the UK alone. This year, Sifted has been able to identify
100 different initiatives from all across Europe.
Europeandiversityinitiativesandorganisationsbyregion
UK &IRELAND
Type of
Initiative
Scope
Country
Description
Django girls
Non-profit
Global
UK
Volunteer-run organization hosting hundreds of events across Europe and beyond teaching
women to build their first web application using HTML, CSS, Python and Django.
Xuntos
Community
Online
UK
A community for recent graduates and university students from underrepresented groups
in tech.
UK
Since Google's London Campus reopened earlier this year, it has focused on supporting
diversity. It regularly hosts #poctech meetups, Black and Good (a community for black
social innovators), Womxn, Series Q (a network for LGBTQ+ people at startups) and YSYS
events.
Googlefor
Startups
Community
Europe
Women Like Me
Meet-up
Local
UK
A collective for BAME women working and interested in STEAM due to the lack of
representation, support and progression for un derrepresented groups within tech. They
host monthly events that create safe spaces to discuss gender and racial issues across
London, using human-centred design methodologies.
Hustle Crew
Social
enterprise
Global
UK
A for-profit social enterprise working to promote inclusivity in the tech sector through
talks, training and mentorship.
TechHub
Accelerate
Coworking
Europe
UK
A new grant scheme from London co-work ing space and community TechHub. It is offering
free membership to 30 founders from underrepresented backgrounds to its business
support programme and workspace, along with access to its network of mentors and
investors.
Backstage
Accelerator
Accelerator
USA and
UK
UK
An accelerator programme for 'underestimated' founders, funded by US investor Arlan
Hamilton's firm Backstage Capital. The first cohort took p lace in London earlier this year,
with five companies graduating. Watch this space for future programmes.
ThisAbility
Consultancy
Local
UK
A consultancy, founded in 2016, which works to empower disabled creatives.
Diverse & Equal
Events
Local
UK
A two-day conference on diversity and inclusion, held in Manchester.
WTF Community
Events
Local
UK
WTF stands for Women's Tech Focus. A support network for women working in, or
interested in, technology. They organise events/workshops in London (…and soon
Amsterdam) and are looking to provide a safe place for sharing or getting advice.
UKBlackTech
Social
enterprise
Local
UK
An independent organisation aiming to increase the number of people from black and
ethnic minority backgrounds working in tech and founding tech businesses. It offers
employer training, university progra mmes and mentorship.
YSYS
Community
Local
UK
Short for 'Your Startup, Your Story', YSYS is a community for founders and others working in
tech who are interested in promoting diversity in the ecosystem. It hosts an extremely
collaborative Slack community, runs a pre-accelerator to help 18-24 year-olds launch
businesses and TalentDoor, a series of career-focussed workshops for diverse talent.
Foundervine
Accelerator
Global
UK
Started in 2018, Foundervine 'helps diverse entrepreneurs build startups from scratch'. It
runs a startup-building programme, educational masterclasses, festivals and training for
corporates around the UK. It is also launching a nine-week scale-up programme for
businesses run by black entrepreneurs, which starts in October.
OneTech
Community
Local
UK
Supports underrepresented founders in London with everything from startup weekends to
mentoring and free workspace.
Witty Careers
Events
Local
UK
Hosts events at tech companies (such as Uber and Microsoft) for black and ethnic minority
women, and also offers career support, through mentorship and resources.
Photoby:Jussi Hellste n
Colorintech
Non-profit
Local
UK
A non-profit organisation founded in 2016 which aims to increase the number of ethnic
minorities entering the U K's tech workforce. It runs four programmes, including a preaccelerator, an internship scheme for university students and a coding event for school
students.
10×10
Community
Local
UK
A WhatsApp community for black founders and investors which has been growing through
word-of-mouth since 2015.
www.stateofeuropeantech.com
117
In Partnership with
&
118.
05.3Community-Led Change
UK &IRELAND
BYP Network
Events
Local
UK
Dubbed as 'LinkedIn for black professionals', BYP holds conferences, hosts a jobs board and
runs a networking app, all to help young black professionals meet and support one another.
Its annual conference is taking place in London on 3 September.
Muslamicmakers
Meet-up
Local
UK
A meetup event for Muslims (and non-Muslims) to discuss, pitch and share ideas.
Don't Sleep on
Us
Events
Local
UK
An event for people from BAME backgrounds working on side projects.
Afrotech Fest
Events
Local
UK
A tech festival by and for black people of African and Caribbean heritage'. Held annually in
London.
Solidarity in
Tech
Events
Local
UK
Aims to 'dispel certain myths about the tech/STEM industry' and make it as inclusive an
industry as possible.
Coders of Colour
Events
Local
UK
Inspiring underrepresented teens of colour to pursue careers in tech, through events and
workshops.
CEE& DACH
Type of
Initiative
Scope
European Women in VC
Community
Europe
Poland
A community of senior women investors from across Europe (managing
partners, founders of VC funds and business angels). Their mission is to
strengthen the presence of women in the VC industry in Europe.
Czechitas
Non-profit
National
Czech
Republic
Non-profit aiming to increase diversity in the tech sector through education
and workshop initiatives.
Capacity
Incubator
Local
Switzerland
A business incubator for people with a refugee or migrant background. It also
runs workshops and training and mentoring schemes.
Hach'n'Lead
Events
Local
Switzerland
Switzerland's first women-friendly hackathon (69% of participants to the last
event were new to hackathons.)
Girls TechSwitzerland
Non-profit
Local
Switzerland
A non-profit that aims to tackle gender inequality in tech by educating and
empowering women who are passionate about technology. It offers events and
workshops.
TechFace
Recruitment
National
Switzerland
A recruitment site with a diversity focus, connecting companies and
candidates in tech. Their catchphrase is 'making tech more colourful' and they
assess companies for culture and commitment to diversity before engaging.
We Shape Tech
Co mmunity
National
Switzerland
A network of more than 1600 women and men dedicated to greater diversity in
tech and innovation. Currently has chapters in Zurich, Basel, Bern and Geneva
and is expanding into other cities in Switzerland and beyond.
Female Founders
Academy from Hatch
Enterprise (Austria)
Accelerator
Local
Austria
A hub for female founders in Vienna, which runs regular events, an accelerator
program me for startups from all over Europe and beyond, and a corporate
leadership programme.
www.stateofeuropeantech.com
Country
Description
118
In Partnership with
&
119.
05.3Community-Led Change
FRANCE &BENELUX
Type of
Initiative
Scope
Country
Description
The Next
Women
Fund
Online
Netherlands
A global community of ambitious entrepreneurs, investors and executives that has
created its own fund to help close the gap on female funding.
EWPN
(European
Women
Payments
Network)
Non-profit
Europe
Netherlands
A not-for-profit organisation dedicated to building a community for women in cards,
fintech and payments in Europe, which org anises local networking evenings, workshops,
annual events, awards and research.
Fighters
Programme
Coworking
Local
France
A free one-year programme for founders of early-stage startups, from underprivileged
backgrounds. Run by startup mega campus Station F in Paris.
La French
Tech Tremplin
Accelerator
Local
France
A two-part programme from government-backed organisation La French Tech to support
aspiring entrep reneurs from underrepresented groups in 13 regions. The first phase —
'Prepa' —helps founders prototype and test their business idea, supported by a €17,000
grant. The second phase, 'Incubation', is for early-stage businesses, and includes
membership of a partner accelerator, access to financial and business experts, and
introductions to investors and stakeholders.
Diversidays
Accelerator
Local
France
An organisation promoting social, cultural and ethnic diversity in the digital sphere —
through training and mentoring, running events and engaging with economic and political
decision makers across France.
Startup
Banlieue
Community
Local
France
An association formed in 2017 which hopes to inspire a generation of entrepreneurs in the
suburbs. It runs mentoring programmes and events.
Afrobytes
Events
Local
France
An annual event, this year held at Station F in Paris, which brings together founders,
investors, academics, industry and more to explore business opportunities in Africa's tech
ecosystem.
Les
Determinés
Non-profit
Local
France
Founded in 2015, this non-profit organisation offers entrepreneurs in suburban and rural
areas training and workshops.
Singa France
Community
National
France
An organisation which suppor ts refugees by, amongst other things, helping them launch
businesses. Active in eight cities across France.
Willa (formerly
known as
Paris
Pionnières)
Incubator
Local
France
An incubator for female founders which runs several programmes across France, catering
to different business stages and sectors. It also runs programmes for corporates and
'intrapreneurs' —those innovating within a business.
StartHer
Comm unity
Local
France
Founded in 2010 by Roxanne Varza (now director of Paris mega campus Station F) and
Mounia Rhka, StartHer aims to put a spotlight on women working in the tech sector,
through events, content and networks.
Women in
Fintech
Meet-up
Local
France
Regular meetups for women in fintech in Paris.
French Tess
Community
Local
France
Group supporting entrepreneurs from Paris' banlieue. It brings together entrepreneurs and
investors, promotes role models, demystifies the world of technology and looks for new
ways to make the ecosystem more inclusive.
Female
Ventures
Community
Local
Netherlands
Currently active in Amsterdam, Rotterdam, Delft, Utrecht and Eindhoven, Female Ventures
supports women in leadership roles with an online community, one-on-one mentorship
and events. It also supports the Fundright initi ative.
FEM-START
Accelerator
Local
Netherlands
An intentionally inclusive accelerator for women-led startups that focus on social impact
or tech. Provides communication and confidence training as well as giving access to
capital and important business tools.
Amsterdam
Creative
Entrepreneurs
Collective
Events
Local
Netherlands
A collective of creative entrepreneurs in Amsterdam. Hosts dinners, events and learning
experiences.
Girl Code
Meet-up
Local
Netherlands
A group looking to close the gender gap in code. They host meetups for coders and
everyone interested in code (men are welcome too!).
SheSharp
Meet-up
Local
Netherlands
Organization that aims to empower women by bringing diversity to the technology scene.
They host monthly events that bridge the gap between STEM and Entrepreneurship.
Technionista
Events
Local
Netherlands
Swedish group supporting women in tech via events and the 'Techionista Academy', which
provides one-day Masterclasses week-long Bootcamps or up to 3 months training.
www.stateofeuropeantech.com
119
In Partnership with
&
120.
05.3Community-Led Change
FRANCE &BENELUX
Technionista
Events
Local
Netherlands
Swedish group supporting women in tech via events and the 'Techionista Academy', which
provides one-day Masterclasses week-long Bootcamps or up to 3 months training.
Code to
Change
Meet-up
Local
Netherlands
They're looking to provide women with the skills to succeed in the job market. They host a
mentorship programme and lots of events in Amsterdam.
#Fundright
Advocacy
Local
Netherlands
An initiative backed by 25 Dutch VCs to improve both the gender balance within their own
workforce and of the companies they invest in. (In 2017, less than 2% of venture capital in
the Netherlands went to female founders.)
Country
Description
NORDICS
Type of
Initiative
Scope
Rails Girls
Non-profit
Global
Finland
Helps girls and women learn sketching, prototyping and basic programming and get
introduced to the world of technology. Rails Girls was born in Finland, but is nowadays a
global, non-profit volunteer community.
SHE
Community
Community
Local
Norway
Initiative pushing for gender equality in the workplace.
TENK
Norge
Events
Local
Norway
Thin k' runs workshops and events to encourage women and girls to consider careers in
tech.
Pangea
Accelerator
Local
Norway
Pangea is an accelerator program and an investment platform that matches African
startups with investors.
Charge
Incubator
Local
Norway
Charge is a 12-month startup incubator for first generation immigrants.
A Woman's
Place
Advocacy
Local
Sweden
An initiative by the City of Stockholm to support equ al opportunities for women and men.
Over 100 tech companies have joined and declared themselves 'A Woman's Place', including
local unicorns Spotify, Klarna, iZettle and King. Its website has resources for all companies
looking to improve their gender equality.
Femtech
Bootcamp
Accelerator
Local
Sweden
A free, intensive one-week accelerator programme for female founders, set up in 2018 by
numerous government organisations.
Di Digital
Female
Founders
Events
USA/Swedeb
Sweden
An event series for female founders to pitch their ideas and, for a successful few, take part
in a trip to New York.
Inklusiiv
Advocacy
National
Finland
A movement challenging Finnish fast-growing tech companies to report their diversity data.
Their website brings together studies and best practices for improving diversity in
business.
The
Shortcu t
Accelerator
Local
Finland
A talent accelerator in Helsinki designed to support a diverse group of people into the
startup community. It works at the grassroots level to build a community of startup doers
and now has over 90 nationalities and more men than women.
Women in
Tech DK
Community
National
Denmark
Open community running events, online forums, a slack group and a mentorship programme
to build relation ships between female founders.
www.stateofeuropeantech.com
120
In Partnership with
&
121.
05.3Community-Led Change
SOUTHERNEUROPE
Type of
Initiative
Scope
Country
Description
MujeresTech
Community
Online
Spain
This is an initiative devoted to empowering women as leaders and potential founders. It
trains kids, teenagers and adults.
AllWomen.tech
Coding
school
Local
Spain
This Barcelona-based initiative is an AI training campus dedicated to women in tech. It
offers Data Science, UX – UI Design, and Product Management courses for women, by
women.
Eje&Con
Community
National
Spain
A Spanish Association of Women Executives, CEOs, and Managing Directors, whose goal
is to increase the number of women in Senior Management positions as well as in
corporates' Boards of Directors.
Autoempleo
Incorpora
Community
Local
Spain
A programme by Obra Social La Caixa that provides free advice to low-income and lowresource entrepreneurs (for example, people with disab ilities, long-term unemployed,
youth at risk of exclusion, gender violence victims, immigrants, and former prisoners),
and accompanies them through the founding process. They analyse the viability of the
project and help find funds.
SheTech Italy
Community
Local
Italy
SheTech Italy is a community founded with the aim of supporting women in technology,
digital and entrepreneurship, through networking events, workshops and professional
opportunities.
#BcnTech4Women
Non-profit
Local
Spain
#BcnTech4Women is a working group to promote the voices of women in the Barcelona
tech community, under the umbrella of Barcelona Tech City, a non-profit organisation of
more than 800 companies.
Portuguese
Women in Tech
Community
National
Portugal
Portuguese Women in Tech is a community and web resource that draws attention to
fem ale talent in tech. The group organizes events and has published a booklet to
distribute around schools in Portugal.
NORTHAMERICA
Type of
Initiative
Scope
Country
AnitaB.org
Community
Global
USA
A global organisation that is known for the Grace Hopper Celebration (GHC), a massive gathering of
women technologists. There are are a series of AnitaB.org local communities in various cities.
WOW
Dinner
Non-profit
Global
Canada
A networking dinner series, promoting diversity and inclusion in tech. It's active in several countries
around the world, including Spain, France, the UK, Portugal and Germany.
Description
GLOBAL
Type of
Initiative
Scope
Country
Description
TedXWomen
Events
Global
NA
Events hosting speeches coming from top innovators and leaders. Has offshoots all over
Europe (e.g. TEDxAmsterdamWomen and TEDxLondonWomen).
Ladies that UX
Community
Global
NA
A friendly, welcoming and collaborative community of women in UX, with a growing number of
local groups based in cities worldwide (including 12 across Europe).
Pyladies
N etwork
Global
NA
An international mentorship group with a focus on helping more women become active
participants and leaders in the Python open-source community. They have a series of Meetups
and/or a Facebook group for most countries in Europe (as well as elsewhere across the world).
Inspiring Fifty
Non-profit
Global
NA
A non-profit that aims to increase diversity in tech by making female role models in te ch more
visible.
FutureWomenX
Community
Global
NA
Community of leaders from around the world dedicated to supporting one another via executive
coaching, global expeditions, impact accelerators and Personal Boards (groups of women from
across sectors who get together to serve as each other's ongoing 'Personal Board of Directors').
Chicas
poderosas
Community
Global
NA
A community that is active around the world b ut also has a home in Spain. It is all about
empowering women and promoting female founders in media.
www.stateofeuropeantech.com
121
In Partnership with
&
122.
05.3Community-Led Change
ONLINE
Type of
Initiative
Scope
Country
50inTech
Community
Online
NA
A new platform which aims to support women in tech —through educational podcasts, networking
and working with industry stakeholders —and reach an equal gender balance in tech by 2050.
Women in AI
Community
Online
NA
A community-driven initiative bringing empowerment, knowledge and active collaboration via
education, research, events (acro ss Europe and beyond) and blogging.Their mission is to increase
female representation and participation in AI.
Femstreet
Community
Online
NA
Femstreet began as a newsletter for female founders and investors, and has grown into a global
community, with events in the US and Europe, and an invite-only Slack community for active
newsletter readers.
Description
Women in
Tech
Non-profit
Online
NA
Non-profit dedicated to educatin g, equipping and empowering women and girls with the necessary
skills to succeed in STEM career fields. Their work includes education in schools as well as
mentoring, incubation and acceleration camps, networking events and research. Events are
located across Europe.
Lesbians
Who Tech
Community
Online
NA
This group is a big community (50,000+ including allies) based in the US that is expanding to
Europe. Th ey host lots of summits and events and have a coding scholarship programme.
Global D&I
Knowledge
Community
Community
Online
NA
A safe environment with driven D&I champions facilitating knowledge sharing. Consists of a mix of
founder of tech startups solving D&I challenges, corporates, NGOs and educational institutions, as
well as individuals such as D&I experts and up-and-coming D&I professionals.
Diverse in
Community
Online
NA
A diversity and inclusion platform founded by Furkan Karayel that provides diversity news,
consultancy services and events. It helps develop sustainable strategies for companies to make
equal and happier workplaces with its 20+ ambassadors from all over the world.
300Seconds
Events
Online
NA
Helps women in tech gain public speaking experience and skills, to counter the
underrepresentatio n of women onstage at conferences.
www.stateofeuropeantech.com
122
In Partnership with
&
123.
05.3Community-Led Change
Insome areas, European tech has certainly become more
diverse in the last year. Initiatives like OneTech,funds like
Backstage Capital and communities like Foundervine,
Blooming Founders and Femstreet have grown in scale
and influence in the main hubs, and there is a growing
understandingof the importance of inclusion and not just
diversity, which is very welcome.
CheckWarner
Diversity VC
Co-Founder
As the industry has focused more of its attention on the topic of diversity,
there has been a large rise in the number of events focused on D&Iacros
the region in recent years.
6.5%
# of events hosted
%of all events hosted
6.5
5,839
6.1%
#of tech-related Meetups
LEGEND
6,000
4,843
6.0
5.7%
4,000
4,002
5.6%
2,903
2,000
5.5
15,8
.01%5
5.0
0
2015
2016
2017
2018
%of tech-related Meetups hosted
Share and number of techrelated Meetup events focused
on D&Ibyyear
4.5
2019
NOTE:
2019 annualised based on data to September
2019.
Still we haveto be honest
that both our industry
and ourselves need to do
more to really change the
picture.
www.stateofeuropeantech.com
We still see about 80% of the founder teams being
predominantly male. But we strongly believe that one
of Europe's biggest assets in global competition is its
diversity. Europe sees a large number of initiatives to
encourage and include specifically female founders
and entrepreneurs, and it seems that these dynamics
are accelerating in a very positive way, also triggered
by an increasing number of top-level female investors.
Speedinvest is actively supporting local initiatives to
drive gender equality and age equality such as 'Female
Founders' and 'WisR'. Still we have to be honest that both
our industry and ourselves need to do more to really
change the picture.
123
DanielKeiper-Knorr
Speedinvest
Founder & Partner
In Partnership with
&
124.
05.3Community-Led Change
According to Meetup,'Women in Technology' is one of Top 10fastest-growing topics for all
tech-related Meetup events in Europe in 2019.
Digital media
The 10fastest growing topicsfor
tech-related Meetup events in
Europe in2019
55%
Founders
44%
Agile transformation
40%
Product development
39%
3Danimation
38%
Agile coaching
35%
Scrum
35%
SEO
28%
Women in technology
27%
Technology professionals
26%
0
NOTE:
5
10
15
20
25
30
35
40
45
50
55
YoY growth (%)
2019 annualised based on data to September
2019. Only events with at least 250 events in
2018 included.
Despite the rise of events focussed on bringing together and supporting underrepresented groups
within European tech, at a macro level there has not been any material improvement in female
attendees in tech-related Meetup events in Europe in recent years. Women accounted for only 23.4%
of participants in 2019, a number that has only crept upwards from 23.0% in 2018.
Share of female attendees in
tech-related Meetup events in
Europe
25.0
21.5%
21.6%
2016
2017
23.0%
23.4%
2018
2019
%of female attendees
20.0
15.0
10.0
5.0
0.0
NOTE:
%of the reported gender of attendees.
www.stateofeuropeantech.com
124
In Partnership with
&
60
125.
05.3Community-Led Change
Eastern European countries are the main constituents of the top 10list of countries for female
participation at tech-related Meetup events. Though there are differences across countries, the
participation of women in tech community events throughout Europe remains low;Hungary, the
number one country by share of participants in events that are women,tops the list with just 28%.
Denmark, at the other end of the list, has one of the lowest female participation rates at just 18%.
Share of womanattendees in
tech-related Meetup events by
country
TOP TEN COUNTRIES
Romania
27.6%
Latvia
27.5%
Germany
26.4%
Spain
25.9%
Luxembourg
25.7%
Ireland
25.7%
Norway
25.5%
Switzerland
25.5%
Lithuania
25.5%
Sweden
25.3%
0.0
2.5
5.0
7.5
10.0
12.5
15.0
17.5
20.0
22.5
25.0
27.5
30.0
% of women
COUNTRIES 11-20
UnitedKingdom
24.9%
Netherlands
24.7%
France
24.2%
Bulgaria
24.2%
Portugal
24.0%
Serbia
23.0%
Estonia
22.9%
Ukraine
22.6%
Austria
22.4%
Finland
21.9%
0.0
2.5
5.0
7.5
10.0
12.5
15.0
17.5
20.0
22.5
25.0
27.5
% of women
THEREST
Belgium
21.5%
21.2%
Croatia
Hungary
20.8%
Turkey
20.8%
Poland
20.7%
Italy
19.8%
19.7%
Greece
18.0%
Denmark
Czech Republic
17.6%
17.1%
Russia
15.4%
Slovenia
NOTE:
% of the reported gender of attendees. Only
countries with at least 100 female attendees
included.
www.stateofeuropeantech.com
0.0
2.5
5.0
7.5
10.0
12.5
15.0
17.5
20.0
22.5
% of women
125
In Partnership with
&
126. People
06People
What kinds of people work in European tech jobs?
The archetype of a European founder is still overwhelmingly a
man with financial stability. Founders are feeling the heat from
increased competition for talent. The debate is now turning to how
to keep that talent engaged through incentives and stock options,
and healthy through discussions of mental health and wellness.
www.stateofeuropeantech.com
126
In Partnership with
&
127. 06.1 Portrait of a European Tech Founder
06.1Portrait of a European TechFounder
Our survey of more than 1,200 founders from across Europe found that 21%of
founder respondents self-identify as female.The gender diversity of founders
varies across the region. According to the survey responses, the UK and Ireland
have the highest gender diversity, while France, the Benelux and Southern
Europe have the lowest levels.
Which gender do youidentify
with?
UK & Ireland
Nordics
LEGEND
Rest of Europe
Women
Men
DACH
Non-Binary
Other
Prefer not to say
CEE
Southern Europe
France & Benelux
NOTE:
Founders only. Numbers may not add to 100
due to rounding.
The overwhelming majority of founders who responded to the survey selfidentify as White/Caucasian, making up 84% of responses received. The ethnic
diversity of founder respondents was highest in the UK, where 20% of founder
respondents self-identified with a minority ethnic group.
Which best describesyour
ethnicity?
UK & Ireland
France & Benelux
LEGEND
Caucasian/White
DACH
Asian
Mixed
Black/African/Caribbean
Nordics
Southern Europe
Middle Eastern/North African
Hispanic/Latinx
Other
Rest of Europe
CEE
Prefer not to say
NOTE:
Founders only. Numbers may not add to 100
due to rounding.
www.stateofeuropeantech.com
127
In Partnership with
&
128.
06.1Portrait of a European Tech Founder
Around one-quarter of all European founder respondents to the survey are immigrants; in other
words, they have chosen to build their company in a country not the same as their country of origin.
There is a huge variance among the different parts of Europe. Inthe UK, approaching 50% of all
founders are immigrants. InCentral and Eastern Europe, it is only just over 10%of founders.
Are youbased inyourcountryof
origin?
UK & Ireland
43%
Southern Europe
57%
37%
63%
LEGEND
Founder not based in country of origin
Founder based in country of origin
DACH
32%
France & Benelux
68%
30%
Rest of Europe
70%
20%
80%
NOTE:
Nordics
Founders only. Numbers may not add to 100
due to rounding.
18%
CEE
82%
11%
0
89%
10
20
30
40
50
60
70
80
90
100
60
70
80
90
100
% ofrespondents
The founder respondents to our survey showed a high level of educational attainment.
Three-quarters of founders have a bachelor's or master's degree, while another 7%have
a doctorate. This compares to just 35% of EU-28 population aged 25-54 who have attained
tertiary or higher education, according to Eurostat.
What best describes your
highest formaleducational
attainment?
LEGEND
Bachelor's degree
France & Benelux
DACH
Master's degree
Doctoral degree
Professional degree
Trade school
Some college/university study without
earning adegree
Secondary school
Rest of Europe
UK & Ireland
CEE
Nordics
Southern Europe
Primary/elementaryschool
No formal education completed
0
10
20
30
40
50
% ofrespondents
NOTE:
Founders only. Numbers may not add to 100
due to rounding.
81%ofentrepreneurswerelivingcomfortably
beforetheyfoundedtheircompany,comparedwith
39% of Europeanswhosaytheywerelivingfairly
easily,easilyorveryeasilyaccordingtoEurostat.
How would you describe your
nancial situation rightbefore
starting yourcompany?
LIVINGCOMFORTABLY
81%
Lived comfortably/met basic
expenses with extra left over
Lived comfortably/met basic expenses with extra left
over
81%
Just met basic expenses
13%
Not enough/struggled to meet basic expenses
6%
0
10
20
30
40
50
60
70
80
% ofrespondents
NOTE:
Founders only. Numbers may not add to 100
due to rounding.
www.stateofeuropeantech.com
128
In Partnership with
&
90
129.
06.1Portrait of a European Tech Founder
The assumption that all founders have access to 'friends and family
rounds'still bewilders me.
The assumption that all founders have access
to 'friends and family rounds' still bewilders
me. We need to develop an empathetic
understanding that this is not accessible to all,
and thus develop inclusive pathways that level
the playing field.
OnYSYS pre-accelerator FoundersDoor,one of
our alumni Emilia Servane Founder of The Good
Hair Co, took part and was able to crowdfund
£1,500to which Natwest matched an additional
£1,500- this capital will now give her the ability
to validate her ideas and move forward.
These pathways look like community groups,
diverse angels and early-stage pre-seed funds.
Initiatives such as Natwest Back Her Business
aremakingthosefirststeps, theprogrammatch
fundsfemale foundercrowdfundingcampaigns.
We need more impactful interventions like this
to truly have a diverse and inclusive European
startup ecosystem.
DeborahOkenla
YSYS
Founder & CEO
Looking only at those founders who have attained a university degree, there are interesting
differences in the diversity of subjects studied by founders from different regions. Founders in the
Nordics, UK & Ireland have more diverse backgrounds than in other regions. CEE, DACH and Southern
Europe stand out with the largest share of founders with a technical degree.
Share of capital invested(%)by
education background and by
region, 2015-2019
ART/SOCIALSCIENCES
15%
15
11
% ofcapital raised
European average capital raised (%)
% of capital
LEGEND
12%
11
10
11
11
10%
10%
11
11
8%
5
1%
0
Nordics
TECHNICAL
41%
40
35
United Kingdom & Ireland
40%
35
France & Benelux
DACH
38%
35
37%
35
Southern Europe
CEE
35
35
33%
% of capital
30
22%
20
10
0
Southern Europe
DACH
CEE
France & Benelux
United Kingdom & Ireland
Nordics
40
40
40
40
37%
37%
BUSINESS &LAW
60
55%
% of capital
40
40
40
32%
29%
20
NOTE:
Numbers don't add up to 100 because deals
can have more than one founder involved.
2019 based on data up to September 2019.
www.stateofeuropeantech.com
0
Southern Europe
DACH
France & Benelux
129
Nordics
United Kingdom & Ireland
In Partnership with
CEE
&
130.
06.1Portrait of a European Tech Founder
The UnicornTrajectory
In November 2019,Notion, a European VC investing in early-stage SaaS and enterprise
tech startups, published a comparison of people hired into leadership teams of B2B
software $1B+companies (unicorns) and B2B software companies that raised the same
amount of VC money at the same time as unicorns, but did not enjoy the same levels
of success. The research paints a useful picture of the diversity of leadership teams
(Founders, C-level, EVP, SVP, VP) of these companies.
A high proportion of companies that have scaled to $1billion or more have at least one leader with
a top university degree, but also a high proportion of these same companies have leaders that didn't
attend university at all.
Share of companies (%)that
have at least one leader with
different academic
quali cations
Unicorns
90%
78%
75
% ofcompanies
LEGEND
100%
100
58%
50
44%
44%
Control group
25
NOTE:
0
Top 50 undergraduate university
For access to Notion's full report on
leadership hiring at unicorn companies, The
Unicorn Trajectory, please visit:
https://notion.vc/resources/how-unicornshire/
Top 10 MBA
Nodegree
The prevalence of leaders in $1B+companies with no university degree is highest in sales,
technical and operationalfunctions and lowest in finance and marketing.
Share of companies (%)that
have at leastone person with no
university degree in their
leadership team perfunction
Unicorns
Control Group
62%
60
% ofcompanies
LEGEND
78%
80
44%
40
32%
20%
20
12%
10%
6%
NOTE:
4%
2% 2%
0
Finance
Marketing
Operations
Other
14%
12%
10%
12%
8%
Product
Sales
Technical
Any function
For access to Notion's full report on
leadership hiring at unicorn companies, The
Unicorn Trajectory, please visit:
https://notion.vc/resources/how-unicornshire/
www.stateofeuropeantech.com
130
In Partnership with
&
131.
06.1Portrait of a European Tech Founder
Across Europe, 40% of seed stage startups have
a founding team aged between 26-30 years old.
Southern Europe, DACH and the CEE regions
have the largest share of young founders.
Only 7%of founding teams in the CEE are over
40 years old - while in France, this number is
close to 20%.
Share of founding team(%)in
age groups byregion
EUROPEAN FOUNDINGTEAMS
50%
of seed stage European founding
teams are on average less than
30 yearsold.
20-25
15
15%
14%
% of founding team in age group
12
1132%
12
12%
12
12
12%
12
France & Benelux
Nordics
40
40
10
8%
5
0
Southern Europe
DACH
CEE
40
43%
40
410
%
United Kingdom & Ireland
26-30
% of founding team in age group
40
39%
420%
37%
33%
30
20
10
0
Southern Europe
DACH
36
35%
3376%
Southern Europe
DACH
CEE
United Kingdom & Ireland
France & Benelux
Nordics
36
39%
36
31-40
41%
% of founding team in age group
40
36
36
35%
34%
30
20
10
0
CEE
United Kingdom & Ireland
France & Benelux
Nordics
41+
17%
% of founding team in age group
15
15%
13
13
13
7%
7%
DACH
CEE
13
13
1143%
United Kingdom & Ireland
France & Benelux
Nordics
11%
10
5
0
Southern Europe
NOTE:
Seed stage startups founding team average
age post 2015. All Dealroom.co data excludes
the following: biotech, secondary
transactions, debt, lending capital, grants.
www.stateofeuropeantech.com
131
In Partnership with
&
132.
06.1Portrait of a European Tech Founder
The importance of age diversity is supported by Notion's research. Teamsof
companies that scale to a valuation of $1billion or more are significantly more
diverse in leadership experience than those in the control group. Their most
experienced leaders have more experience, and their least experienced leaders
less, than those in the control group.
LEGEND
Least experienced leaders
Most experienced leaders
UNICORNS
30.0
27.6
28.0
29.0
25.3
#of years of prior work experience
Years of experience of least and
most experienced leaders in
unicorn companies versus the
control group average per year
since founding
25.0
20.6
20.0
17.9
15.0
10.0
6.5
6.2
6.0
6.2
5.8
6.2
Year0
Year1
Year2
Year3
Year4
Year5
22.2
22.5
21.8
21.9
9.2
9.2
9.3
Year3
Year4
Year5
5.0
0.0
CONTROLGROUP
20.9
#of years of prior work experience
20.1
20.0
15.0
10.0
9.7
9.0
10.0
NOTE:
For access to Notion's full report on
leadership hiring at unicorn companies, The
Unicorn Trajectory, please visit:
https://notion.vc/resources/how-unicornshire/
5.0
Year0
Year1
Year2
The wide range of experience in the average $1B+company,and how this
evolves through the journey of the company,can be seen in the distribution
of leaders by years of experience.
Distribution of previous yearsof
experience of each leader in an
average unicorn per year since
founding
30
LEGEND
Year 0
Year 2
Year 3
20
% ofleaders
Year 1
10
Year 4
Year 5
NOTE:
0
0-5
6-10
11-15
16-20
21-25
26-30
31-35
36-40
40+
For access to Notion's full report on
leadership hiring at unicorn companies, The
Unicorn Trajectory, please visit:
https://notion.vc/resources/how-unicornshire/
www.stateofeuropeantech.com
132
In Partnership with
&
133.
06.1Portrait of a European Tech Founder
The companies seeding the largest number of European tech founders are mostly from the US. Ten
of the Top 15companies by number of founder alumni are American, with Microsoft in first place
followedby Google and BCG. Nokia is the highest-ranked European company. Rocket Internet is the
only homegrown, Internet-era company that makes the Top15.
Top 15companies by numberof
founderalumni
Company
HQ Country
Founding Decade
1
Microsoft
United States
1970s
2
United States
1990s
3
The Boston Consulting Group
United States
Pre-Internet
4
IBM
United States
Pre-Internet
5
McKinsey
United States
Pre-Internet
6
Nokia Corporation
Finland
Pre-Internet
7
Accenture
United Kingdom
Pre-Internet
8
Yahoo!
United States
1990s
9
Siemens
Germany
Pre-Internet
10
Rocket Internet
Germany
2000s
11
eBay
United States
1990s
12
EY Ernst & Young
United Kingdom
Pre-Internet
13
Goldman Sachs
United States
Pre-Internet
14
PwC
United States
Pre-Internet
15
J P Morgan
United States
Pre-Internet
Photo by:Jussi Hellsten
www.stateofeuropeantech.com
133
In Partnership with
&
134. 06.2 How Founders Get Started
06.2How Founders GetStarted
Starting out...
We wanted to explore the initial phase of the founding journey. How do founders
finance their companies? Who do they raise those initial funds from? How much do
they raise? How do they decide where to build their companies? What personal and
business considerations influence their decisions?
Nearly 50%of first-time founders set up andstart their companies with less than
$25,000. Repeat founders who have successfully scaled companies in the past
are far more likely to raise significantly more to start their next companies.32%
of repeat founders with significant experience raised more than $500,000 to set
up and start their most recent companies, versus 12%of first-time founders.
Howmuch capital did you 'raise'
or collect in order to set-up and
start thiscompany?
20%
No capital
13%
7%
25%
Less than$25k
LEGEND
25%
25%
First-time founder
Repeat founder with limited experience in
scaling company
25%
Between $25k-$100k
29%
24%
Repeat founder with signi cant
experience in scaling company
19%
23%
Between $100k-$500k
31%
12%
13%
More than $500k
33%
0
5
10
15
20
25
30
35
% of respondents
NOTE:
Founders only. Numbers may not add to 100
due to rounding.
www.stateofeuropeantech.com
134
In Partnership with
&
135.
06.2How Founders Get Started
Looking at the differences between men and women founders and their entrepreneurial experience,
we found that women first-time founders were significantly more likely to have set up and started
their most recent company with no capital or with less than $25,000. This gap disappears,though,
when looking at the differences between experienced men and women repeat founders.
Howmuch capital did you 'raise'
or collect in order to set-up and
start thiscompany?
FIRST-TIMEFOUNDER
23%
No capital
18%
LEGEND
Women
32%
Less than$25k
Men
23%
23%
Between $25k-$100k
25%
16%
Between $100k-$500k
20%
6%
Morethan $500k
14%
0
5
10
15
20
25
30
35
% of respondents
REPEAT FOUNDER WITH LIMITED EXPERIENCE INSCALING
15%
No capital
13%
25%
Less than$25k
22%
36%
Between $25k-$100k
26%
17%
Between $100k-$500k
25%
8%
Morethan $500k
14%
0
5
10
20
15
25
30
35
40
% of respondents
REPEAT FOUNDER WITH SIGNIFICANT EXPERIENCE INSCALING
5%
No capital
8%
5%
Less than$25k
4%
11%
Between $25k-$100k
26%
42%
Between $100k-$500k
30%
37%
Morethan $500k
33%
0
5
10
15
20
25
30
35
40
45
% of respondents
NOTE:
Founders only. Numbers may not add to 100
due to rounding.
www.stateofeuropeantech.com
135
In Partnership with
&
136.
06.2How Founders Get Started
We also observed material differences in the responses
from founders who self-identified with different ethnic
groups. 60% of founders who self-identified as Black/
African/Caribbean started their most recent company
with no capital or with less than $25,000.
Howmuch capital did you 'raise'
or collect in order to set-up and
start thiscompany?
STARTING WITHLESS THAN$25K
55%
of women first-time founders
start their company with no initial
capital
Black/African/Caribbean
Middle Eastern/NorthAfrican
LEGEND
Caucasian/White
No capital
Other
Less than $25k
$25k-$100k
Hispanic/Latinx
$100k-$500k
Asian
Morethan $500k
Mixed
0
5
10
15
20
25
30
35
40
45
50
55
% ofrespondents
NOTE:
Founders only. Numbers may not add to 100
due to rounding.
The need for funds
focused on diversity is
as important as the need
for insights and related
to diverse founders - and
there is zero data on
black founders in the UK.
This is why I started interviewing black founders and
creating a database with their permission. Itis important
to shine a light on the differences, especially as black
founders have become synonymous with a seemingly
perpetually fixed 0.2% funded statistic or the fact that 67%
of those Isurveyed mentioned that they were struggling to
meet their needs before starting a company, compared to
19%of the respondents surveyed by Atomico.
It's time that black founders have realistic insights and
perspectives as to what it takes to be a black founder and
know that there are others in their ecosystem like them.
This will hopefully create a clearer path for future black
founders and the investors who back them.
Andy Davis
Backstage Capital
Thesurveydoesn'tallowustoexploretherelationshipbetweentheinitialfinancingandtheeventual
successofacompany. Whatwecansay, though, is that founders ofcompaniesthathavescaledto
morethan 100 employeesaremorelikelytohavesetupandstartedwithalargersumofinitialfinancing
comparedwithfounders ofcompanieswheretheemployeecountisstilllessthan 100employees.
40
Howmuch capital did you 'raise'
or collect in order to set up and
start thiscompany?
35%
30
<100 employees
>100 employees
% ofrespondents
26%
LEGEND
23%
23%
23%
20%
20
16%
15%
11%
10
0
8%
Nocapital
Less than $25k
$25k-$100k
$100k-$500k
More than $500k
NOTE:
Founders only. Numbers may not add to 100
due to rounding.
www.stateofeuropeantech.com
136
In Partnership with
&
137.
06.2How Founders Get Started
We also wanted to understand how founders finance the initial setup of their companies.
The overwhelming majority of founders (around two-thirds) did so by tapping into their personal
savings. The sources of initial funds vary significantly, however, depending on the level of experience
of the founders. As one might expect, repeat founders with previous success are significantly more
likely to have used angel investments and VC money for initial financing.
How did you nance the initial
set up andearliest phase of your
most recent company?
Personal savings
Family & friends investment
LEGEND
Angelinvestment
First-time founder
Public grant
Repeat founder with limited experience in
scaling company
Personal debt (creditcards, overdraft, etc)
Repeat founder with signi cant
experience in scaling company
Accelerator funds
Venturecapital
Incubator funds
NOTE:
Bank loan
Founders only. Numbers do not add to 100 as
respondents could select multiple choices.
Corporate grant
Crowdfunding
0
10
20
30
40
50
60
70
% of respondents
It's interestingtolookathowthesourcesofinitialfinancingraisedby founders tostarttheirjourneys
varyacross Europe. Thereisamateriallevelofvarianceinthemostprevalent form ofinitial funding
dependingonwhereyoustartyourcompany. In the Nordics, for example, governmentgrantsarea
muchmorecommonsourceofinitialfinancing for founders in thosemarkets.InFrance, there'sahigher
likelihoodofobtainingacorporategrantthanelsewhereinEurope.
PERSONAL SAVINGS
How did you nance the initial
set up andearliest phase of your
most recent company?
80
72%
68%
65%
65%
62%
% of respondents
60
NOTE:
Founders only. Numbers do not add to
100 as respondents could select multiple
choices.
58%
50%
40
20
0
FAMILY & FRIENDS INVESTMENT
Southern Europe
France & Benelux
DACH
UK & Ireland
Nordics
CE E
Rest of Europe
ANGEL INVESTMENT
40
37%
36%
30
30%
29%
28%
26%
30%
28%
25%
23%
27%
22%
% of respondents
% of respondents
30
21%
20
20%
20
10
10
0
Southern Europe
CE E
Rest of Europe
France & Benelux
www.stateofeuropeantech.com
UK & Ireland
Nordics
0
DACH
137
UK & Ireland
Nordics
Southern Europe
CE E
DACH
In Partnership with
France & Benelux
Rest of Europe
&
138.
06.2How Founders Get Started
HOWDIDYOU FINANCE THE INITIAL SET UP AND EARLIEST PHASE OF YOUR MOST
RECENT COMPANY?
PUBLICGRANT
PERSONAL DEBT
40
33%
35%
30
30
% of respondents
% of respondents
24%
20
17%
15%
15%
14%
20
16%
16%
14%
11%
10
0
Nordics
DACH
CE E
Rest of Europe
Southern Europe
France & Benelux
0
UK & Ireland
ACCELERATOR FUNDS
25
13%
12%
10
8%
Rest of Europe
CE E
Nordics
UK & Ireland
DACH
13%
13%
France & Benelux Southern Europe
VENTURE CAPITAL
25%
15
15% 15%
14%
12%
17%
15
14%
13%
% of respondents
% of respondents
20
12%
10
8%
12%
10
5
7%
5
0
Rest of Europe
CE E
DACH
UK & Ireland
Southern Europe
France & Benelux
0
Nordics
INCUBATORFUNDS
13
Rest of Europe
UK & Ireland
DACH
CE E
Southern Europe France & Benelux
Nordics
BANKLOAN
15
12%
14%
11%
10%
10
8
% of respondents
% of respondents
9%
7%
6%
5
4%
10
7%
5% 5% 5%
5
4%
3
0
2%
DACH
UK & Ireland
Rest of Europe
France & Benelux
CE E
Southern Europe
0
Nordics
CORPORATE GRANT
Nordics
CE E
DACH
Rest of Europe
Southern Europe
France & Benelux
UK & Ireland
CROWDFUNDING
8
7%
7%
5
5%
6
4%
% of respondents
% of respondents
4
5%
4%
4
3%
3%
3% 3%
3
2%
2
2%
2
1
0
France & Benelux
Nordics
Rest of Europe
UK & Ireland
www.stateofeuropeantech.com
DACH
Southern Europe
0
CE E
138
DACH
UK & Ireland
France & Benelux
Nordics
In Partnership with
CE E
&
139. 06.3 Founder Challenges & Well-Being
06.3Founder Challenges &Well-Being
We set out to understand how the journey of starting a company affects founders. Not just in terms
of the company-building challenges, but also in exploring some of the intense personal challenges
that founders must deal with on a daily basis. We started by asking what they consider to be the most
challenging aspects of being a founder.Our respondents, more than 1,200 of them, most frequently
cited balancing working and personal lives, loneliness at the top and securing access to talent and
capital as their biggest challenges.
Since you started a company,
what have you found the top
three most challengingaspects
of being afounder?
Securing access to capital
48%
Finding a reasonable balance between your working and
personal lives
44%
Securing access totalent
33%
Developing as a leader of your company
NOTE:
27%
Finding mentors/advisors who add value
Founder respondents only. Numbers do not
add to 100 as respondents selected up to
three options.
25%
Feeling lonely at the top
23%
Support from your investors
13%
Future career/reconversionprospects
8%
Support from family and friends
6%
0
10
20
40
30
50
% ofrespondents
Mental health isn’t
a PR campaign, it’s a
paradigm shift.
Mental health isn’t a PR campaign, it's a paradigmshift.
Millennials and Generation Z are acutely aware of mental
health issues, and it is something that we incorporate
into our community events. It’s about making sure that
entrepreneurs have a support system and have people to
have honest conversations with. I'm interested to see in
five to ten years how these conversations about mental
health at the early stage will filter through to conversations
about founders' relationships with investors, and what the
expectations on the part of investors are.
AbbyScarborough
Yena
Co-Founder
The same challenges surfaced with similar frequency for both men and women founder respondents,
though responses did demonstrate small differences around the challenge of securing access to
capital, finding a reasonable balance in their personal and working lives, and finding mentors and
advisors who actually add value.
Since you started a company,
what have you found the top
three most challengingaspects
of being afounder?
47%
Securing access to capital
53%
Finding a reasonable balance between your working and
personal lives
43%
47%
33%
Securing access totalent
29%
27%
25%
Developing as a leader of your company
24%
Finding mentors/advisors who add value
LEGEND
Feeling lonely at the top
Men
Women
29%
23%
25%
13%
15%
Support from your investors
7%
8%
Future career/reconversion prospects
Support from family and friends
4%
0
6%
10
20
30
40
50
% ofrespondents
NOTE:
Founder respondents only. Numbers do not
add to 100 as respondents selected up to
three options.
www.stateofeuropeantech.com
139
In Partnership with
&
60
140.
06.3Founder Challenges & Well-Being
Where we saw a greater variance in responses was when we asked
founders with different levels of experience. Repeat founders with
significant experience in scaling a previous company are materially
more likely to state that securing access to talent is the most
challenging aspect of being a founder. They were also much less
likely than first-time founders to cite the challenge of developing as a
leaderor being able to find mentors.
Since you started a company,
what have you found the top
three most challengingaspects
of being afounder?
LEGEND
Securing access to capital
Finding a reasonable balance between your working and
personal lives
Securing access totalent
Developing as a leader of your company
Finding mentors/advisors that add value
Feeling lonely at the top
First-time founder
Repeat founder with limited experience in
scaling company
Support from your investors
Future career/reconversion prospects
Repeat founder with signi cant
experience in scaling company
Support from family and friends
0
10
30
20
40
50
% ofrespondents
NOTE:
Founder respondents only. Numbers do not
add to 100 as respondents selected up to
three options.
Itshould not be a surprise that the most challenging aspects of being
a founder also change at each step of the scaling journey. As their
companies grow in scale, founders point out that the challenges of
the earlier stages, such as securing access to capital and finding
mentors, become much less of a concern. Instead, it becomes much
clearer that finding a balance in their working and personal lives and
developing as leaders of their growing companies become the most
challenging aspects of being a founder.
Since you started a company,
what have you found the top
three most challengingaspects
of being afounder?
LEGEND
40%
of experienced repeat founders
mentioned that 'securing access
to talent' is one of the top three
most challenging aspects.
Securing access to capital
Finding a reasonable balance between your working and
personal lives
Securing access totalent
Developing as a leader of your company
Finding mentors/advisors who add value
Feeling lonely at the top
<10employees
Support from your investors
11-100employees
>100employees
REPEATFOUNDERS
Future career/reconversion prospects
Support from family and friends
0
10
20
30
40
50
60
% of respondents
NOTE:
Founder respondents only. Numbers do not
add to 100 as respondents selected up to
three options.
www.stateofeuropeantech.com
140
In Partnership with
&
141.
06.3Founder Challenges & Well-Being
We asked founders if the experience of starting and building a
company had led to any change in their mental health. While founders
mental health,we also found that one in five founders said it had a
were most likely to say it had mostly had a positive impact on their
FOUNDERS
19%
of all founders said that starting
a company mostly had a negative
impact on their well-being.
mostly negative impact for their mental health. It is interesting that
'success' - as defined here by scaling a company to a meaningful
number of employees - is not more likely to lead to positive mental
health outcomes. Infact, founders of larger companies were less likely
to say they had experienceda positive change in their mental health.
Have you experienced any
change in your mentalhealth
since you founded your
company?
36%
Positivechange
29%
30%
19%
23%
22%
Negative change
23%
Nochange
19%
24%
LEGEND
<10employees
11-100employees
16%
16%
16%
Not aware of change
2%
Prefer not to say
6%
3%
>100employees
5%
Other
6%
4%
0
5
10
15
20
25
30
35
40
% ofrespondents
NOTE:
Founder respondents only. Numbers may not
to 100 due to rounding.
Iam a co-founder so that has helped as [Ihave] done lone
founder before, and it is tough so you have to team up
with other founders/CEOs to support when getting going.
State ofEuropean
Tech survey
respondent
It is also noteworthy that we saw little difference between first-time and repeat founders.
Experienced repeat founders were just as likely to say they had experienced a mostly negative change
in their mental health as first-time founders. We did find that experienced repeat founders were more
likely to say that they don't believe that being a founder had had any impact at all on their mental health.
Have you experienced any
change in your mentalhealth
since you founded your
company?
36%
Positivechange
32%
32%
20%
18%
Negative change
21%
20%
Nochange
23%
31%
L EGEND
17%
17%
Not aware of change
12%
First-time founder
Repeat founder with limited experience
Repeat founder with signi cant previous
experience
3%
3%
Prefer not to say
2%
4%
8%
Other
3%
0
5
10
15
20
25
30
35
40
% ofrespondents
NOTE:
Founder respondents only. Numbers may not
add to 100 due to rounding.
www.stateofeuropeantech.com
141
In Partnership with
&
142.
06.3Founder Challenges & Well-Being
Where we did see a larger variance was between founders of externally funded
and bootstrapped companies. Founders of bootstrapped companies were
materially less likely to tell us that being a founder has had a mostly negative
impact on their mental health comparedwith those founders who have raised
external capital.
Have you experienced any
change in your mentalhealth
since you founded your
company?
31%
Positivechange
38%
23%
Negative change
15%
23%
Nochange
22%
LEGEND
Raised external capital
Bootstrapped
15%
Not aware of change
17%
5%
Other (pleasespecify)
5%
3%
Prefer not to say
3%
0
5
10
15
20
25
30
35
40
% of respondents
NOTE:
Founder respondents only. Numbers may not
to 100 due to rounding.
Iam under more stress than I'veever been, but Iam also
more intellectually stimulated than I'veever been. These
positives and negatives are both felt at the same time, so
they don'tcancel out - but they are both felt.
State ofEuropean
Tech survey
respondent
We also saw that the decision to take external capital introduces a different set
of challenges for those founders. While many challenges are cited at the same
level by founders of both types of companies, such as the sense of loneliness
at the top, there were clear differences of opinion on whether others were
amongst the most challenging aspects of being a founder.Notably,founders
of companies who have raised capital were more likely to see access to capital
and talent as a challenge, while founders of bootstrapped companies were more
likely to say that finding mentors was a challenge.
Since you started a company,
what have you found the top
three most challenging aspects
of being a founder? By funded
versus bootstrappedcompanies
54%
Securing access to capital
42%
45%
43%
Finding a reasonable balance between your working and
personal lives
36%
Securing access to talent
28%
29%
Developing as a leader of your company
24%
24%
23%
Feeling lonely at the top
LEGEND
20%
Finding mentors/advisors who add value
31%
Funded
16%
Support from your investors
Unfunded
10%
6
%
Future career/reconversion prospects
9%
Support from family and friends
4%
8%
NOTE:
Founder respondents only. Numbers may not
add to 100 due to rounding.
www.stateofeuropeantech.com
142
In Partnership with
&
143.
06.3Founder Challenges & Well-Being
We tried to explore the most challenging aspects of being a founder that were more or less likely to
be correlated with founders who experience negative or positive impact on their mental health, and
found some clear differences. Respondents who said that being a founder had had a mostly negative
impact on their mental health were materially more likely to point to balance in the personal and
working lives and loneliness at the top as being the most challenges issues.
Since you started a company,
what have you found the top
three most challengingaspects
of being afounder?
53%
Securing access to capital
46%
Finding a reasonable balance between your working and
personal lives
55%
40%
34%
36%
Securing access totalent
25%
Developing as a leader of your company
28%
20%
Finding mentors/advisors who add value
LEGEND
27%
31%
Feeling lonely at the top
Mostly negative impact
Mostly positive impact
18%
17%
Support from your investors
12%
10%
Future career/reconversion prospects
7%
7%
6%
Support from family and friends
0
10
20
40
30
50
60
% ofrespondents
NOTE:
Founder respondents only. Numbers do not
add to 100 as respondents selected up to
three options.
Due to the power dynamic between founders and investors, if the investor
does not set the tone, founders may not feel that asking for help or voicing
a need for support is possible.
Chronicstress and exhaustion are driven
by an imbalance between an employees'
perceived and actual resources, and their
work and demands in the workplace. Stress
and burnout, and then even more severe
symptoms of negative mental health, are often
signs of deeper root causes, which can range
from personaltime management practices to
physical health, and relationships.
and be able to have an honest conversation
when growth expectations are not achievable
because the market is simply not yet there.
MadeleineEvans
Levell
Founder & CEO
Inorder to have open conversations, you need
to have trust and open communication. Due
to the power dynamicbetween founders and
investors, if the investor does not set the tone,
founders maynot feel that asking for help or
voicing a need for support is possible. Investors
need to signal in many different ways that
founders have permission to ask for help, get
support, and talk about their overall mental/
physical health and well-being.
At an individual level, employees and founders
need to be able and supportedto manage the
root causes that allow them to both perform
and be well. At the company level, employees,
founders, and investors need to be able to
manage the need for growth in a smarter way
We also set out to explore what support, if any, founders are receiving from their investors to manage
the pressures they experience. More than half of founder respondents who have raised external
capital state they have received some level of support from their investors, with another 11%saying
they had received significant support. But that leaves nearly 40% of founders who said they had
received no support at all from their investors.
What support, if any, have you
received from your investors to
speci cally help you manage the
pressures of beinga founder?
Significantsupport
11%
Somesupport
46%
Nosupport
38%
Prefer not to say
2%
Other
3%
0
5
10
15
20
25
30
35
40
45
%of respondents who raised external capital
NOTE:
Founder respondents who have raised
external capital only. Numbers may not to
100 due to rounding.
www.stateofeuropeantech.com
143
In Partnership with
&
50
144.
06.3Founder Challenges & Well-Being
Oneinvestor/advisor in particular has been useful but
mostly by being a role model. Oryou see someone else
acting in the right way (e.g. work-life balance, right
morals). Itis easy to keep those standards. Many words
are just hot air.
We also explored if founders who had experienced negative
impact on their mental health were receiving support, and
found that 41%of those founders had received no support
at all from their investors.
What support, if any, have you
received from your investors to
speci cally help you manage the
pressures of beinga founder?
LEGEND
Founders reporting mostly a positive
impact on mental health
Founders reporting mostly a negative
impact on mental health
State ofEuropean
Tech survey
respondent
SUPPORT FROMINVESTORS
38%
of founders who raised external
capital said they had received
no support at all from their
investors to help them manage
the pressures that comes with
being afounder.
15%
Significant support
10%
40%
Somesupport
48%
41%
Nosupport
38%
2%
Prefer not to say
1%
3%
Other
3%
0
5
10
15
20
25
30
35
40
45
50
55
% of respondents
NOTE:
Founder respondents who have raised
external capital only. Numbers may not to
100 due to rounding.
When we asked founders if they would feel comfortable discussing changes in
their mental health with their investors, we saw a clear divide amongst founders.
Those who reported being negatively impacted are much more likely to feel
uncomfortable discussing these changes with their investors - 41% in fact,
compared to only 11%for founders for whom becoming a founder has been a
positive experience.
Would you feel comfortable
discussing changes in your
mental health with yourboard
investors?
Founders reporting mostly positive impact on mental
health
Founders reporting mostly negative impact on mental
health
LEGEND
Yes, I would feel comfortable
Founders reporting no impact on mental health
No, Iwould not feel comfortable
Idon't think it is relevant
Founders uncertain of the impact on mental health
Not able to comment
0
Prefer not to say
10
20
30
40
50
60
70
80
90
% ofrespondents
Other
NOTE:
Founder respondents only. Numbers may not
to 100 due to rounding.
www.stateofeuropeantech.com
144
In Partnership with
&
100
145.
06.3Founder Challenges & Well-Being
Of course, it is a fair question to ask whether founders would actually appreciate
any support from their investors. We found that the large majority,around
two-thirds of founders, state they would indeed appreciate support from
their investors to help manage their mental health. This is true whether their
experience of being a founder has been mostly positive, neutral or negative
(from the perspective of changes to their mental health).
Would you appreciate receiving
support from your
board/investors to speci cally
help you with managing your
mentalhealth?
LEGEND
Yes
Founders reporting mostly positive impact on mental
health
Founders reporting mostly negative impact on mental
health
Founders reporting no impact on mental health
Founders uncertain of the impact on mental health
Founders preferring not to say
No
Other
Prefer not to say
Other
0
10
20
30
50
40
60
70
80
90
100
% ofrespondents
NOTE:
Founder respondents who have raised
external capital only. Numbers may not to
100 due to rounding.
Ithink it wouldbenefit the investments to be more open
about things like [managing mental health], because
you can course-correct [and] save the value of the
investment. But good luck with that.
State ofEuropean
Tech survey
respondent
Photoby:TanuKallio
www.stateofeuropeantech.com
145
In Partnership with
&
146. 06.4 Strong Talent Base
06.4Strong TalentBase
There's a huge competition between cities and countries across Europe to position themselves as
the most attractive place for founders to start up. Given that one-quarter of founders across Europe
are migrants and have moved country to set up and start their companies, this appeal to founder
mobility makes sense. As such, we wanted to explore the considerations that matter to founders
when choosing where to start their companies. From a business perspective, the most important
considerations are access to talent and customers. There is, however, observed variance in the
responses from first-time founders and repeat founders with significant experience. The greater the
level of prior entrepreneurial success, the more likely founders are to consider access to talent as an
important consideration for location choice.
What were the most important
practical business
considerations for you when
choosing where to locate your
company when you foundedit?
Access to talent
Lower cost base
Access to capital/investors
Access to customers
LEGEND
First-time founder
Repeat founder with limited experience in
scaling company
Repeat founder with signi cant
experience in scaling company
Financial incentives (grants, subsidies, etc.)
Friendly regulatory environment
Specific market opportunity
0
10
20
40
30
50
60
% ofrespondents
NOTE:
Founder respondents only. Numbers do not
add to 100 as respondents could choose
multiple responses.
Immigrantfounders are significantly more likely than local founders to have considered access
to capital as an important practical business consideration for choosing where to locate their
company when they founded it. One way to interpret this is that there is a clear incentive for cities and
countries to try to build a strong local investor base to ensure that local talent does not feel the need
to migrate elsewhere to ensure access to capital and investors.
What were the most important
practical business
considerations for you when
choosing where to locate your
company when you foundedit?
37%
Access to talent
45%
27%
Lower cost base
30%
37%
Access to capital/investors
27%
37%
Access to customers
LEGEND
Founder (migrant)
Founder (local)
38%
21%
Financial incentives (grants, subsidies,etc)
21%
21%
Friendly regulatory environment
15%
31%
Specific market opportunity
24%
0
5
10
15
20
25
30
35
40
45
% ofrespondents
NOTE:
Founder respondents only. Numbers do not
add to 100 as respondents could choose
multiple responses.
www.stateofeuropeantech.com
146
In Partnership with
&
50
147.
06.4Strong Talent Base
I think the great strength of Europe's ecosystem is the plurality of
industrial background we have. While Europe may not have the depth of
pure technology experience that,say, the Bay Area does, Iwould argue we
understand finance, fashion, food, manufacturing, aerospace and more at
least as well, if not better.
Ithink the biggest challenge continues to be
the lack of experienced talent, especially for
later-stage companies and especially in the
areas of sales, marketing and product.
We just don't have the decades of large
companies and start-up history that has
churned out legions of people who've seen
it and done it before. We will get there but
some things are hard to accelerate. Ithink the
great strength of Europe's ecosystem is the
plurality of industrial background we have.
While Europe may not have the depth of pure
technology experience that, say, the Bay Area
does, I would argue we understand finance,
fashion, food, manufacturing, aerospace and
more at least as well, if not better.As software
eats the world, these skills and this know-how
will become crucial in building companies that
are about technology but also the context in
which that technology will be used.
Suranga
Chandratillake
Balderton Capital
General Partner
Europe hasmore than 6 million professional developersand hasexperienced steady growth in the
developertalentpool, in contrastto the US, where the professionaldeveloperbasehasbeen static for
the pasttwo years.
LEGEND
Europe
United States
6.1M
6.0
5.7M
5.5M
#of professional developers (million)
Number ofprofessional
developers byregion
4.4M
4.4M
4.3M
4.0
2.0
0.0
2017
2018
2019
Germanyand the UK are the two largest hubs for professional developer talent in absolute numbers,
and together are home to more than 1.7million professional developers.
Map of professional developer
distribution across Europe by
country
LEGEND
up to 1,000,000
8,000,000 to 900,000
700,000to 8,000,000
6,000,000 to700,000
500,000 to 6,000,000
400,000 to 500,000
300,000 to 400,000
200,000 to 300,000
100,000to 200,000
up to 100,000
www.stateofeuropeantech.com
147
In Partnership with
&
148.
06.4Strong Talent Base
The growth in the professional developer talent pool across Europe is a Europe-wide phenomenon,
with all countries (except Luxembourg) experiencing growth in numbers in 2019.
TOP 10
Number of professional
developers by country, 2018vs
2019
Germany
UnitedKingdom
France
Russia
LEGEND
Spain
2018
Netherlands
2019
Italy
Poland
Ukraine
Sweden
0
100,000
200,000
300,000
400,000
500,000
600,000
700,000
800,000
900,000
1,000,000
# of professional developers
RANK11-20
Turkey
Switzerland
Belgium
Romania
Austria
Czechia
Denmark
Portugal
Finland
Hungary
0
20,000
40,000
60,000
80,000
100,000
120,000
140,000
160,000
180,000
# of professional developers
RANK21-30
Ireland
Norway
Greece
Bulgaria
Belarus
Serbia
Slovakia
Croatia
Lithuania
Slovenia
0
10,000
20,000
30,000
40,000
50,000
60,000
70,000
80,000
90,000
# of professional developers
RANK31+
www.stateofeuropeantech.com
148
In Partnership with
&
149.
06.4Strong Talent Base
Europe's larger countries are, of course, home to the largest
developer talent pools. It's useful, therefore, to explore the density
of talent on a relative basis to the general population size of different
countries. When looking on this population-adjusted basis, a number
of smaller countries emerge as having a relatively higher density of
developer talent, such as Sweden, Switzerland or the Netherlands.
CAPITAL INVESTED INEUROPE
6.1m
professional developers in
Europe which represents an
increase of 400,000 compared
to 2018.
Number of professional
developers per 1,000inhabitants
LEGEND
up to 20
16 to18
14to 16
12to 14
10to 12
8 to 10
6to 8
4 to 6
2 to 4
up to 2
NOTE:
Calculated based on the total number of
professional developers in the country in
2019 divided by the total population. World
population gures taken from World
Development Indicators using 2018 world
population data.
The pool of tech talent
in Europe is improving
quickly in terms of quality
and seniority,but there is
still a way to go when you
compare it to the pool in
otherlarger ecosystems,
like those in the Valley.
www.stateofeuropeantech.com
The pool of tech talent in Europe is improving quickly in
quality and seniority, but there is still a way to go when you
compare it with the pool in other larger ecosystems, like
those in the Valley. We're attracting talent from the bigger,
more established tech brands, and those bring with them
experience and learning from more established markets.
This is a good thing for Europe, but it will also be important
to ensure European businesses don't become clones of
those in, for example, the US. Europe has its own startup
style, and I'd love to see that remain a strength.
149
NarenShaam
Omio
Founder & CEO
In Partnership with
&
150.
06.4Strong Talent Base
There is also a wide variance in the distribution of talent in different countries.
Insmaller countries or those with relatively less mature tech ecosystems, there
tends to be a larger concentration of tech talent in a single hub. Other countries,
such as Germany, Italy and Spain, have a more distributed tech talent base,
thanks to the strength of multiple large cities in those countries.
Share ofprofessional developer
talent (%)in the largest hub for
selected European countries in
2019
Copenhagen
86%
Dublin
83%
Brussels
82%
Vienna
80%
Budapest
75%
73%
Amsterdam
64%
Helsinki
60%
Zurich
Istanbul
57%
London
57%
Paris
55%
Prague
54%
Stockholm
52%
Bucharest
49%
Kiev
41%
40%
Moscow
37%
Madrid
33%
Warsaw
27%
Milan
Cologne
18%
0
10
20
30
40
50
60
70
80
90
%of professional developers in given city
NOTE:
% of total professional developers in city as
share of country total.
www.stateofeuropeantech.com
150
In Partnership with
&
151.
06.4Strong Talent Base
Lower density can also make it more difficult to find sought-after talent.
Portugal and Spain are seeing a rise in the %of hard-to-fill software engineer
job postings, a reflection, amongst other factors, of the emerging strength
of local tech ecosystems and, in the case of Portugal, a trend for larger
international companies to build a presence to source local talent.
Change in share (%)ofsoftware
engineer job postings that are
hard to ll, 2018vs2019
27%
Austria
Portugal
LEGEND
16%
% change YoY
15%
Spain
United Kingdom
10%
France
9%
Ireland
8%
Sweden
2%
Belgium
1%
Italy
-1%
Netherlands
-6%
Germany
-12%
Denmark
-12%
NOTE:
%-point change in % of software engineer
jobs that are hard to ll in 2019 versus 2018
by country. Hard to ll is de ned as % of
'software engineer' job postings on the
Indeed site(s) for more than 60 days.
-15
-10
-5
0
5
10
15
20
25
% change in share of software engineer job postings that are hard to ll
The European
ecosystem's greatest
strengthcontinuesto be
the quality of technical
talent, particularly those
coming out of some of
Europe's world-class
universities.
www.stateofeuropeantech.com
We still need to see more startups convert to scale-ups.
One of the challenges is that as our companies scale
there is a small pool of experienced startup execs in
Europe, particularly those who have taken a startup
beyond a couple of hundred people. Competition to hire
experienced startup COOs and CMOs right now is fierce!
The European ecosystem's greatest strength continues
to be the quality of technical talent, particularly those
coming out of some of Europe's world class universities.
It's exciting to see more and more of these technologists
consider a career as a founder, or in a startup, and this
creates a bright long-term future for Europe.
151
Alice Bentinck
Entrepreneur First
Co-founder
In Partnership with
&
152.
06.4Strong Talent Base
The European talent pools searching for tech job postings are overwhelmingly looking for jobs where
they live. Still, there are some differences in countries like Sweden and Portugal where talent is a bit
more open to global mobility.
Share ofsearches (%)for 'tech'
job postings by country ip
addresses
Domestic
Europe
North America
Rest of world
NOTE:
% of searches for 'tech' job postings
LEGEND
100.0
75.0
50.0
25.0
0.0
UK
Netherlands
Italy
France
Germany
Spain
Belgium
Ireland
Sweden
Portugal
'Tech jobs' included in the search for
example: software engineer, programmer,
application developer, UI/UX/graphic
designer, web developer, frontend
developer, backend developer, data
scientist, business intelligence, it support.
Founders don'tneed to
move anymore to build
world-class teams,
because they'refinding
that talent at home.
There is now an abundance of talent across engineering,
product, design and growth. Founders don't need to
move any more to build world-class teams, because
they're finding that talent at home - whether it be from
home-grown successes like Adyen, Spotify, FarFetch or
US tech companies who've expanded here, or from top
engineering schools. It's advantageous and easier to hire
from your network locally, and founders are playing to
their strengths.
Ophelia Brown
Blossom Capital
Founder & Partner
Photoby: PetriAnttila
www.stateofeuropeantech.com
152
In Partnership with
&
153.
06.4Strong Talent Base
A new form of mobility is emerging: flexibility.Europe has a much
larger proportion of professional developers working freelance or
part-time than the United States. CEE countries have the largest
share of freelance professionaldevelopers.
Top 10countries with the largest
share of freelance professional
developers
LEGEND
FREELANCEDEVELOPERS
11%
of professional developers respondents
in Europe work as independent
contractor/freelancers compared to
only 6% in the US.
INDEPENDENT CONTRACTOR, FREELANCERS ORSELF-EMPLOYED
Czech Republic
Ukraine
%of respondents by country
%of respondents by average: European
and US
Poland
Italy
Belgium
Romania
Hungary
Netherlands
Austria
Portugal
European average
United States average
0.0
2.0
4.0
6.0
10.0
8.0
12.0
14.0
16.0
18.0
% of respondents
PART-TIME
Switzerland
Austria
Germany
Netherlands
Czech Republic
Hungary
Denmark
Finland
Norway
Poland
European average
United States average
0.0
2.0
4.0
6.0
8.0
10.0
12.0
14.0
% of respondents
www.stateofeuropeantech.com
153
In Partnership with
&
16.0
154.
06.4Strong Talent Base
As a result, employees are increasingly working remotely, which in turn lowers
the need for mobility between hubs. It is a trend that appears to be materialising
across tech companies of all sizes.
80
Has your companyexperienced
any change in the number of
employees workingremotely?
72%
65%
64%
60
% of respondents
LEGEND
Increase
Nochange
Decrease
40
33%
31%
21%
20
4%
0
Top 10fastest-growing countries
for professional developers, 2018
vs 2019
7%
4%
≤10employees
11-100employees
>100employees
100K+DEVELOPERS
15
LEGEND
15%
YoY growth (%)
European YoY growth (%)
YoY growth(%)
11%
10
9%
8%
8%
6
6
6
6
6
7%
6
6%
6%
6%
6%
Belgium
Turkey
Czech Republic
France
Netherlands
Sweden
Austria
Germany
Switzerland
Poland
5
0
<100KDEVELOPERS
25
23%
22%
20
19%
YoY growth(%)
17%
17%
17%
15
12%
11%
10
10%
6
6
6
6
6
6
6
6
6
8%
6
Cyprus
Montenegro
Croatia
Ireland
Slovenia
Liechtenstein
Azerbaijan
Albania
Finland
Lithuania
5
0
www.stateofeuropeantech.com
154
In Partnership with
&
155.
06.4Strong Talent Base
Indeeddata is able to provide a proxy for the volume of interest in US-based tech job seekers looking
to move to Europe to take up positions working in tech. Looking at searches originating from the
US, but scanning for jobs in Europe as a whole, Indeed's data shows a decline across two successive
years since 2017. This, however, masks an important underlying trend. The decline is entirely
accounted for by a reduced level of interest in UK-based jobs by US tech talent. Incontrast, there
have been two successive years of increase in the relative level of interest of US tech talent in finding
jobs in the rest of Europe (i.e. anywhere else but the UK).
Share by destination
country/region (%)of USoriginated cross-border
searches containing key'tech'
titles
25.6%
Europe
25.2%
23.0%
17.1%
United Kingdom
16.4%
13.6%
LEGEND
2017
2018
8.6%
Rest of Europe
8.8%
2019
9.4%
0.0
2.5
5.0
7.5
10.0
12.5
15.0
17.5
20.0
22.5
25.0
27.5
% of searches
NOTE:
This data shows the %of total searches for
key 'tech' job postings on the local Indeed
country site that are originated from nonnative ip addresses, i.e. from outside the
speci ed country. 'Tech jobs' include:
software engineer, programmer, etc.
Fewer people overall are searching for tech jobs in the UK, but elsewhere in Europe job searches are
up 20% in many countries when compared with 2017.Huge growth in Belgium is supported by a sharp
increase in capital invested in the country (+71%)over the period.
75
Change in number of searches (%)
Change in number (%)oftech
jobs searches per million by
country, 2017H1-2019H1
76%
50
45%
42%
36%
25
31%
30%
27%
26%
26%
7%
0
-3%
-25
NOTE:
This data measures the relative number of
searches per country for tech related job
postings as a share of every million searches
on the local Indeed site for each country.
'Tech jobs' include: software engineer,
programmer, application developer, etc.
The best part is that
thanks to another 2019
milestone, we're open:
When you join a French
startup, our new French
Tech talent visa can get
youandyourfamilyherein
amatter ofweeks witha
4-yearresidencepermit.
www.stateofeuropeantech.com
French Tech is leapfrogging the usual ecosystem
development curve in 2019. Four years ago, serious
capital was hard to come by. Today, our startups are
raising mega-round after mega-round. Our total number
of unicorns doubled in six months. And that was before
President Macron announced €5B making its way into the
tech ecosystem or that he grew the French Tech Mission
10x,making us the biggest (and baddest) pro-startup team
inside modern government. The best part is that thanks
to another 2019 milestone, we're open: When you join a
French startup, our new French Tech talent visa can get
you and your family here in a matter of weeks with a 4-year
residence permit. À bientôt!
155
Kat Borlongan
La French Tech
Director
In Partnership with
&
156. 06.5 Incentivising and Retaining Talent
06.5Incentivising and RetainingTalent
The difference in the level of compensation for founders is material between
Europe and the United States at the early venture stages (Seedto Series B).
Founders in the US have higher base salaries and higher incentive pay. At Series
C, the gap in total compensation closes, driven by higher incentive pay for
European founders, not higher base salary levels.
LEGEND
Basesalary (Europe)
Base salary (United States)
Incentive pay (Europe)
Incentive pay (United States)
Founder base salary and incentives ($)
Founder base salary($)by
funding round in the 50th
percentile byregion
300,000
200,000
100,000
NOTE:
0
Note that at Seed stage some
Founders may not take a base salary
and take incentive pay instead.
Incentive pay is cash bonus or
incentive, which is not related to
equity or equity value. Converted EUR
to USD with an FX rate of 1.1151from 30
October 2019.
Europe
United States
Europe
Seed
United States
Europe
Series A
United States
Europe
Series B
United States
Series C
The average level of founder equity by funding round is closely aligned between
the United States and Europe at the early stages of funding. Post Series C,
European founders maintain more ownership than their American counterparts.
The overall trend in terms of founder equity dilution as companies progress
through multiple funding rounds is important to observe. After their Seed round
founders hold, on average,around 32%equity in their company, but this declines
to less than 15%post-Series C.
LEGEND
Europe
United States
%of founder equity
30.0
Founder equity by fundinground
in the 50th percentile byregion
20.0
31.5%
32.6%
10.0
18.6%
18.3%
13.0%
12.8%
13.6%
9.8%
0.0
Europe
United States
SeedFunding Only
www.stateofeuropeantech.com
156
Europe
United States
Post Series A
Europe
United States
Post Series B
In Partnership with
Europe
United States
Post Series C
&
157.
06.5Incentivising and Retaining Talent
European tech companies have historically lagged behind those from the US in their use of stock
options as an effective tool to attract, incentivise and retain talent. However, looking at Shareworks’
latest employee ownership survey, there are signs that the latest generation of companies from
Europe are now properly rewarding their most talented executives and employees. While there is likely
sample bias because most founders who participate in the survey are likely to a)understand the issue
more and b)be better at remunerating their employees, it is a positive sign. There is still work to do, but
thanks to important efforts to build awareness around the issue, such as NotOptional,more founders
are starting to take this issue seriously, and the rest will hopefully follow suit. European governments
need to pay attention andensure that the implementation of progressive policies around use of stock
options do not lag behind this evolvedattitude amongEuropean founders.
Employee ownership byfunding
round in the 50th percentile by
region
20
Executives (Europe)
Executives (US)
% ofownership
15
LEGEND
10
Staff +other (Europe)
Staff +other (US)
5
Unissued (Europe)
Unissued (US)
0
Europe
United States
United States
Europe
Seed
United States
Europe
Series A
United States
Europe
Series B
Series C
NOTE:
This details equity held by employees and
unissued options excluding founders shares.
Tobe clear, there are more and less favourable environments for the use of stock options in different
European countries. It's interesting in that context to look at differences by geography in how
founders and tech startup employees perceive the effective use of stock options in their companies.
Founders from the UK, which has one of the most favourable environments for the use of stock
options, are more likely to believe that stock options are used effectively in their company. This is
mirrored by responses from employees at UK-based tech startups and scale-ups.
Founders' and employees'views
on stock options being used
effectively to incentivise
employees in mycompany
FOUNDER
UK&Ireland
CEE
DACH
LEGEND
Southern Europe
Agree
Disagree
Neither agree nor disagree
Nordics
France & Benelux
Rest of Europe
0
10
20
30
40
50
60
70
80
90
100
60
70
80
90
100
% of respondents
EMPLOYEE AT A TECH STARTUP ORSCALE-UP
UK & Ireland
France & Benelux
Nordics
CEE
NOTE:
Founder and tech start-up and scale-up
employee respondents from companies with
more than 11employees only. Numbers may
not add to 100 due to rounding.
Rest of Europe
Southern Europe
DACH
0
10
20
30
40
50
% of respondents
www.stateofeuropeantech.com
157
In Partnership with
&
158.
06.5Incentivising and Retaining Talent
It's also interesting to observe how founders of companies that have raised
external capital compare in their responses with founders of bootstrapped
companies. We found that founders who have taken external funding are more
likely than founders of bootstrapped companies to agree that they are using
stock options effectively within their companies to incentivise employees.
LEGEND
60
% ofrespondents
Founder's view on stockoptions
being used effectively to
incentivise employees in their
company
Agree
59%
42%
40%
40
24%
20
19%
17%
Disagree
Neither agree nor disagree
0
Raised external capital
Bootstrapped
NOTE:
Founder respondents from companies with
more than 11employees only. Numbers may
not add to 100 due to rounding.
#Not Optional —Europe must attract more talent to startups.
Policy wheels are turning slowly, butthey
are turning.
Startup associations across Europe, from
Deutsche Startups to France Digitale and
Scale Ireland have held meetings at the most
senior levels and secured commitments to
make rewarding startup talent a priority.
At the World Economic Forum in Davos,
ineffective employee ownership policies
were singled out as a major bottleneck to the
growth of Digital Europe.
Last year at Slush, 30 CEOs and founders
of some of the most well-known European
companies including BlaBlaCar, Klarna,
Revolut, Supercell and TransferWise signed a
letter calling on legislators 'to fix the patchy,
inconsistent and often punitive rules that
govern employee ownership—the practice of
giving staff options to acquire a slice of the
company they're working for.'
A change is afoot in Europe. Finland is
currently in the process of drafting its new
policy, France has made changes to its
scheme for startups and we expect to see
more, Ireland just broadened the scope of
its employee ownership scheme and has
a full-scale review planned for next year,
and Germany, one of the countries with the
worst policy in Europe, is finally responding
to entrepreneurs who've been lobbying for
change for years.
They argued thatstock options is one of the
main levers startups have to recruit the talent
they need. They wrote: 'Ifwe don’t eliminate
the talent bottleneck, we risk squandering
the incredible momentum that European tech
has built up in recent years. The next Google,
Amazon or Netflix could well come from Europe,
but for that to happen, reforming the rules of
employee ownership is definitely not optional.'
Based on our experience working with
entrepreneurs around the world, we strongly
believe that fixing stock option policies will
have material impact on the ability of startups
to grow and create tech giants on par with
those emerging from the US and China.
Within weeks, 500 more CEOs and founders
added their signature to the letter, which
kicked off #NotOptional, a campaign to
bring about change in how stock options are
governed across Europe.
A year on, the European Commission has
actively engaged with the campaign and is
looking for ways to tackle the issue in the
upcoming 5-year term.
www.stateofeuropeantech.com
Martin Mignot
IndexVentures
Partner
Everyone who joined us in signing
#NotOptional can be proud that they've helped
to put the issue on the agenda in Europe. Now
we need to turn positive conversations across
the continent into policy.
158
In Partnership with
&
159.
www.stateofeuropeantech.comIn Partnership with
&
160.
06.5Incentivising and Retaining Talent
The role of stock options as a tool to incentivise talent is particularly relevant in the context of
increased competition for talent within the European tech ecosystem. Larger companies, in
particular, are experiencing increasing competition for talent from both local tech startups and
global giants. If you're an employee at a company with 100+employees, you're more likely to be aware
of your stock options; founders can leverage this insight not only to attract but also to retain talent.
Has your companyexperienced
any changes in the following
talent trends in the last 12
months?
<=10EMPLOYEES
Competition for talent from local startups
LEGEND
Increase
Decrease
Nochange
Competition for talent from global tech companies
Employee awareness of stock options
11-100EMPLOYEES
Competition for talent from global tech companies
Competition for talent from local startups
Employee awareness of stock options
100+EMPLOYEES
Competition for talent from global tech companies
Employee awareness of stock options
Competition for talent from local startups
www.stateofeuropeantech.com
160
In Partnership with
&
161.
06.5Incentivising and Retaining Talent
Beyond financial incentives, employees are
increasingly drawn to companies with strong
missions. This is particularly striking for larger
companiesand could be a differentiating factor
for unlocking a highly sought-after talent base.
INCREASE INCSRFOCUS
71%
Number of employees placing
greater emphasis on corporate
social responsibility bycompany
size
of employees of large tech
companies place greater
emphasis on corporate social
responsibility
71%
57%
49%
47%
LEGEND
38%
Increase
29%
Nochange
Decrease
5%
4%
<10employees
11-100 employees
>100employees
NOTE:
Employee at a tech startup or scale-up
respondents only. Numbers may not add to
100 due to rounding.
We'vebeen blown away by the strong talent across Europe; we've hired
key roles from Uber, Apple, Deliveroo, Spotify and iZettle. We'relucky to
have scaled quickly across Europe and now have three offices with local
teams. The best thing we've done is create a remote-friendly culture
where key and senior roles are not bound to our Swedish base. Infact our
new VP of Marketing joined us a few months ago and is based out of our
London office.
Elsa Bernadotte
Karma
Co-Founder & COO
Photoby:Riikka Vaahtera
www.stateofeuropeantech.com
161
In Partnership with
&
162. Purpose
07Purpose
What is the definition of a purpose-driven tech startup?
The EU competition commissioner Margrethe Vestager has
observed: ‘Some say China has all the data, and the US has all the
money. Butin Europe, wehavepurpose.’ InEuropean tech, purpose
has become a powerful differentiator. European founders aren’t
just aiming for commercial success - they are trying to solve some
of the world’s largest problems. It makes business sense too:
consumers and tech talent alike are demanding companies think
about more than the bottom line.
www.stateofeuropeantech.com
162
In Partnership with
&
163. 07.1 Finding Purpose
Techlashnarrativewww.stateofeuropeantech.com
In the United States the Techlash narrative is driven mostly by
the Tech giants - the Big Tech breakup plan and the Big Tech
backlash account for 26% of the overall narrative. On the other
side of the pond, Europe remains focused on data privacy, but
conversations on antitrust, tech ethics and the gig economy
signal that a bigger Techlash is just around the corner.
163
In Partnership with
&
164.
07.1Finding Purpose
80% of VCs say they assess the potential long-term societal and/or
environmental impact of an investment, in either a pre- or post-investment
timeframe. The largest share of respondents (47%)stated that the impact
assessment happens pre-investment as part of the due diligence process.
When,if at all, doyou assess the
potential long-term societal
and/or environmental impact of
aninvestment?
Pre-investment, as part of the due diligence process
47%
Post-investment, on an ad-hoc basis when the need
arises (change of strategy, pivot, etc..)
18%
Post-investment, on an ongoing basis with defined KPIs
15%
Never, but this is something we are considering
13%
Never, not meaningful
4%
Prefer not to say
3%
Other
1%
0
5
10
15
20
25
35
30
40
45
50
% ofrespondents
NOTE:
Venture capitalists only. Numbers may not
add to 100 due to rounding.
Nearlytwo-thirdsofVCrespondentsagreethatinthelasttwelvemonths European
investors havedemonstrated greater concern aboutthepotential societal or
environmental impactoftheirportfolios.
62%
60
% ofrespondents
Thinking about the past 12
months, do you agree or
disagree with the following:
EuropeanVCsare demonstrating
greater concern about the
potential societal and/or
environmental impact of their
portfolio companies.
40
25%
20
13%
0
Agree
Disagree
Neither agree nor disagree
NOTE:
Venture capitalists only. Numbers may not
add to 100 due to rounding.
We believe that Europe
can take a leading
position in development
and investment in the
ethical use of technology.
www.stateofeuropeantech.com
I am more optimistic about the future of European
technology today than I was 12 months ago although we
are in uncertain times with big problems facing the planet
- from climate change to delivering resources such as
healthcare, food, and education to a global population
approaching 8 billion. Europe is leading the way in building
trustworthy technology by choosing to use its values
to drive the use of technology to the right place. Being
a member of the HLEG-AI group, we published ethical
guidelines for the use of AI, and we believe that Europe can
take a leading position in development and investment in
the ethical use of technology.
164
Loubna Bouarfa
OKRATechnologies
Founder & CEO
In Partnership with
&
165.
07.1Finding Purpose
One in five European founders states their company is already measuring its
societal and/or environmental impact. Only 14%of founders don't believe it's
relevant for their company. Founders who are women are much more likely
to be advanced in their approach to measuring impact.
Does your company measureits
societal or environmental
impact?
25%
Yes
17%
16%
Not yet, but currently in the process of introducing a
measurement tool
9%
24%
No, but this is something we are considering
LEGEND
Women
Men
29%
24%
No, not actively measured but impact is taken into
considerationinour work
26%
8%
No, we don't think it's relevant for our company
16%
1%
Prefer not to say
2%
1%
Other (pleasespecify)
1%
0
5
10
15
20
25
30
% ofrespondents
NOTE:
Founders only. Numbers may not add to 100
due to rounding.
Where founders aren't yet measuring their company's impact, it's mostly
because they are prioritising other things. Investors can lead the way by
prompting founders to think about these issues.
Which of thebelow statements
best describes why you do not
measure your company’s
impact?
Other priorities are more important right now
52%
Our own assessmentis enough
16%
There is a lack of accurate measurement tools on the
market
12%
It is too time-consuming
6%
Other (pleasespecify)
6%
It is not core to our mission
5%
It would be too expensive
3%
0
10
20
30
40
50
% ofrespondents
NOTE:
Founders only. Numbers may not add to 100
due to rounding.
Founders are most likely to measure their company's impact by tracking CO2
emissions. Engaging with customers through surveys or conversation is the
next most common method.
Stated brie y, what type of
impact measurementtechniques
or tools is your company using,
implementing orconsidering?
Carbon/CO2 measurement
75
Talking to customers (e.g. surveys, interviews)
44
Internal functions (e.g. travelling, recycling)
31
Ongoing KPIs
23
B-Corporationcertification
12
Diversity metrics
11
Sustainable Development Goals
0
NOTE:
10
20
30
40
50
60
70
#of mentions
Founders who answered that they measure
their company's impact, are considering it or
are implementing a tool. Keyword analysis
performed on open-ended answers, similar
spellings & keywords aggregated.
www.stateofeuropeantech.com
9
165
In Partnership with
&
80
166.
07.1Finding Purpose
Isee us moving towards
a potentially unhealthy
dual internet: a freefor-all 'poor man's' web
versus a premium web,
and I think businesses
need to try harder
to build products for
broader socio-economic
segments ofsociety.
One interpretation Ihave honed in on around 'tech for good' is
the idea of 'humane technology', as Ithink there's a real need
to think more clearly through the behavioural ramifications
of consumer-tech especially - and its impact on debate/
politics/addiction/mental health/etc. I think we have some
good thinkers along these lines in the UK, butthere remains
a contradiction in terms when it comes to business models
and the need for rapid returns which still prioritise rapid
growth,eye-balls and the attention economy. Isee us moving
towards a potentially unhealthy dual internet: a free-forall 'poor man's' web versus a premium web, and I think
businesses need to try harder to build products for broader
socio-economicsegments of society.
Jessica Butcher
Tick
Co-Founder
Investors are most likely to agree with the statement that European technology entrepreneurs will do
more to address societal challenges in the next decade than European governments. Policymakers
and the media are more sceptical…
Do you agree or disagreewith
the followingstatement?
European technology
entrepreneurs will do more to
address societal challenges
(pollution, congestion, climate
change, food sustainability,
health, etc.) inthe next decade
than European governments.
LEGEND
Angel investor
Venturecapitalist
Other
LP investing in private equity & venture capital
Otherinvestor
Agree
Disagree
Neither agree nor disagree
Employee at a tech startup or scale-up
Consultant/M&A advisor/investmentbanker
Founder
Student
Employee at a company not a tech startup or scale-up
Academic/researcher
Media/journalist
Employee in the public sector
Policymaker/regulator
0
10
20
30
40
50
60
70
80
90
% of respondents
NOTE:
Numbers may not add to 100 due to
rounding.
www.stateofeuropeantech.com
166
In Partnership with
&
100
167.
07.1Finding Purpose
I'mexcited to see a
new generationof
entrepreneurs in Europe
who oppose the 'move
fast and break things'
dogma in favour of a
more thoughtful, more
resilient, truly long-term
approach to business.
'Social innovation' or 'tech for good' is a different approach
to entrepreneurship. One that's in contrast with the
average MBA-grad, who crunched some numbers and,
driven by a search for monetisation, decided to fill a given
market niche. I'm excited to see a new generation of
entrepreneurs in Europe who oppose the 'move fast and
break things' dogma in favour of a more thoughtful, more
resilient, truly long-term approach to business. Isee more
of my entrepreneur friends in Europe looking to build
companies that last 100years, and more of my friends in
SV looking for a quick exit. Both approaches to founding
companies are valid; I just find the first one to be much
more enjoyable.
European founders are trying to solve some of world’s most endemic
challenges, achieving transformative impact on climate change, smart
cities, economic inclusion and other imperatives of our generation. At
the same time, there is an estimated $502B of assets under management
focused on impact investment –and greater focus than ever before from
investorsand consumers alike on sustainability.It’sa very good moment
for the purpose-driven entrepreneur.
Valentina Milanova
Daye
Founder & CEO
Perry Teicher
Orrick
ImpactFinance
Lawyer
Photoby:Jussi Hellsten
www.stateofeuropeantech.com
167
In Partnership with
&
168. 07.2 Purpose-driven Investment
07.2Purpose-drivenInvestment
Measuring purpose-driven
investmentinEuropeantech
2019 saw a huge spike in investment into European tech
companies that are seeking to solve some of humanity's most
pressing problems.
We partnered with Dealroom to try to quantify this trend and
identify the growing universe of purpose-driven venture-backed
European techcompanies.
To do so, Dealroom created a framework to assess venturebacked European tech companies based on their alignment
with the United Nations Sustainable Development Goals.
In this first iteration, the analysis focused on a subset of seven
of the seventeen Sustainable Development Goals, selecting
only those where Dealroom.co has observed greater levels
of European venture-backed startup activity. For each of the
selected SDGs, Dealroom manually assigned keywords used to
tag companies in its platform to search for and identify a firs
set of potential companies for review.
The initial results set was then manually reviewed by Dealroom
analysts to evaluate the companies for fit against one or more
of the SDGs and assign them to those SDGs accordingly.
Additionally, Dealroom's team also manually differentiated all
companies in the dataset based on whether the purpose-driven
impact of the company was ‘core’ to the business model, or a
‘peripheral’ or indirect component of the business model.
Only companies where the purpose-driven impact was
considered core to the business model were included in the final
dataset and analysis. In total, the analysis identified 528 unique
venture-backed, purpose-driven tech companies. The full list can
be accessed on Dealroom's platform here.
We understand the methodology has limitations and see this as a
first attempt to seek to build a more robust analysis of European
purpose-driven tech companies. We welcome feedback and
will update this work both in terms of scope and methodology in
future iterations.
www.stateofeuropeantech.com
168
In Partnership with
&
169.
07.2Purpose-driven Investment
The analysis has an initialfocus on identifying companies
that are addressinga subset of seven of the seventeen
United Nations Sustainable DevelopmentGoals.
Overview of SDGs included in
analysis and mapping to
keywords on Dealroomplatform
Description
Selected DealroomKeywords
SDG 2: Zero Hunger
End hunger, achieve food security and improved
nutrition, and promote sustainable agriculture
Innovative food; food waste; sustainable food;
aquaculture; alternative protein; agritech;meat
substitutes
SDG 3: Health and Well-being
Ensure healthy lives andpromote well-being for all
at allages
Medical devices; health devices; health platforms;
direct-to -consumer health
SDG 6: Clean Water and Sanitation
Ensure availability and sustainable management
of water and sanitation for all
Water; water saving, water treatment
SDG 7: Affordable and Clean Energy
Ensure access to affordable, reliable, sustainable
and modern energy for all
Lithium ion batteries; energy; power; carbon;
renewable energies; energy storage; green
technology; solar energy; electric energy; wind
energy
SDG 11:Sustainable Cities and Communities
Make cities and human settlements inclusive,
safe, resilient, and sustainable
Air quality; public transportation; charging solutions;
urban mobility, advanced mobility; smart city; vertical
farming
SDG 12: Consumption and Production
Ensure sustainable consumption and production
patterns
Second hand; waste management; recycling;
sustainable packaging; sharing economy
SDG 13: ClimateAction
Take urgent action to combat climate change and
its impacts by regulating emissions and
promoting developments in renewable energy
Eco friendly; electric energy; renewable energy;
sustainability
There are more than 500 European tech companies who
received funding since 2005 that are tackling at least
one of the UN's Sustainable Development Goals as a
core part of their mission. SDG 13on Climate Action is
by far the most addressed goal.
Number of purpose-driven
European tech companies per
Sustainable DevelopmentGoal,
2005-2019
SDG 13:Climate Action
410
SDG 7: Affordable and Clean Energy
336
SDG 11:Sustainable Cities and Communities
99
SDG 3: Healthand Well-being
89
SDG 2: Zero Hunger
NOTE:
53
SDG 6: Clean Water and Sanitation
41
SDG 12:Consumption and Production
40
0
50
www.stateofeuropeantech.com
100
150
200
250
300
350
400
450
# ofcompanies
Based on a set of 528 unique companies
identi ed by Dealroom. The sum of all
companies per SDG is greater than that
number as some companies may be
addressing more than one goal.
169
In Partnership with
&
170.
07.2Purpose-driven Investment
Selectedpurpose-drivenEuropeantech
companies
Germany
France
Netherlands
UnitedKingdom
SDG 2: Zero Hunger
SDG 2: ZeroHunger
SDG 2: ZeroHunger
SDG 3: Health and Well-being
Netherlands
Sweden
UnitedKingdom
Sweden
SDG 3: Health and Well-being
SDG 3: Health and Well-being
SDG 7:Affordable and Clean Energy
SDG 7:Affordable and Clean Energy
UnitedKingdom
UnitedKingdom
Sweden
Findland
SDG 12:Consumption and Production
SDG 12:Consumption and Production
SDG 13:Climate Action
SDG 13:Climate Action
Investors have supported purpose-driven European tech companies with over
$4 billion in capital investment in 2019, up more than 6x over the past five years
and taking the cumulative total invested since 2015 to more than $10 billion.
Capital invested ($B) in purposedriven European tech companies
per year
5.0
$4.4B
Capital invested ($B)
4.0
3.0
$1.9B
2.0
$1.5B
$1.2B
1.0
NOTE:
0.0
$0.7B
2015
2016
2017
2018
2019
All Dealroom.co data excludes the following:
biotech, secondary transactions, debt,
lending capital, grants. Please also note the
data excludes Israel. 2019 annualised based
on data to September 2019.
www.stateofeuropeantech.com
170
In Partnership with
&
171.
www.stateofeuropeantech.comIn Partnership with
&
172.
07.2Purpose-driven Investment
This year the number of
purpose-driven European
founders who have
pitched to us has been
overwhelming.
This year the number of purpose-driven European
founders who have pitched to us has been overwhelming.
European founders have the most powerful tech toolkit
in history, and they are stepping up to help solve some of
the world's most pressing challenges such as the climate
crisis and healthcare. In doing so they will build huge
commercial successes, the global category winners of
tomorrow. I believe companies who are purpose driven
will outperform the companies who are not. Being
mission-driven makes business sense. Many consumers
- specifically younger consumers - would rather pay more
for something that's sustainable. Younger employees want
to work for companies with a mission, and they will leave
companies they think are doing things that are negatively
impacting society or the environment.
NiklasZennström
Atomico
Founding Partner
& CEO
Purpose-driven European tech companies have raised huge rounds in 2019,
topped by a $1Binvestment into Sweden's Northvolt, founded in 2016 with the
mission to build the world's greenest battery and enable the European transition
to renewable energy.
Top 10largest deals raised by
purpose-driven techcompanies
in2019
NOTE:
Based on deals announced between 1
January 2019 and 30 September 2019 only.
Company
Description
RoundSize
($M)
Country
Deal Date
1
Northvolt
Lithium-ion batteries
Stockholm
Sweden
1,000
Jun 2019
2
Babylon Health
High quality healthcare via mobile phone
London
United
Kingdom
550
Aug 2019
3
Doctolib
An appointment online to a doctor or dentist
Paris
France
165
Mar 2019
4
Ynsect
Transforms insects into nutrient resource for agriculture
Évry
France
138
Feb 2019
5
Energy Vault
Energy storagetechnology
Lugano
Switzerland
110
Aug 2019
6
Infarm
An urban farming services company
Berlin
Germany
100
Jun 2019
7
docplanner
Booking platform for medical appointments
Warsaw
Poland
88
May 2019
8
Healx
AI platform for rare diseases
Cambridge
United
Kingdom
56
Oct 2019
9
BBOXX
Designs, manufactures anddistributes solar power
systems
London
United
Kingdom
50
Aug 2019
10
Dental
Monitoring
Application designed for self-monitoring dental treatment
Paris
France
50
Mar 2019
For the team here, there's
no bigger motivatorthan
knowing you’re applying
your skills to improving
the lives of patients, their
carers and their families.
www.stateofeuropeantech.com
City
At Healx we believe every rare disease patient deserves
a treatment. It's this belief which drives us to achieve
our mission of taking 100new treatments towards the
clinic by 2025. Having such a clear mission also helps with
recruiting and retaining the best and brightest talent. For
the team here, there's no bigger motivator than knowing
you're applying your skills to improving the lives of
patients, their carers and their families. This is especially
the case for the many team members who count either
themselves or a relative amongst the 400 million people
worldwide living with a rare disease.
172
KateHilyard
Healx
COO
In Partnership with
&
173.
07.2Purpose-driven Investment
'Tech for good'generally
addresses humankind's
most important needs,
which means the largest
markets.
Ÿnsect is a mission-driven company from Day 1.It is
right in our DNA, as we came from an activist nonprofit association. We see more and more projects
and entrepreneurs looking to have an impact, to have
a purpose, with great ideas showing that profits and
impacts can be compatible. Amazing companies like Olio,
NorthVolt, OpenClassRooms or Doctolib demonstrate that
Impact Unicorns won’t be a myth! Europe could become
the best place for 'tech for good' companies, which
will have tremendous positive economical and social
impacts in Europe and beyond, as 'tech for good' generally
addresses humankind's most important needs, which
means the largest markets.
AntoineHubert
Ÿnsect
CEO
As a result of the large funding rounds raised by
some of the leading players, capital invested into
purpose-driven companiesaccounted for more
than 12%of total capital invested into European
tech in 2019, more than double any previous year.
12%
13
%of total capital invested
Capital invested in purposedriven European techcompanies
per year as a share of total
capital invested (%)
10
8
6%
6%
5%
5
3%
NOTE:
All Dealroom.co data excludes the following:
biotech, secondary transactions, debt,
lending capital, grants. Please also note the
data excludes Israel. 2019 annualised based
on data to September 2019.
A significant part of
our own portfolio is
in life sciences and
digital health and clean
growth, mobility and
transportation. Not only
are there social positives
from investing in these
types of companies,
there are also potentially
very large commercial
returns available both for
VCs and LPs.
www.stateofeuropeantech.com
3
2015
2016
2017
2018
Consumers are becoming increasingly values-driven in
their lifestyles and this in turn affects how they spend
their money. Consumers will look for businesses with
values similar to their own, whether that's how a company
improves its environmental impact and treats workers
in their supply chain or the way it works within its local
community. While much of VC is still focussed on areas
like Enterprise Software and Fintech, there are significant
market opportunities in areas that tackle global issues
like efficient energy, sustainable consumption and health
and social care. A significant part of our own portfolio is in
life sciences and digital health and clean growth, mobility
and transportation. Not only are there social positives
from investing in these types of companies, there are also
potentially very large commercial returns available both
for VCs and LPs.
173
2019
ChristineHockley
British Patient
Capital
Director of
Investments
In Partnership with
&
174.
07.2Purpose-driven Investment
The number of deals involving purpose-driven European tech companies
has been increasing steadily over the past five years.
Number of deals involving
purpose-driven Europeantech
companies peryear
171
168
157
150
# ofdeals
133
111
100
50
NOTE:
All Dealroom.co data excludes the following:
biotech, secondary transactions, debt,
lending capital, grants. Please also note the
data excludes Israel. 2019 annualised based
on data to September 2019.
0
2015
2016
2017
2018
2019
Though the absolute number of deals is increasing (when factoring in the
reporting lag) and the share of total deals has been rising consistently,
investments into purpose-driven European tech companies still only
represented less than 5%of all deal activity in 2019.
Deals in purpose-driven
European tech companies per
yearas ashare of total deals (%)
4.4%
4.5
%of total deals
4.0
3.5
3.2%
3.0
2.6%
2.7%
2.5
2.0%
2.0
NOTE:
All Dealroom.co data excludes the following:
biotech, secondary transactions, debt,
lending capital, grants. Please also note the
data excludes Israel. 2019 annualised based
on data to September 2019.
1.5
2015
2016
2017
2018
2019
Photo by:Julius Konttinen
www.stateofeuropeantech.com
174
In Partnership with
&
175.
07.2Purpose-driven Investment
The UK, France and Germanyare home to the highest number of purpose-driven
European tech companies.
Top 20 countries by share of
purpose-driven Europeantech
companies
TOP10
UnitedKingdom
France
L EGEND
% ofpurpose-driven companies
%of all companies
Germany
Netherlands
Sweden
Finland
Spain
Ireland
Italy
Switzerland
0.0
2.5
5.0
7.5
12.5
10.0
15.0
17.5
20.0
22.5
25.0
% of companies
RANK11-20
Belgium
Denmark
Norway
Austria
Poland
Portugal
Russia
Estonia
Hungary
Lithuania
NOTE:
0.0
0.2
0.5
0.7
1.0
1.2
1.5
1.7
2.0
2.2
We’re beginning to see the industry pay attention to other intersections
beyond gender, such as race, class, ability and more. This intersectional
approach supports and celebrates individuals who have multiple
identities, such as black women. Overthe past couple of months, there
have been a number of initiatives supporting these underrepresented
groups, such as EITFood Change Makers Programme; a two-day
hackathon for women and people of colour in the agricultural sector and
Included VC; a 12-monthventure capital fellowship group for marginalised
communities, such as veterans and refugees.
www.stateofeuropeantech.com
2.5
2.7
3.0
% of companies
All Dealroom.co data excludes the following:
biotech, secondary transactions, debt,
lending capital, grants. Please also note the
data excludes Israel. 2019 annualised based
on data to September 2019.
175
OsnatMichaeli
Infarm
Co-Founder
In Partnership with
&
176.
07.2Purpose-driven Investment
But looking on a relative basis, it's clear that some countries are much more
overweight towards purpose-driven tech companies whenbenchmarked against
their overall share of all European tech companies. Sweden, for example, is home
to nearly 10%of purpose-driven tech companies, but accounts for only 4.3%of all
European tech companies, a difference of 5.1%points.
Rank of countries by %-point
difference in relative share of
purpose-driven European tech
companiesversus allEuropean
tech companies
LEGEND
%-point difference
Sweden
4.5
Finland
0.8
Austria
0.4
United Kingdom
0.1
Netherlands
0.0
0.0
Hungary
France
-0.1
Belgium
-0.1
-0.3
Norway
-0.6
Switzerland
Portugal
-0.9
Italy
-1.0
Denmark
-1.1
Russia
-1.2
Estonia
-1.2
-1.5
Ireland
-1.7
Lithuania
-2.0
Poland
-4.2
Germany
Spain
-5.1
-6.0
NOTE:
-5.0
-4.0
-3.0
-2.0
0.0
-1.0
1.0
2.0
3.0
4.0
5
%-point difference
All Dealroom.co data excludes the following:
biotech, secondary transactions, debt,
lending capital, grants. Please also note the
data excludes Israel. 2019 annualised based
on data to September 2019.
In absolute terms, London is the capital of purpose-driven European tech
companies; it is home to nearly one in 10 companies with a purpose-driven
mission. But on a relative basis, Stockholm is by far the number one city, with
the heaviest weighting towards purpose-driven tech companies compared to its
share of all European tech companies.
Top 10European cities by share
of purpose-driven Europeantech
companies
London
Stockholm
Paris
Amsterdam
LEGEND
%of purpose-driven tech companies
%of all European tech companies
Berlin
Helsinki
Dublin
Zurich
Espoo
Delft
NOTE:
0.0
1.0
2.0
3.0
4.0
5.0
6.0
7.0
8.0
9.0
10.0
11.0
12.0
13.0
14.0
% ofcompanies
All Dealroom.co data excludes the following:
biotech, secondary transactions, debt,
lending capital, grants. Please also note the
data excludes Israel. 2019 annualised based
on data to September 2019.
www.stateofeuropeantech.com
176
In Partnership with
&
15.0
177. Places
08Places
What are the best hubs for European tech?
Cluj-Napoca, Romania, Delft, the Netherlands, Minsk, Belarus.
European tech isno longer drivenbyahandfulofcitiesandahandful
of countries. More European countries can say they have created
a billion-dollar tech company. Universities across the region are
creating more spinoffs. And founders are choosing even more to
found where they are, further fueling local tech communities and
setting the stage for the global category winners of tomorrow.
www.stateofeuropeantech.com
177
In Partnership with
&
178. 08.1 Picking Places
08.1PickingPlaces
Getting started
In the People chapter (06.2), we explored a number of the business-related
motivations behind why founders set up their companies where they did. We also
wanted to explore the personal side of this decision. In a European tech ecosystem
where there are so many emerging tech hubs and where people mobility is so
significant, what are the personal factors that shape the decision to start a
company in one city versus the next?
The answer from founders is interesting; for the significant
majority (60%+), regardless of the level of experience,
there is no place like home.
What were the most important
personal considerations for you
when choosing where to locate
your company when youfounded
it?
LEGEND
PICKINGPLACES
60%+
of all founders chose to start
where they live.
65%
64%
Already living there
59%
36%
32%
Strong personal network
42%
32%
37%
37%
Strong and supportive local tech community
29%
29%
Closeto friends and family
24%
First-time founder
22%
Better quality of life
25%
33%
Repeat founder with limited experience in
scaling company
3%
Visarestrictions
Repeat founder with signi cant
experience in scaling company
1%
1%
0
10
20
30
40
50
60
70
% ofrespondents
NOTE:
Founders only. Numbers do not add to 100 as
respondents could choose multiple
responses.
Inthis context, it's interesting to look at how the personal considerations vary for local founders who
have started their companies in their home country versus migrant founders who have started in a
country other than their country of origin. What is clear is that migrant founders are often already in
situ prior to having started their company,perhaps because they had already movedearlier in their
career. This is an important point that reinforces the need for countries not only to focus on attracting
founders from overseas, but also to attract talent before they embark on their entrepreneurial journey.
What were the most important
personal considerations for you
when choosing where to locate
your company when youfounded
it?
LEGEND
55%
Already living there
67%
36%
Strong personal network (mentors, contacts)
36%
43%
Strong and supportive local tech community
32%
19%
Closeto friends and family
Founder(migrant)
31%
33%
Better quality of life
22%
Founder (local)
4%
Visarestrictions
1%
0
10
20
30
40
50
60
70
% ofrespondents
NOTE:
Founders only. Numbers do not add to 100 as
respondents could choose multiple
responses.
www.stateofeuropeantech.com
178
In Partnership with
&
179.
08.1Picking Places
Most founders alsosharedthattheyareunlikelytochangetheiroriginaldecision. Giventhechoicetostart
overandto found andbuildtheircompanyagain, theoverwhelmingmajorityof founders, bothfirst-timers
andrepeat, wouldchooseeithertostayexactlywheretheyareortostayin Europe,butinadifferentcity.
If you were to start over, where
would you choose to found and
build yourcompany?
FOUNDERTYPE
80
71%
67%
Repeat founder with limited experience in
scaling company
Repeat founder with signi cant previous
experience in scaling company
% ofrespondents
First-time founder
60%
60
LEGEND
40
20%
20
21%
14%
8%
6%
0
Inthe same city
8%
4%
6%
4%
5%
3%
3%
In a different European city In a Silicon Valley/Bay Area In a different US city (not Silicon Somewhere else (e.g. Asia)
Valley/Bay Area)
COMPANYSIZE
80
74%
68%
64%
% ofrespondents
60
40
26%
NOTE:
Founders only. Numbers do not add to 100 as
respondents could choose multiple
responses.
20%
20
17%
7%
0
7%
5%
0%
Inthe same city
Still, there are some differences by region worth noting. The interest
for the US and other international hubs remains low, but European
tech founders from CEE and DACH are more likely to pick a location
different from where they started.
4%
0%
4%
2%
0%
In a different European city In a Silicon Valley/Bay Area In a different US city (not Silicon Somewhere else (e.g. Asia)
Valley/Bay Area)
STARTINGOVER
30%
of founders from CEE would pick
a different European city.
If you were to start over, where
would you choose to found and
build yourcompany?
L EGEND
CEE
DACH
France & Benelux
Nordics
Rest of Europe
Inthe same city
Southern Europe
In a different European city
Silicon Valley/Bay Area
In a different US city (not Silicon Somewhere else (e.g. Asia)
Valley/Bay Area)
UK& Ireland
Founders only. Numbers do not add to 100 as
respondents could choose multiple
responses.
Clearly there is waymore
international talent in
French startups than a
few years ago.
www.stateofeuropeantech.com
Clearly there is way more international talent in French
startups than a few years ago. This is for two reasons.
First, President Macron has clearly projected a very
pro-business image of France, which wasn't necessarily
the case before. It's not just political blabla; the quality of
the startups here is also attracting this talent. But part of
it is also that entrepreneurs and startup employees are
looking for new locations different from some of the other,
more traditionally sought-after ecosystems. For example,
I don't hear as many entrepreneurs getting hyped up to
move to Silicon Valley.
179
RoxanneVarza
Station F
Director
In Partnership with
&
180.
08.1Picking Places
Where next?
But staying in Europe does not mean settling for proximity.
European tech founders have international ambition and build
companies with this mindset.
In fact, European scale-ups, i.e. those that have reached $1B+ valuations or
more, are more likely to have internationalised than those in the US. 83% of
European tech scale-ups established an international office versus 70%of tech
scale-ups in the United States. So how do founders chose where to go next?
Share of leading VC-backed
European and Bay Area tech
companies (%)with an
international o ce footprint
European tech companies
83%
17%
LEGEND
International o ce location No
international o ce location
United States tech companies
70%
30%
NOTE:
0
Based on a sample of 80 European tech
companies and 182 Bay Area tech companies
that have reached $1B+ milestone and/or
raised more than $50M in venture capital,
excluding Biotech.
10
20
30
40
60
50
70
80
90
100
110
% ofcompanies
The Top 10 most popular countries for international office locations of
European tech scale-ups is dominated by other European countries, most
frequently the UK and Germany, and then France. But the huge prize of making
a dent in the giant North American market unsurprisingly means that the US
comes in as the second most popular location for international offices for
European tech scale-ups.
Top 10most popular countries
for international o ce locations
of European tech scale-upsthat
have internationalisedtheir
o ce footprint
United Kingdom
73%
United States
66%
Germany
58%
France
43%
Singapore
38%
Australia
36%
Netherlands
34%
Spain
31%
J apan
28%
Sweden
NOTE:
25%
0
www.stateofeuropeantech.com
10
20
30
40
50
60
70
80
% of internationalised companies with o ce in country
Based on a sample of 80 European tech
companies that have reached $B+ milestone
and/or raised more than $50M in venture
capital, excludingBiotech.
180
In Partnership with
&
181.
08.1Picking Places
When you go to market
in your own local market,
youhavea different scale
that you are working
against,which translates
into the availability
(or lack thereof) of
experienced talentyou
can find when youneed
to scale up.
Being a European company is one thing, being a Belgian
company is another. Personally Ibelieve that the biggest
challenge for scaling in Europe is Europe's fragmented
marketplace. When you go to market with a product in
Europe, you aren't going to market in Europe as much
as you are going to market country by country. Every
country has their own identities, languages, cultures,
laws, channels,… which means that - all else being
equal - a dollar (or euro) spent in a US go-to-market
goes a lot further than one distributed over the different
geographies in Europe. If you then look at orders of
magnitude, Belgium has 10M+ people, Germany 80M+,
France 65M+,the UK 66M+,... whereas the US has 330M+
people. This means that when you go to market in your
own local market you have a different scale that you are
working against, which translates into the availability (or
lack thereof) of experienced talent you can find when you
need to scale up.
Stijn Christiaens
Collibra
Co-Founder & CTO
European tech continues to undergo a strong level of geographicdiversification, meaningthat
tech activity is growingin more cities in more countries than ever before. This trend also includes
geographicdiversification within countries and away from the main hubs. There are potential
downsides, of course, but there are also materialbenefits from the lower cost to operate outside
of the main hubs.
Cost of prime rent ($per square
metre per year) for o ce space
bycity, 2Q2019
London
$1,470
Paris
$966
Geneva
$870
Stockholm
$850
Dublin
$796
Zurich
$793
uxembourg
$682
Moscow
$649
Oslo
$644
Frankfurt
$573
Helsinki
$546
Munich
$525
Amsterdam
$500
Rome
$489
Berlin
$477
Madrid
$477
Barcelona
$361
Brussels
$358
Budapest
$355
Vienna
$348
Athens
$341
Warsaw
NOTE:
$327
Lisbon
EUR to USD (1EUR =1.1367 USD) conversion
taken from 30 June 2019 from Bloomberg.
$314
0
200
400
600
800
1,000
1,200
1,400
1,60
$ per square metre per year
www.stateofeuropeantech.com
181
In Partnership with
&
182.
08.1Picking Places
European tech continues to undergo a strong level of geographic diversification, meaning that
tech activity is growing in more cities in more countries than ever before. This trend also includes
geographic diversification within countries and away from the main hubs. There are potential
downsides, of course, but there are also material benefits from the lower cost to operate outside
of the main hubs.
Cost of prime rent ($per square
metre per year) for o ce space
by city in selected countries, 2Q
2019
FRANCE
$966
Paris
$364
Marseille
Lyon
$341
Nice
$261
Lille
$261
Bordeaux
$239
0
100
200
300
500
400
600
700
800
900
1,000
1,1
Prime Rent ($per square metre per year)
GERMANY
$573
Frankfurt
Munich
$525
Berlin
$477
Hamburg
$409
Dusseldorf
$382
$327
Cologne
0
50
100
150
200
250
300
350
400
450
500
550
600
Prime Rent ($per square metre per year)
SPAIN
Madrid
$477
Barcelona
$361
Valencia
$177
$171
Malaga
$164
Zaragoza
Palma de Mallorca
$143
0
50
100
150
200
250
300
350
400
450
500
Prime Rent ($per square metre per year)
UNITEDKINGDOM
NOTE:
Based on data for 2Q 2019. EUR to USD (1EUR
=1.1367USD) conversion taken from 30 June
www.stateofeuropeantech.com
182
In Partnership with
&
650
183.
08.1Picking Places
As consumers are more and more aware that tech is changing
their lives, this conversation between governments and tech is only
going to become more crucial.
For a European tech company, the challenge
is always around paths to expansion. As a
continent, we are made up of many different
markets, with separate cultures and
languages. For a startup in China or the US,
their initial markets are much, much larger.
European startups, on the other hand, have
to think global from day one. This can be their
strength, of course, but to succeed they
have to be absolutely ruthless about product
market fit. The flip side is that we are much
more diverse as a continent, have some of the
best universities in the world (especially for
deep tech) and are more open to regulation.
The latter is something I think will only
become more important. Fintech is a good
example of this already in action —London
became the world leader because the
regulators have been engaging with the
technology, not because it has been left
alone to do its own thing. As consumers are
more and more aware that tech is changing
their lives, this conversation between
governments and tech is only going to
become more crucial.
Simon Cook
DraperEsprit
CEO
The material increase in the cost of prime rent in certain cities over the past five years is certainly a
consideration for founders. InStockholm, for example, office space rental costs are up 76%since
2013, while in Berlin they are up 56%.
TOPTEN
RANK11-20
Malmo
35%
Budapest
30%
Amsterdam
28%
Bristol
27%
Gothenburg
26%
Hamburg
25%
Jersey
25%
Lisbon
24%
Valencia
24%
Riga
23%
0
3
5
8
10
13
15
18
20
23
25
28
30
33
35
38
% change in prime rent per square metre per annum
www.stateofeuropeantech.com
183
In Partnership with
&
40
184.
08.1Picking Places
The cost of office space is perhaps not at the top of the list of considerations for founders when
thinking about where to start and build a company,but the data certainly helps' to understand the
relative cost of different cities, particularly as companies choose to scale and build office presence
across multiple locations as they grow and seek access either to new customers or new talent pools.
UK &IRELAND
Prime rent ($ per squaremetre
per year) by city in selected
countries, Q22018vs Q22019
LEGEND
Q2 2018
Q2 2019
NOTE:
Q2 2018 EUR to USD conversion rate taken
at 1to 1.1663from 30 June 2018; Q2 2019
taken at 1to 1.1367 from 30 June 2019.
FRANCE &BENELUX
CEE
NORDICS
DACH
$849
Stockholm
$855
$870
Geneva
$850
$637
Oslo
$755
Zurich
$644
$793
$560
$573
F rankfurt
$560
Helsinki
$441
Berlin
$371
$477
$378
Hamburg
$313
Malmo
$518
$525
Munich
$546
$357
Gothenburg
$409
$338
$297
Copenhagen
$378
$382
Dusseldorf
$289
$357
Vienna
$348
$227
Aarhus
0
100
$308
Cologne
$221
200
300
400
500
600
700
800
$327
0
900
100
200
300
400
500
700
600
800
900
1,00
Prime Rent ($ per square metre per year)
Prime Rent ($ per square metre per year)
SOUTHERNEUROPE
REST OFEUROPE
$490
$489
Rome
$726
Moscow
$451
Madrid
$477
$649
$343
$361
Barcelona
$478
$350
$341
Athens
$287
Lisbon
$217
Porto
St Petersburg
$475
$314
$246
$503
Istanbul
$151
Valencia
$177
$419
$168
$171
Malaga
$276
$157
$164
Zaragoza
Kiev
$140
$143
Palma de Mallorca
0
50
100
150
$299
200
250
300
350
400
450
500
550
0
Prime Rent ($ per square metre per year)
www.stateofeuropeantech.com
100
200
300
400
500
600
700
Prime Rent ($ per square metre per year)
184
In Partnership with
&
800
185.
08.1Picking Places
Number of professional
developers versus prime rent($
per square metre per year)
versus capital invested ($M)by
city (bubblesize)
Prime rent ($per square metre per year)
Amsterdam has built a growing reputation as an
attractive location choice for international tech
companies to set up overseas offices - and it's
not hard to see why. Itis home to one of Europe's
largest developer talent clusters and also offers
reasonable costs in terms of office space.
1,500
1,000
500
0
0
NOTE:
50,000
100,000
150,000
200,000
250,000
300,000
350,000
400,000
450,000
500,000 550,…
#of professional developers
Bubble size represents the capital invested
amount annualised based on data to
September 2019.
Top 10European cities forcapital
invested ($)per professional
developer
LEGEND
Capital invested per professional
developer ($)
European average($)
NOTE:
Investment amounts are based on capital
invested in the cities in aggregate between
2015 and 2019 9M divided by the total number
of professional developers in the city. Only
cities with at least 50,000 professional
developers in 2019 are included.
www.stateofeuropeantech.com
Capital invested ($)per professional developer
The average capital invested ($)per professional
developer has increased by 23%year-over-year.
Berlin, and now also Munich and Hamburg,rank
in the top 10cities, asserting Germany'sposition
as the technical powerhouse of Europe.
100,000
75,000
50,000
25,000
0
Berlin
185
Stockholm
London
Barcelona
Dublin
Paris
Helsinki
Hamburg
In Partnership with
Munich
&
Bucharest
186.
08.1Picking Places
It is also interesting to assess the capacity of certain countries to mobilise their
talent pool effectively and look at how much capital has been invested based
on the size of the local professional developer talent base. Finland and the
United Kingdom are in the lead, but it is also important to note that countries in
Central & Eastern Europe such as Romania, Lithuania and Estonia are starting to
emerge though being under the radar the year before.
Capital invested ($)per
professional developerby
country
LEGEND
up to 50,000
40,000 to 45,000
35,000to 40,000
30,000 to 35,000
25,000to 30,000
20,000 to 25,000
15,000 to 20,000
10,000to 15,000
5,000to 10,000
up to 5,000
NOTE:
Investment amounts are based on capital
invested in the country in aggregate
between 2015 and 2019 9M divided by the
total number of professional developers in
the country. Only countries with at least 1
million inhabitants included.
European tech can grow faster by tapping into hidden talent pools. The number
of professional developers compared with the amount of capital invested in
countries across the region suggests that countries such as the Netherlands,
Spain and Poland still have the potential to exceed expectations in the European
tech ecosystem.
1,000,000
Germany
#of professional developers
Professional developer talent
pool vs capital invested ($M)by
country, 2015-2019
UnitedKingdom
750,000
France
500,000
Russia
PolandItalyNetherlaSnpdasin
250,000 Ukraine
Turkey
Switzerland
niueiaampruk
ARuoBsmthrnlaggiRaF
C
ayin
l Ilraena
HPzNoeuroDnctrguew
aram
ldn
B
blicSGerueerlgaberaicuaresi
d
a
0
0
5,000
NOTE:
Sweden
10,000
15,000
20,000
25,000
30,000
Capital invested($M)
Capital invested is based on amount invested
in respective countries in aggregate
between 2015 and 2019 9M. Only countries
with at least 50,000 professional developers
in 2019 are included.
www.stateofeuropeantech.com
186
In Partnership with
&
35,000
187.
08.1Picking Places
There are a number
of challenges facing
the tech ecosystemin
Spain. However, the
biggest issue byfar is
a lack of real support
for the tech companies
here, especially when
compared with France or
Portugal.
There are a number of challenges facing the tech
ecosystem in Spain. However, the biggest issue by far
is a lack of real support for the tech companies here,
especially when compared with France or Portugal.
While it's fair to say that policymakers around the world
are wrestling with how to effectively regulate disruptive
technologies, the vast majority are trying to do so without
reigning in or stifling innovation. In Spain, the impact of
regulators so far suggests a determination to hold back
new technologies and new ways of working in favour of
maintaining the traditional industries' status quo. From
our point of view, Spain is the only country (out of the 26 in
which we operate globally) where we haven't been able to
open a constructive dialogue with local regulators around
the labour market rules for startup workers. When you
couple this with rising taxes, and a tax system not adapted
to providing share-based incentives to employees, it can
be difficult for tech companies to gain a foothold in the
Spanish market without quickly becoming embattled.
OscarPierre
Glovo
Co-Founder & CEO
In terms of its strengths, Spain has so much to offer the
global tech community. It's easy to attract top talent,
especially to Barcelona, and there are many good
universities here. The high quality of life and low living
cost also make it much more affordable than other big
European tech hubs, such as London, to set up and launch
a business. And the country's geographical position
makes expansion in Europe easy and gives it a distinct
advantage in Latin America, due to the cultural ties with
that region.
Photo by:Julius Konttinen
www.stateofeuropeantech.com
187
In Partnership with
&
188. 08.2 Budgeting for your (Series) A Team
08.2Budgeting for your (Series)A Team
'Cheatsheet'
How much does it cost to start and build a team in different European cities?
It should be an easy question to answer. Of course, it really isn’t.
We don’t have a perfect answer, but to help we’ve put together an
illustrative org chart for a Series A stage software-as-a-service
(SaaS) company. No two teams are the same, but we think it
provides a reasonable benchmark on what a team might look like
for this type of business at that stage.
We then enriched our ‘dream team’ dataset with data from Aon's
rewards data (covering base salary and actual incentives) and
CBRE’s dataset on the prime rent cost of office space. We then
built this out to give cost benchmarks for ten key European tech
hubs, as well as providing a comparison with the equivalent cost
to build the team from the Bay Area.
No methodology is ever perfect, but this should help founders
(and others) to understand what it costs to set up and build in
different European tech hubs.
Photo by:Julius Konttinen
www.stateofeuropeantech.com
188
In Partnership with
&
189.
08.2Budgeting for your (Series) A Team
Assembling your Series A dreamteam
role / number of headcounts
Engineering
2
2-5
Product
Senior Software
Engineers
Sales &Marketing
1-3 Product Managers
Operations
1Sales Director/VP Sales
1-2 Account Executive
Software Engineers
1
UX Designer
2-4 SDRs
1
DataAnalyst
2-4 Customer Success
Finance
1Operation Manager/
Chief Operations Officer
1Finance Manager
1Office Manager
1HR Manager/Recruiter
1VP/Marketing Director
2-3 Marketing Managers
Budgeting for your team of 20-30people
$M per year
#
CITY
SALARY COST ($M)
OFFICE SPACE COST ($M)
TOTAL COST BASE ($M)
20PPL
AVG.
30PPL
20PPL
AVG.
30PPL
20PPL
AVG.
30PPL
Bay Area
2.81
3.48
4.15
0.29
0.37
0.44
3.11
3.85
4.59
1
London
1.79
2.21
2.62
0.47
0.59
0.71
2.26
2.80
3.33
2
Copenhagen
2.11
2.62
3.12
0.09
0.12
0.14
2.20
2.73
3.26
3
Munich
1.97
2.43
2.90
0.17
0.21
0.25
2.14
2.64
3.15
4
Dublin
1.68
2.08
2.47
0.25
0.32
0.38
1.93
2.39
2.85
5
Paris
1.60
1.96
2.33
0.31
0.39
0.46
1.91
2.35
2.79
6
Amsterdam
1.71
2.10
2.50
0.16
0.20
0.24
1.87
2.30
2.74
7
Berlin
1.67
2.07
2.47
0.15
0.19
0.23
1.82
2.26
2.70
8
Stockholm
1.49
1.85
2.22
0.27
0.34
0.41
1.76
2.19
2.62
9
Barcelona
1.42
1.71
2.00
0.12
0.14
0.17
1.53
1.85
2.17
Madrid
1.32
1.61
1.89
0.15
0.19
0.23
1.47
1.80
2.12
10
NOTES: ‘Series A team’ composition is for illustrative purpose. The headcounts are based on a proprietary dataset of Series A
Software-as-a-Service Series A companies compiled by Atomico. ‘Salaries cost’ is based on Radford’s salary surveys
for technology and sales functions. The data accounts only for base salary and actual incentives ( average 50th
percentile) across a number of job titles best representative of those referred to in the Series A team. For the ‘office
space cost’, the data is based on CBRE estimates ($/sqm) per city and an average of 8 sqm per headcount. For a team
of 20-30 people we estimated that the space required needed to be based on a total headcount of 40-60 people
(respectively) to accommodate for further growth. Radford data is as of July 2019 and CBRE data as of June 2019.
www.stateofeuropeantech.com
189
SOURCE:
In Partnership with
&
190.
www.stateofeuropeantech.comIn Partnership with
&
191.
08.2Budgeting for your (Series) A Team
ANNUAL COST BASE ($K)FOR 20-30 PEOPLE SERIES A TEAM PER CITY
LONDON
BAYAREA
$529k
$941k
$105k
$175k
$168k
$297k
20 people
20 people
$896k
$1,247k
$93k
$150k
$470k
$295k
$699k
$1,316k
$314k
$526k
$168k
30 people
$297k
30 people
$1,351k
$1,861k
$93k
$150k
$706k
$442k
Although London is the most expansive European city overall when taking into account both office
space and talent, Copenhagen and Munich come first when accounting for talent alone.
Annual salary cost ($k) for20-30
people Series A teamper city
20PEOPLE
Madrid
LEGEND
Engineering team salary
Product team salary
Barcelona
Stockholm
Operations team salary
Sales & Marketing team salary
Finance teamsalary
Paris
Berlin
Dublin
Amsterdam
London
Munich
Copenhagen
BayArea
30PEOPLE
Madrid
Barcelona
Stockholm
Paris
Berlin
Dublin
Amsterdam
London
Munich
Copenhagen
BayArea
NOTE:
'Salary cost' based on rewards data from
Aon.
www.stateofeuropeantech.com
191
In Partnership with
&
192. 08.3 Research & Technology Hubs
08.3Research & TechnologyHubs
Europe enjoys a broad technical talent base composed of professionals with a scientific
or technical training background. The UK and Germany are the region's powerhouses, followed
byFrance, Spain andPoland.
Number of scientistsand
engineers bycountry
France
Spain
Poland
Italy
United Kingdom
Sweden
Turkey
Portugal
Germany
Norway
Netherlands
NOTE:
Czech Republic
Belgium
Romania
Ireland
Denmark
Bulgaria
Switzerland
Finland
Austria
Hungary Greece
Serbia SlovakiaLithuaniaCLrouaxetima bourg
Slovenia Malta Latvia EstonMia cedoCnyiaIpcreulsand
'Scientists' and 'engineers' refer to people
who are engaged in professional work on
science and technology. Data is sourced
from Eurostat and gathered by CERN. Latest
data is2018.
Density of researchers and
professional developers by
country versus deep techdeals
per millionpeople
Researchers in R&D per million people
On a population-adjusted basis, the Nordic region is home to countries with the densest research and
developer talent bases. Finland, in particular, has been able to capitalise on a dense technical talent
base to support a proportionately higher number of deep tech deals given its population size. Inthis
graph, the size of the bubbles indicate the number of deep tech deals.
Denmark
7,500
Sweden
Finland
Germany
Belgium
5,000
France Portugal
Spain
2,500
Italy
Austria Switzerland
Netherlands
United Kingdom
Ireland
Poland
Romania
0
0
NOTE:
2,500
7,500
5,000
10,000
12,500
15,000
17,500
20,000
Professional developers per million people
Only countries with 10,000+ developers and
10+deep tech rounds included. Funding data
from Dealroom, developer data from Stack
Over ow. Research data from Eurostat,
gathered by CERN. Numbers adjusted per
capitafor clarity.
www.stateofeuropeantech.com
192
In Partnership with
&
193.
08.3Research & Technology Hubs
A profound and exciting
wind of change is blowing
through Europe.
European Universities are simply among the very best in the
world for research and IP contributions, especially in deep
tech. Yet, until a few years ago, they were also quite modest
in their commercial aspirations, certainly compared to the
United States. But a profound and exciting wind of change
is blowing through Europe. A new generation of European
entrepreneurs and academics are setting their sights at
building world class global companies. Many are not willing
to expat to the US to find success anymore. And they
can count on a growing support ecosystem that is taking
root here, e.g. the launch of CDL in the UK in 2019 (and in
Paris next year), or new funds such as OSI(Oxford)and CIC
(Cambridge) willing to support founders with the patient
capital necessary for deep tech startups. And the world has
taken notice, with many of the large North American and
Asian funds now turning their attention to Europe, opening
offices and/or announcing growth funds specific to Europe.
Very exciting.
PatrickPichette
Inovia Capital
General Partner
The large research community in Europe continues to be a prolific source of ideas and a knowledge
factory globally,on par with the US.
Number of publicationsin
Europe, China and theUS
20,116
United States
19,859
LEGEND
2018
16,583
2017
Europe
16,298
12,340
China
NOTE:
9,229
'Count' refers to a fractional count that takes
into account the percentage of authors from
that institution/country and the number of
a liated institutions per paper. Data
sourced via Nature Index and gathered by
CERN.
Europe doesn't only stand out by the size of its talent pool; the quality of the research originating
from Europe is world-class, with 4 of the top 10global research institutions based in Germany,
France and the United Kingdom.
Research institution
Top 10global research
institutions by contributorsto
research papers,2019
NOTE:
NOTE:
Country
Count
1
Chinese Academy of Science
China
1,698
2
Harvard University
United States
875
3
Max Planck Society
Germany
757
4
National Centre for Scientific Research
France
690
5
Stanford University
United States
622
6
Massachusetts Institute of Technology
United States
560
7
Helmholtz Association of German Research Centres
Germany
483
8
University of Cambridge
United Kingdom
438
9
University of Tokyo
Japan
431
10
Peking University
China
412
'Count' refers to a fractional count that takes
into account the percentage of authors from
that institution/country and the number of
a liated institutions per paper. Data
sourced via Nature Index and gathered by
CERN.
www.stateofeuropeantech.com
193
In Partnership with
&
194.
08.3Research & Technology Hubs
Historically, US research has often been more application-driven than
European research, which could be a clue to understandingthe US' success in
commercialisingresearch. Ithink the bridges between different communities
are stronger in the US, especially between investors andthe startup community.
However, the European tech ecosystem has a lot to offer for deep tech. For
example, Europe publishes more research papers related to artificialintelligence
than either China or the US. At CERN, we are looking for investors interested in our
AIsolutions, so we invite them to look for opportunities on this side of the pond.
GiovanniAnelli
CERN
Head of Knowledge
Transfer Group
On the global scene, China continues to grow its research capabilities at an impressive rate and,
while the number of patents for both Europe and the US is mostly stagnant year on year, their
share is in decline.
100
Share of patents (%)led by
region of origin over the years
75
China
Europe
% ofpatents
LEGEND
50
United States
Rest of world
25
0
2008
2009
2010
2011
2012
2013
2014
2015
2016
2017
But Europe is particularly well positioned to win in a number of technology fields, often tied to the
strength of traditional industries and the presence of large incumbents in certain regions. For
example, Europe is in the lead for both the mobility and robotics space. Meanwhile, Europe is still
lagging behind in software & computer technology.
Share of patents (%)per
technology eld per region,
2014-2018
Engines, pumps, turbines
Mechanical elements
Transport
Organic fine chemistry Analysis
of biological materials
LEGEND
Europe
Biotechnology
Micro-structural and nano-technology
Pharmaceuticals
China
United States
Medical technology
Other consumer goods
Rest of world
Handling
Civilengineering
Measurement
Thermal processes and apparatus
Other special machines
Chemical engineering
Basic communication processes
Macromolecular chemistry, polymers
Textile and paper machines
Surface technology, coating
Basic materials chemistry
Electrical machinery, apparatus, energy
Environmental technology
Materials, metallurgy
Furniture, games
Machine tools
Food chemistry
Control
Digital communication
Telecommunications
Optics
Semiconductors
Audio-visual technology
Computer technology
IT methods for management
www.stateofeuropeantech.com
194
In Partnership with
&
2018
195.
08.3Research & Technology Hubs
Europeistryingtocatchupthough, withthe"ITmethods for management" categorybeingoneofthe
fastest-growingpatenttechnologyfieldsin Europe.Thisisthecategorythatistheclosestapproximation
to 'software',accordingtothedefinitionsusedbythe WorldIntellectual PropertyOrganisation.
Fastest-growing patent
technology elds in Europe,
2009-2013vs 2014-2018
ITmethods for management
27%
Transport
20%
Digitalcommunications
17%
Mechanical elements
17%
Electrical machinery, apparatus, energy
17%
Control
16%
Otherspecial machines
16%
Micro-structural andnano-technology
15%
Medical technology
14%
Biotechnology
14%
Measurement
11%
Otherconsumer goods
11%
Handling
8%
Engines,pumps, turbines
7%
Optics
7%
Macromolecularchemistry, polymers
5%
Environmental technology
5%
Computer technology
5%
Materials, metallurgy
4%
Chemical engineering
3%
Basic materials chemistry
2%
Analysis of biological materials
2%
Furniture, games
1%
Civilengineering
1%
Surface technology, coating
0%
Foodchemistry
-1%
Machinetools
-3%
Semiconductors
-5%
Textile andpaper machines
-6%
Basiccommunication processes
-6%
Thermal processes and apparatus
NOTE:
WIPO statistics database. Data last updated
October 2019.
-7%
Pharmaceuticals
-8%
Audio-visual technology
-13%
Organic fine chemistry
Telecommunications
-14%
-
19%
The growth of Europe's most dynamic tech hubs - London, Berlin,
Amsterdam, Stockholm, Helsinki, Dublin and others - along with the
accompanying inflow of investment, is driving a steady reorientation
of talent, not only from Europe but from countries outside of Europe including my native Israel - to help meet demand. Our business, which
requires highly trained individuals in plant biology and plant science, also
benefits from the pool of master’s and Ph.D candidates so plentiful in
European markets.
www.stateofeuropeantech.com
195
OsnatMichaeli
Infarm
Co-Founder
In Partnership with
&
196.
08.3Research & Technology Hubs
MobilityhasbeenconsistentlyintheleadinEuropeoverthepast 5 yearsaswellas Health/Pharmaceuticals.
Number of patents per
technology eld per year, 20142018
LEGEND
up to 45,000
35,000to 40,000
30,000 to 35,000
25,000to 30,000
20,000 to 25,000
15,000 to 20,000
10,000to 15,000
5,000to 10,000
2,500to 5,000
1,000to 2,500
Transport
lectrical machinery, apparatus, energy
Medical technology
Measurement
Pharmaceuticals
Mechanical elements
Otherspecial machines
Civil engineering
Engines, pumps, turbines
Computer technology
Handling
Digital communication
Organic finechemistry
Biotechnology
Basic materials chemistry
Chemical engineering
Other consumer goods
Machine tools
Furniture, games
Materials, metallurgy
Control
Macromolecular chemistry,polymers
Optics
Semiconductors
Thermal processes and apparatus
Audio-visual technology
Food chemistry
Environmental technology
Surface technology, coating
Textile and paper machines
Telecommunications
Analysis of biological materials
IT methods for management
Basic communication processes
Micro-structural and nano-technology
2014
2015
2016
2017
2018
up to 1,000
NOTE:
WIPO statistics database. Data last updated
in October2019.
Itshould not come as a surprise that Germanyleads by a long way on the number of patents in Europe
and is home to a strong and dynamic base of traditional transport/mobility corporations.
Cumulative number ofpatents
led by country oforigin
(thousands)
Germany
France
UnitedKingdom
Switzerland
Netherlands
Russia
Italy
Sweden
Finland
Austria
0
250
500
750
1,000
1,250
1,500
1,750
2,000
# of patents led (thousands)
NOTE:
Cumulative number of patents between 2008
and 2018.
www.stateofeuropeantech.com
196
In Partnership with
&
197.
Research & Technology HubsEurope is consistently recognised as one of the most promising
sources of talent in computer science globally. Indeed,Europe is
home to 25%of the Top 50 universities in the world for computer
science, including 4 of the top 10 and the overall number one
institution, the University of Oxford.
European universitiesamong
global top 50 in computer
science and their globalrank
NOTE:
'Rank' refers to position in global list of top 50
institutions for computer science
quali cations. Compiled by the Times Higher
Education Supplement and includes 749
universities across the world.
COMPUTERSCIENCE
25%
of the top 50 universities in the
world for computer science are
based inEurope.
University
Country
1
University of Oxford
United Kingdom
3
ETH Zurich
Switzerland
5
University of Cambridge
United Kingdom
7
Imperial College London
United Kingdom
18
Technical University of Munich
Germany
19
UCL
United Kingdom
20
École Polytechnique Fédérale de Lausanne
Switzerland
24
University of Edinburgh
United Kingdom
34
Paris Sciences et Lettres - PSL Research University Paris
France
46
RWTH Aachen University
Germany
47
Delft University of Technology
Netherlands
50
Karlsruhe Institute of Technology
Germany
Yet, despite Europe's long-standing strengths in research, the majority of the European tech
community does not agree that European universities are effectively commercialising intellectual
property developed by academic research. Most notably,academics, researchers and policymakers
were most likely to disagree that European universities are effective.
Do you agree or disagreewith
the followingstatement?
European universitieseffectively
commercialise intellectual
property (knowledge,
technology, etc.) developed by
academicresearch
Founder
Policymaker/regulator
Academic/researcher
Angel investor
LEGEND
Other investor
Agree
Disagree
Neither agree nor disagree
Venture capitalist
Employee at a company that is not a tech startup or
scale-up
Employee at a tech startup or scale-up
Employee in the public sector
Other (please specify)
Consultant/M&A advisor/investment banker
LP investing in private equity & venture capital
Media/journalist
Student
0
10
20
30
40
50
60
70
80
90
%of respondents
NOTE:
Numbers may not add to 100 due to
rounding.
www.stateofeuropeantech.com
197
In Partnership with
&
100
198.
08.3Research & Technology Hubs
When asked directly how to better support the research community to start companies and help
them succeed, respondents who are academics/researchers pointed to changing the terms of
research funding away from publication and towards commercialisation, as well as educating
universities to change their mindset towards being able to encourage and better support spinoffs.
If you were to pick one action
from the list below that would
better support the
academic/research community
to start companies and help
them succeed, what would itbe?
Increased research funding aimed at idea
commercialisation vs.publications
26%
Universities encouraging and supporting spinoffs
20%
Improved collaboration with large corporations
18%
Increased pre-seed venture capital (<$250k) available
17%
Increased access to startup support organisation or
program
13%
Better terms offered by universities for spinoffs
6%
0
5
15
10
20
25
% of respondents
NOTE:
Academics/researchers only. Numbers may
not add to 100 due to rounding.
Although there is likely a sample bias in the responses to the survey, it's noteworthy that threequarters of respondents who work in academia or research shared that they have seen an increase
in the level of interest of people in their networks in starting or joining tech startups.
Thinking about your academicor
research network (i.e. other
academics, researchers,
students, etc.), have you
observed any change in the level
of interest in starting or joining
tech startups in the last 12
months?
% of respondents
0
10
20
30
40
50
60
70
80
90
100
110
%change in level of interest over the last 12 months
NOTE:
Academics/researchers only. Numbers may
not add to 100 due to rounding.
www.stateofeuropeantech.com
198
In Partnership with
&
199.
08.3Research & Technology Hubs
I believe the academic
and business sectors are
currently fragmented and
stuck in tunnel vision. We
need to align both sectors
to drive the development
of our technology in
the right direction and
achieve globalscale for
our tech.
Ibelieve the academic and business sectors are currently
fragmented and stuck in tunnel vision. We need to align
both sectors to drive the development of our technology
in the right direction and achieve global scale for our tech.
Academia needs the freedom to do research; however,
it needs to align training, researcher upskilling, and the
ideas of innovation towards meeting future goals that
are aligned with big competitive ambitions for Europe.
Ideas that come out of academia need to be feasible
for implementation in an industry setting, therefore
we need to see each other as partners not as rivals. In
many instances academia sees business as funders or
as processors, not as partners to reshape the world.
Simultaneously, businesses see academia as long-term
vision R&D partners, and business goals are not aligned
with academic collaboration. I believe the two should
create a real partnership, through an agile work mindset
with clear short- and long-term goals.
LoubnaBouarfa
OKRATechnologies
Founder & CEO
Though the interest levels in starting or joining startups is increasing, there remain barriers to this
happening. When asked about the main reservations they have, lack of funding was given as the most
frequently cited reservation by academics and researchers when considering whether to start or join
a startup. Risk appetite and fear of failure also appear to be a continuing factor given the strength of
consideration regarding future career/reconversion prospects.
What are the mainreservations
you would have when
considering whether to startor
join astartup?
Lack of funding
44
Future career/reconversion prospects
29%
Lack of certain skills (e.g. coding, sales, product)
24%
Inability to find a co-founder
24%
Unattractive lifestyle
18%
Lack of knowledge on how to get started
15%
Lack of ideas
13%
Lack of mental support
12%
Lack of support from incubators/accelerators
11%
Lack of support from family/friends
9%
Lack of successful role models in Europe
6%
Lack of support from universities
6%
0
5
10
15
20
25
30
35
40
% of respondents
NOTE:
Academics/researchers only. Numbers do
not add to 100 as respondents could select
multiples choices.
www.stateofeuropeantech.com
199
In Partnership with
&
45
200.
08.3Research & Technology Hubs
Given those concerns, it shouldn't be surprising that students themselves cite increased access
to startup support organisations or programs as the number one action that could better support
them. These offer the promise for students to access groups to share knowledge, experiences and
connections in a way that can have a meaningful impact at the beginning of the startup journey.
If you were to pick one action
from the list below that would
better support students tostart
companies and help them
succeed, what would itbe?
Increased access to startup support organisation or
program
26%
Universities encouraging and supporting spinoffs
21%
Improved collaboration with large corporations
17%
Increased pre-seed venture capital (<$250k) available
17%
Increased research funding aimed at idea
commercialisationvs. publications
10%
Better terms offered by universities for spinoffs
6%
Other
2%
0
5
15
10
20
25
% of respondents
NOTE:
Studens only. Numbers may not add to 100
due to rounding.
Hubs that combine mature ecosystems to provide initial support as well as worldclass laboratory and research space are best equipped to produce high quality
companies. Inthat respect Oxford, Cambridge,London, Paris and Berlin still lead
the pack…There, talent investors like EF, programs like the Creative Destruction
Lab in Oxford (and soon in Paris), or dedicated funds like OSI or the PSL
Innovation Fund, continue to grow the top of the funnel. That said, some research
ecosystems are very strong on specific themes and remain completely under
the radar –Cork University in the microbiome, EPFL and ETH in construction,
Montpellier in ecology, the University of Wageningen in Food Science &
Technology or the University of Delft in biotech are examples that stand out.
Alex Terrien
Future Positive
Capital
Co-Founder
Countries where universities help students materialise their entrepreneurial calling are also likely
to benefit in the long term as we see a high proportion of founders starting their companies in the
countries where they studied.
Share of founders (%)who
founded their companies inthe
countries theystudied
University of Oxford, United Kingdom
HEC Paris, France
KTH, Sweden
LEGEND
Stayed in country
UK
Germany
France
Switzerland
Imperial College, United Kingdom
University of Cambridge, United Kingdom
ESCP Europe, France
LSE, United Kingdom
INSEAD,France
Rest of Europe
0
10
20
30
40
50
60
70
80
90
% offounders
www.stateofeuropeantech.com
200
In Partnership with
&
100
201.
08.3Research & Technology Hubs
Looking beyondthe faculty to the students themselves, it is interesting to explore their core reservations
about starting or joining a startup. For students, a lack of confidence in how to get started is the most
frequently cited reservation. This is followed byconcerns about funding,having the right skillset and also
obtaining the necessary knowledge on how to get going.
What are the mainreservations
you would have when
considering whether to startor
join astartup?
NOTE:
Students only. Numbers do not add to 100 as
respondents could select multiples choices.
There is now positive momentum in the level of deals and capital investedinto spinoffs
from European universities.
Number of deals andcapital
invested in Europe-based
university spinoffs
Capital invested($M)
300
4,000
Capital invested ($M)
# of deals
350
$4,889M
$3,317M
$3,190M
250
3,000
201
2,000
200
179
$1,593M
154
$1,698M
150
1,000
0
2015
2016
2017
2018
100
2019
NOTE:
2019 annualised based on data to September
2019.
Although Germany and Switzerland are respectively leading on the overall number of patents and the
number of patents per capita, universities in the United Kingdom accounted for the largest share of
European university spinoff activity.
Number of deals in Europebased university spinoffsby
country
300
UK
Germany
# ofdeals
LEGEND
200
Switzerland
France
100
Ireland
Belgium
Netherlands
0
2015
2016
2017
2018
2019
Rest of Europe
NOTE:
Based on data from September 2018 to
September 2019.
www.stateofeuropeantech.com
201
In Partnership with
&
# ofdeals
LEGEND
335
327
5,000
202.
08.3Research & Technology Hubs
Looking across Europe at the volume of capital raised by spinouts from top European universities
over the past 12months, it's clear that it is a very mixed bag. There are positive signs from the United
Kingdom and Switzerland, but beyond those places the level of spinoff activity from universities from
elsewhere in Europe is limited.
Top European universitiesby
total capital raised ($M)by
spinoffs
University of Cambridge
$337.2M
University College London
$123.5M
University of Oxford
$87.2M
École Polytechnique Fédérale de Lausanne
$56.0M
ETH Zurich
$37.8M
University of Innsbruck
$11.1M
Imperial CollegeLondon
$8.9M
University of Turin
NOTE:
Based on data from September 2018 to
September 2019.
$6.3M
TrinityCollege Dublin
$1.7M
Nottingham University
$1.7M
Technical University of Munich
$1.5M
KU Leuven
$1.2M
0.0
50.0
100.0
150.0
200.0
250.0
300.0
350.0
Totalcapital raised ($M)
The days of the ivory tower are rapidly receding as European universities
and the tech industry learn to dance together.
European universities and the tech industry
are cooperating more and more. 'Deep
tech' is not just a cool label, it is a viable
investment model with its own logic: identify
game-changing technologies, assemble
diverse teams, build viable business
models, and have lots of patience! This
kind of entrepreneurship happens not only
at the technical universities, such as Aalto
University or TU Munich, but also at the
traditional research universities in Paris or
London. At Oxford, we are spinning off more
than two new tech ventures every month, and
we also have countless student-led startups,
supported by university programmes such
as at the Oxford Foundry. The boundaries
between universities and the commercial
world are increasingly blurred. Oxford
Science Innovation is a private venture firm,
www.stateofeuropeantech.com
yet it is entirely focused on the university’s
spinoffs. And at the Creative Destruction
Lab (CDL-Oxford), we are bringing together
business mentors, scientists and students,
all with a common goal of accelerating
exceptional AI ventures that come from
anywhere in the UK and beyond. The appetite
for joint academic-industry initiatives is
enormous, especially among young students
and tech executives. Academics and policy
makers are waking up to the opportunities
too. There is still a lot to do, including
reforming IP and tech transfer policies,
rethinking incentives in academia, and even
reimagining the role of universities within
their local ecosystems. Yet the days of the
ivory tower are rapidly receding as European
universities and the tech industry learn to
dance together.
202
ThomasHellmann
Saïd Business
School
University of Oxford
DP World Professor
of Entrepreneurship
and Innovation
In Partnership with
&
203. 08.4 Trending Hubs & Communities
08.4Trending Hubs &Communities
Strong andsupportive
Founders picked the presence of a strong personal network and
a supportive local tech community as two of the top three most
important personal considerations for choosing where to start.
Europe continues to flourish and to experience growth rates in the number of
cities hosting over 100 tech-related Meetup events. 2019 in particular registered
an almost 50% increase year over year.
170
Number of European cities with
100+tech-related Meetup events
per year
# of European cities
150
110
100
117
90
70
50
0
2015
2016
2017
2018
2019
NOTE:
2019 annualised based on data to end of
September 2019.
Photoby:SamuliPentti
www.stateofeuropeantech.com
203
In Partnership with
&
204.
08.4Trending Hubs & Communities
Europe'slargestandmostmaturetechcommunitiescontinuetoseeaslowyetsteadyincreaseinthe
levelofparticipationintech-related Meetupevents. Levelofparticipationoutsidethetop 5 hubsis
growingevenfasteryearonyear, especiallyincitiessuchas Hamburg, Istanbulor Zurich, tonameafew.
Top 20 hubs by level of techrelated Meetup activity in 2019,
ranked by number ofattendees
TOP 5HUBS
LEGEND
London
300,000
Paris
Amsterdam
Munich
#of Meetup attendees
Berlin
200,000
100,000
0
2015
2016
2017
2018
2019
2015
2016
2017
2018
2019
2015
2016
2017
2018
2019
2015
2016
2017
2018
2019
HUBS6-10
LEGEND
80,000
Istanbul
Warsaw
Barcelona
Hamburg
#of Meetup attendees
Madrid
60,000
40,000
20,000
0
HUBS11-15
LEGEND
50,000
Dublin
Zürich
Manchester
Oslo
40,000
#of Meetup attendees
Stockholm
30,000
20,000
10,000
0
HUBS16-20
40,000
LEGEND
Budapest
Lisbon
Frankfurt
Vienna
30,000
#of Meetup attendees
Wroclaw
20,000
10,000
0
NOTE:
Based on Stack Over ow's 2019 survey.
Experience relates to years since learning to
code.
www.stateofeuropeantech.com
204
In Partnership with
&
205.
08.4Trending Hubs & Communities
European tech communities are also expanding
beyond the largest hubs. The share of techrelated Meetup events outside the top 20 hubs
has consistently increased over the years.
100
Distribution of tech-related
Meetup events in and outsidetop
20 hubs inEurope
%in top 20 hubs
%outside top 20 hubs
%of tech-related Meetups
LEGEND
75
48%
49%
52%
54%
55%
52%
51%
48%
46%
45%
2015
2016
2017
2018
2019
2016
2017
2018
2019
50
25
0
Infact, we are seeing a trend of 'decentralisation'
as the share of attendees in tech-related Meetup
events decreases year on year.
80
Share of attendees in techrelated Meetup events intop
hubs vs. nationwide
London
Berlin
Paris
% of attendees in top hubs
LEGEND
70
60
50
40
Stockholm
Amsterdam
30
20
2015
NOTE:
2019 annualised based on data to September
2019.
This year alone, we've
invested for the first
time in Prague, Milanand
Aarhus.
www.stateofeuropeantech.com
Europe is unique in its model of multiple technology hubs
across the continent, which has meant that no single
place has the depth and breadth of a Silicon Valley. But we
are now seeing unprecedented levels of entrepreneurial
activity across the region, not just in the traditional hubs
of London, Paris and Stockholm. This year alone, we've
invested for the first time in Prague, Milan and Aarhus.
When these markets are taken together, they show a
true diversity in sector and approach - from fintech to
healthtech and enterprise automation. The fragmentation
also means that talent is dispersed and companies need to
be mindful of location as they scale.
205
Sonali deRycker
Accel
Partner
In Partnership with
&
206.
08.4Trending Hubs & Communities
As the number of options keeps growing every year, top tech hubs such as London, Berlin, Barcelona,
Paris, and Copenhagen are losing their popularity amongst founders.
Top hubs where founders would
start a company tomorrow, 2018
vs 2019
41%
London
37%
40%
Berlin
34%
20%
Barcelona
LEGEND
%of votes 2018
18%
20%
Paris
%of votes 2019
15%
12%
Amsterdam
15%
12%
Lisbon
10%
6%
Munich
8%
6%
Milan
7%
5%
Tallinn
7%
6%
6%
Stockholm
6%
Dublin
5%
4%
5%
Madrid
4%
Vienna
5%
6%
Zurich
5%
3%
TelAviv
4%
6%
Copenhagen
4%
3%
Warsaw
4%
1%
Oslo
3%
2%
3%
Edinburgh
NOTE:
1%
Brussels
Founders were asked to allocate three votes
in the survey. Percentages indicate the share
of founders that cited each named city.
3%
0
We need to build up
stronger relationships
between these local
ecosystemsso as to form
a pan-Europeannetwork
and improve liquidity
in the markets for both
talent and capital.
www.stateofeuropeantech.com
5
10
15
20
25
30
35
40
% ofvotes
Local ecosystems are still too isolated from each other.
Whenever you visit a European capital, you can always
spot interesting things on the ground: entrepreneurs with
higher ambitions; angel investors with an improving track
record; venture capital firms with more capital to deploy;
and more technical talent willing to join the startup
world. However, every single city in Europe ignores all the
others —with the one notable exception of London. And I
think that's the biggest challenge we need to tackle. We
need to build up stronger relationships between these
local ecosystems so as to form a pan-European network
and improve liquidity on the markets for both talent and
capital. Also, we're still waiting for the European tech
world to inspire its own culture, one that would make
it possible for people from different countries and
backgrounds to work together. Distributed teams are all
the rage now, including in Silicon Valley. But you can't work
as a distributed team if that team is not cemented by a
common culture. We need that pan-European tech culture
if we want people from various European countries to
work together and build successful tech companies.
206
Nicolas Colin
The Family
Co-Founder&
Director
In Partnership with
&
207.
08.4Trending Hubs & Communities
Bright future ahead for Central & Eastern Europe
Central and Eastern Europe have come to the limelight in the last 12months.
Not only because of the record level of capital invested in Romania and the rise
of UiPath to a $1B+company but also because of their leadership in areas such as
diversity and technical talent pool. So the growth of tech communities across CEE
countries is great news for Europe as a whole.
Europe continues to see geographic diversity amongst the Top 20 fastestgrowing tech hubs by year-on-year growth to tech-related Meetup events. Iasi,
a city in Romania where United State's tech giant Amazon set up office space,
ranked number two as the fastest-growing community overall.
Top 20 fastest-growing tech
hubs in Europe byyear-on-year
growth of attendees to techrelated Meetup events percity
HUBS1-10
Darmstadt, Germany
119%
Iasi,Romania
111%
Nürnberg, Germany
82%
Montpellier, France
74%
Aarhus, Denmark
69%
Basel, Switzerland
69%
Izmir, Turkey
67%
Bern, Switzerland
67%
Milton Keynes, United Kingdom
59%
Zaragoza, Spain
57%
0
20
40
60
80
100
120
YoYgrowth (%)
HUBS 11-20
56%
Stuttgart, Germany
Newcastle,United Kingdom
55%
A Coruña, Spain
52%
Tallinn,Estonia
51%
Gliwice, Poland
50%
Exeter, United Kingdom
46%
Gdansk, Poland
46%
Bonn, Germany
45%
Reading, United Kingdom
45%
Minsk, Belarus
44%
0
5
10
15
20
25
30
35
40
45
50
55
60
YoYgrowth (%)
NOTE:
2019 annualised based on RSVPs to end of
September 2019. Only hubs with at least
1,000 RSVPs in 2018 are included.
Central & Eastern European cities dominate the list of top ten fastest-growing
hubs by growth of active members year-on-year.
Top 10fastest-growing hubs in
Europe by YoY growth rate of
active members intech-related
Meetups
Kharkiv, Ukraine
96%
Iasi,Romania
90%
Izmir, Turkey
88%
Gliwice, Poland
79%
Cologne, Germany
78%
Novosibirsk, Russia
73%
Minsk, Belarus
62%
Darmstadt, Germany
56%
Stuttgart, Germany
55%
Bern, Switzerland
NOTE:
54%
0
10
20
30
40
50
60
70
80
90
100
YoY growth (%)
2019 annualised based on active members to
end of September 2019. Only cities with over
1,000 active members in 2018 are included.
www.stateofeuropeantech.com
207
In Partnership with
&
110
208.
08.4Trending Hubs & Communities
Central & Eastern Europe also dominates the list of top ten countries by Compound Annual Growth
Rate (CAGR)of active members since 2015. Albania, the leading country in this category, has seen a
CAGR of 267%.
2015
Top 10countries by growth of
active members intech-related
Meetup groups
NOTE:
CAGR =Compound Annual Growth Rate. 2019
annualised based on active members to end
of September 2019. Only countries with over
1,000 active members in 2018 are included.
A number of successful
acquisitions of Belarusian
startups started a boom
in the Belarusian startup
ecosystem.
2016
2017
2018
2019
CAGR 2015-2019
Albania
58
226
746
1,037
1,064
267%
Macedonia
136
503
543
1,036
1,584
133%
Belarus
270
637
975
1,687
2,721
102%
Turkey
8,020
17,689
36,903
51,145
75,228
88%
Russia
6,477
13,662
24,067
37,474
52,455
62%
Bulgaria
1,043
2,972
3,937
6,347
7,913
52%
Czech Republic
3,267
7,423
11,663
15,313
21,703
33%
Ukraine
5,101
11,052
18,385
24,437
30,493
20%
Portugal
5,541
11,320
16,670
22,665
32,232
16%
Bosniaand Herzegovina
337
858
1,451
1,615
1,932
15%
In Belarus, a drastic difference between the average
compensation in IT and in general in the country drives
a lot of people to acquire an education and a job in IT.A
number of successful acquisitions of Belarusian startups
(maps.me acquired by Mail.Ru, MSQRD by Facebook,
AIMATTER by Google, etc.) started a boom in the
Belarusian startup ecosystem. It was further accelerated
when the The Decree on Development of Digital Economy
passed in December 2017and greatly improved the tax and
legal regime of the High Tech Park. It is now relatively easy
for a startup to apply for the HTP regulation and make use
of tax benefits and simpler legal regulation.
YuryMelnichek
Bulba Ventures
Co-Founder &
Partner
Photoby:SamuliPentti
www.stateofeuropeantech.com
208
In Partnership with
&
209.
08.4Trending Hubs & Communities
28 cities have made the list of European cities surpassing 1,000 members of tech groups for the first time.
European cities surpassing1,000
members of tech-relatedMeetup
groups for the rst time in 2019
ranked by YoYgrowth
Country
2015
2016
2017
2018
2019
YoY growth2018-2019
Bursa
Turkey
60
91
193
396
1,324
234%
Würzburg
Germany
69
206
397
625
1,117
79%
Szczecin
Poland
180
349
538
880
1,429
62%
Skopje
Macedonia
102
417
432
907
1,440
59%
Kazan
Russia
186
225
439
725
1,140
57%
Lublin
Poland
137
470
644
704
1,087
54%
Coimbra
Portugal
228
368
501
690
1,036
50%
Braga
Portugal
157
332
619
727
1,085
49%
Bydgoszcz
Poland
87
292
507
720
1,068
48%
Chisinau
Moldova
285
572
717
925
1,345
45%
Amstelveen
Netherlands
321
553
842
941
1,365
45%
Tampere
Finland
308
491
853
919
1,328
45%
Stavanger
Norway
555
792
787
759
1,096
44%
Augsburg
Germany
205
394
676
815
1,164
43%
Bochum
Germany
139
266
478
744
1,055
42%
Firenze
Italy
217
397
593
938
1,319
41%
Wiesbaden
Germany
177
332
579
919
1,280
39%
Mainz
Germany
174
363
620
930
1,288
39%
Milton Keynes
United Kingdom
307
674
777
909
1,217
34%
Espoo
Finland
492
771
866
840
1,103
31%
Coventry
United Kingdom
454
651
822
851
1,115
31%
Enschede
Netherlands
315
567
681
834
1,081
30%
Kaunas
Lithuania
108
223
498
932
1,171
26%
Luzern
Switzerland
407
688
814
883
1,087
23%
Bournemouth
United Kingdom
362
613
996
983
1,152
17%
York
United Kingdom
274
499
714
753
1,024
36%
Büyükçekmece
Turkey
35
112
429
810
1,016
25%
Eskisehir
Turkey
41
90
930
947
1,004
6%
NOTE:
2019 annualised based on active members to
end of September 2019.
www.stateofeuropeantech.com
209
In Partnership with
&
210. Policy
09Policy
What can policymakers do to best help European tech?
European policymakers will play a critical role in determining the
speed at which European tech can fulfil its potential, but too many
founders are still in the dark about the policy vision for technology.
Policymakers need to maintain focus on what’s going on inside
Europe, and be less distracted by external factors. By paying
attention to the priorities of founders, and delivering on initiatives
like the Digital Single Market, policymakers can create optimal
conditions for innovation and growth in Europe.
www.stateofeuropeantech.com
210
In Partnership with
&
211. 09.1 Europe Policy Focus
09.1Europe PolicyFocus
Measuring policy focus inEurope
The datachallenge
According to our survey respondents, Margrethe Vestager had the most impact
in European tech this year. She came first by a long mile with 12%of respondents’
votes. In fact 40% who picked the EU competition commissioner were founders/
employee of tech startups and 10%were part of the VC community. As such, our
aim in this article is to identify opportunities for improved collaboration between
policymakers and the European tech community. To do this, we used Politico Pro
Intelligence to analyse the activity of the European Parliament (the legislative
branch of the European Union) during the last term of the European Parliament
(2014to 2019)to better understand the policy conversation around a number of key
topics for the tech community. The European Parliament, as the body that debates
and approves policy legislation, is where we can see the 'end result' of the European
policy agenda that is set by the European Commission. In other words, it's a useful
proxy for actual policy outcomes that may have a nearer-term impact on the
European tech ecosystem. If it were possible, we would extend the analysis to
cover the European Commission, which creates and proposes the forward-looking
policy agenda for the European Union, to be able to complement this analysis with
a longer-term view on future policy focus.
Activities and press releases provide a sense of what is being talked about and
the responses to those discussions. Legislative documents on the other end tell
us what makes it into draft policies.
Overview ofEuropean
Parliamentdata
Information
Type
Description
Why Is It Useful?
1
Activities
This data looks specifically at keywords occurrences in
parliamentary questions, speeches and debates made
by electedlegislators.
Activities are a good proxy for the prevalence of selected technologyrelated discussions taking place at the EP.
2
Press
releases
This data focuses on keywords occurences in
commentaries and responses from the various agen cies
and other moving parts of government.
Press releases are a proxy for the response of the EP to these
discussions and the communication back to the public. This should
translate into greater awareness of the issues at hand (and proposed
solutions) of the public.
3
Legislation
This data looks at the number of keywords occurences
related to legislative documentation, which relates to
the ongoing process of law making, actual bills,
procedures, etc.
Legislation is a proxy for the 'outcome' of 'activities', as it takes
discussions a step further into the process of law making.
NOTE:
We look at the number of keyword
occurrences relating to a set of selected
technology-related topics in the European
Parliament.
www.stateofeuropeantech.com
211
In Partnership with
&
212.
09.1Europe Policy Focus
Weinterrogated European Parliamentdocumentationovertheperiod 2014-2019
togetasenseofwhichtopicssurfacedmostfrequentlyintermsofmentionsin
activitiesandpressreleases. Itmightbesurprisingtoseethat Big Tech companies
fromthe USwerecitedmorefrequentlythananyothertopic, surpassingeven
Brexit.Dataprivacy-relatedterms,includingGDPR,cameinthird.
5,000
#of mentions
Numberof mentions of keyword
occurrences related to key
topics in European Parliament
activities and press releases,
2014-2019
2,500
LEGEND
# of mentions
0
# of mentions (median of all topics)
NOTE:
This data looks at the number of keyword
occurrences related to key tech topics in
European Parliament activities and press
releases.
An analysis of European Parliament activities shows that Brexit has, of course,
been a huge distraction in the European Parliament over the past 4 years.
Numberof mentions of Brexit in
European Parliament activities
and press releases peryear
1,011
1,000
1,056
853
#of mentions
794
750
500
250
0
0
2014
43
2015
2016
2017
2018
2019
NOTE:
This data looks at the number of keyword
occurrences related to Brexit in European
Parliament activities and press releases.
The level of focus on data privacy and GDPR during the previous European
Parliament term is not a surprise. Itwas, arguably,the centrepiece
of EU tech-related policy of the last parliamentary term. Following the
implementation of GDPR in May 2018,it’s now taken up materially less airtime
in the European Parliament.
Number of mentions of data
privacy or GDPR in European
Parliament activities andpress
releases peryear
610
600
585
#of mentions
527
400
238
228
200
136
NOTE:
0
2014
2015
2016
2017
2018
2019
This data looks at the number of keyword
occurrences related to data privacy issues in
European Parliament activities and press
releases.
www.stateofeuropeantech.com
212
In Partnership with
&
213.
09.1Europe Policy Focus
We also believe that
privacy is going to be a
huge topic globally, and
as our laws are more
stringentin Europe –as a
result of GDPR –we are in
a better position to adapt
to our users’ expectations
as we expand globally.
As a business, we think globally –we don’t think locally.
We were born with the need to be international from
the beginning because our users demand it. The youth
of today are inherently global, and they seek fashion
inspiration from all over the world. This has forced us
to look at how our business can be more appealing
to other markets from day one. We also believe that
privacy is going to be a huge topic globally, and as our laws
are more stringent in Europe –as a result of GDPR –we are
in a better position to adapt to our users’ expectations
as we expand globally.
MariaRaga
Depop
CEO
The Digital Single Market has been an important area of attention from European
parliamentarians, especially leading up to and including 2016, but given the
widespreadagreement on the importance of creating a unified digital market,
the drop in the level of discussion since 2016 is notable.
Number of mentions of Digital
Single Market in European
Parliament activities andpress
releases peryear
675
#of mentions
600
400
372
361
330
275
237
200
0
NOTE:
2014
2015
2016
2017
2018
2019
This data looks at the number of keyword
occurrences related to Digital Single Market
in European Parliament activities and press
releases.
More recently, there’s been a surge of discussion around disinformation.Deep
fakes clearly caught the attention of Europe’s legislators, just as they captured
the attention of the public.
Number of mentions of
disinformation/deepfakes in
European Parliamentactivities
and press releases peryear
200
187
167
#of mentions
150
100
50
31
NOTE:
0
2
2014
38
11
2015
2016
2017
2018
2019
This data looks at the number of keyword
occurrences related to
disinformation/deepfakes in European
Parliament activities and press releases.
www.stateofeuropeantech.com
213
In Partnership with
&
214.
09.1Europe Policy Focus
What’s interesting is just how little discussion, on a relative basis, there
is around topics such as fintech or digital health, where European startups
have had a huge impact on the global technology stage.
63
Number of mentions of ntech
and digital health in European
Parliament activities andpress
releases peryear
Fintech
#of mentions
LEGEND
60
40
Digitalhealth
17
20
7
1
0
NOTE:
28
26
25
23
21
2014
10
3
2015
2016
2017
2018
2019
This data looks at the number of keyword
occurrences related to ntech/digitalhealth
European Parliament activities and press
releases.
For fintechs, European
regulators havefostered
an environment in which
challengers can prosper
on a level playing field
with incumbents, e.g.
the Bank of England
opening up settlement
accounts to non-banks.
This forward-thinking
approach is setting the
standard for regulators
all over the world, and is
a huge advantage for the
European market.
European tech continues to prosper, and it’s very likely
the next giant will have started here. There are two crucial
elements to this growth. Critically, later-stage VC money is
no longer confined to Silicon Valley, removing the pressure
for tech firms to relocate for scale. That’s had a massive
impact on the likes of TransferWise, Monzo and N26, who
have been able to grow,hire and innovate so much faster. For
fintechs, European regulators have fostered an environment
in which challengers can prosperon a level playing field with
incumbents, e.g. the Bank of England opening up settlement
accounts to non-banks. This forward-thinking approach is
setting the standardfor regulators all over the world, and is a
huge advantage for the European market. A year ago, Brexit
was my big concern in continuing this momentum. Assuming
we lose the regulatory passporting rights the EU provides,
how would the current high-growth firms handle the need
to get regulated in multiple countries? Would TransferWise
and others be able to continue to hire the talent we need to
scale? Todayit’s clear the current crop of scale-ups will meet
this challenge. Most, like TransferWise, have already taken
the steps needed to mitigate all possible Brexit outcomes. My
next concern is how we help the next generation of startups
also thrive, so that London in particular continues to be
attractive as a HQto grow a business.
TaavetHinrikus
TransferWise
Co-Founder &
Chairman
While it seems the European Parliament woke up to AIsome time in 2016,
it has yet to put strategically important and thriving deep tech fields like
Quantum Computing and Gene Editing on its policy agenda.
LEGEND
200
150
#of mentions
Number of mentions of Arti cial
Intelligence, Quantum
Computing and Genetic Editing
in European Parliament
activities and press releasesper
year
100
Arti cial Intelligence
Quantum Computing
50
Genetic Editing
0
2014
2015
2016
2017
2018
2019
NOTE:
This data looks at the number of keyword
occurrences related to arti cial intelligence,
quantum computing and genetic editing in
European Parliament activities and press
releases.
www.stateofeuropeantech.com
214
In Partnership with
&
215.
09.1Europe Policy Focus
European information governance rules are strong on privacy
protection, but there are few contractual standards in place,
which makes it expensive and time-consuming to form bespoke
partnerships with every single institution.
Owkin is playing an important role
in increasing collaboration between academic,
biopharma and healthcare institutions
by championing a new class of technology
called Federated Learning. FedAI allows
researchers to collaborate and train predictive
models on the decentralised data within
disparate institutions, to reveal insights on
mechanism of action, or drivers of disease
progression, while entirely safeguarding
patient privacy by sending the models to
the data and never removing data from the
hospital firewalls.
More could be done by governments to support
collaboration. In America, for example,
hospitals have a standard contract form called
a business association agreement (BAA)
which standardises how third parties access
anonymised patient data. It is a rigorous but
standard process. European information
governance rules are strong on privacy
protection, but there are few contractual
standards in place, which makes it expensive
and time-consuming to form bespoke
partnerships with every single institution.
However, Iam confident that these issues are
being worked on, and that Europe is moving
in the right direction for both attracting and
retaining great health tech talent.
ThomasClozel
Owkin
Co-Founder & CEO
Taxationis, of course, a national competence and what is said in the European Parliament has no
legal standing, but it’s still relevant to explore discussion on the topic to understand where priorities
lie. We can also see that while the idea of a digital tax has gained traction in European parliament
activities, there has been less discussion around key startup-related taxation changes, such as to
the tax treatment of stock options.
Number of mentions of digital
tax and stock options in
European Parliamentactivities
and press releases peryear
Digital tax
#of mentions
LEGEND
43
39
40
30
22
20
20
20
Stock options
14
10
NOTE:
10
8
0
0
0
0
2014
2015
2016
2017
9
2018
2019
This data looks at the number of keyword
occurrences related to digital tax and stock
options in European Parliament activities
and press releases.
The greater level of discussion in the European Parliament on the idea of a digitaltax compared with
stock option tax reform is better understood when examining which types of tech companies have
taken up greater mindshare of European policymakers.
LEGEND
US big tech companies
2,381
2,500
2,000
#of mentions
Numberof mentions of selected
US big tech companies versus
European tech companies in
European Parliament activities
and press releases peryear
1,500
954
1,000
European tech companies
929
710
608
500
202
0
NOTE:
10
9
14
14
15
6
2014
2015
2016
2017
2018
2019
Data looks at the number of keyword
occurrences related to select US big tech
(i.e. Google, Facebook, Twitter, Apple,
Microsoft, Amazon) and European tech
companies (i.e. Spotify, Skype, Adyen) in
European Parliament activities and press
releases.
www.stateofeuropeantech.com
215
In Partnership with
&
216.
09.1Europe Policy Focus
The overall trends outlined in terms of the analysis of European Parliament
activities and press releases also filter down into the focus areas of legislative
documentation during the last parliamentary term.
Numberof mentions of keytechrelated issues in European
Parliament legislative
documents by topic, 2014-2019
Data privacy/GDPR
497
Content & copyright
159
Digital SingleMarket
152
Platform workers/gig economy
149
Artificial Intelligence
93
72
US big tech companies
59
Brexit
Fintech
48
Capital gains taxation
45
Disinformation/deepfakes
41
Drones
36
Stock options
32
Blockchain/crypto
23
Digitalhealth
18
Autonomous vehicles/mobility
15
Digitaltax
6
Quantum Computing
5
European tech
5
Big Tech 2
Genome editing 1
0
50
100
150
200
250
300
350
400
450
500
550
# ofmentions
NOTE:
This data looks at the number of keyword
occurrences of key tech-related issues in
European Parliament legislation.
wwwwww.sstaateeoofeeuurooppeeaannteecchh.ccoomm
216
IInnPPaarrttnneerrsshhippwwitthh
&
217.
09.1Europe Policy Focus
The rise of AI,big data, gig workers, facial recognition technology and
5Ghas given rise to a new set of human rights issues. And governments
are turning their attention to the human rights impact of the adoption
and use of technology.
The healthcare platform that connects with
patients around the world.
The disruptive consumer electronics innovator
that makes and sells a new kind of device.
The delivery app that relies on gig workers.
The AIpioneer who utilises facial
recognition technology.
What do they all have in common?
They are exciting tech company models
that also present growing exposure
to human rights concerns.
Human rights may not be the first topic you
associate with the state of the European tech
ecosystem. But the reputational, financial
and legal hazards once associated primarily
with the mistreatment of physical labourers
have moved into the digital world. The rise of
AI, big data, gig workers, facial recognition
technology and 5G has given rise to a new set
of human rights issues. And governments are
turning their attention to the human rights
impact of the adoption and use of technology.
A valuable conversation is emerging about
‘responsible technology’ —preventing,
addressing and remediating the negative
impacts of technology on human rights, and
ensuring its ethical design, deploymentand
use. And Europe is in the driver’s seat on
‘responsible AI’. InApril 2019,the European
Commission’s High-Level Expert Group
on AI presented the ‘Ethics Guidelines for
Trustworthy Artificial Intelligence’, which are
underpinned by international human rights
law and identify seven key requirements for AI
systems to be deemed trustworthy.
The Council of Europe Commissioner for
Human Rights also published this year a
10-point recommendation on AI and human
rights. The report recommends that member
states establish procedures for conducting
human rights impact assessments, among
other things.
BetsyPopken
Orrick
Special Counsel,
Business and Human
Rights
OECDalso published its own Principles on AI
this year, calling for AIsystems to be designed
in a way that respects human rights.
At the same time, more tech companies
worldwide are opting in to the UN Guiding
Principles on Business and Human Rights and
joining multi-stakeholder initiatives aimed at
promoting human rights and ethics in tech, like
the Global Network Initiative, Partnership
on AIand the World Economic Forum’s ethical
tech projects.
There’s a lot to unpack here – and different
schemes need to be reconciled. But, if you’re
at a company looking to get started on these
issues – as both a moral imperative and a
business and risk management matter – we
suggest three key steps: (1)a human rights
impact assessment, which will help you
understand and prioritize areas of risk for your
particular business model, (2) integration of
human rights considerations into your existing
compliance processes and policies, and (3)
engagement with key stakeholders, including
your board.
This is a growing area of focus for companies,
investors and consumers, as this year’s SOET
report confirms.
Be on the forefront.
Photoby:SamuliPentti
www.stateofeuropeantech.com
217
In Partnership with
&
218.
09.2Tech’s Take onPolicy
We need clearer
objectivesto successfully
regulate the European
tech ecosystem.
We need clearer objectives to successfully regulate
the European tech ecosystem. Are we trying to create
sustainable employment and solve major societal
challenges like health and the environment? Or is our chief
objective to focus our resources on policing companies
from other regions? These goals are not necessarily
mutually exclusive. Major technology firms undoubtedly
need sustained scrutiny. Still, the political world needs to
define a European approach, which balances our ambitions
for robust tech regulation with an understanding of what’s
needed for our companies to scale.
Linda Griffin
King
VP,Global Public
Policy
We used the survey to explore what matters most to more than 1,200 European
tech founders when it comes to potential policy support. The priorities they shared
focused mostly on policy to create the conditions that make it more appealing for
companies to attract, retain and replace talent. Founder respondents cited the
introduction of simplified employee regulations across Europe as the number one
regulatory change that would have a materially positive impact on the prospects
of their business. For founders of companies who have raised external capital,
this is followed by better taxation of employee stock options. The harmonisation
of tech-related regulation across Europe also scores highly for founders of both
bootstrapped and externally funded companies.
What is one regulatory change
that would have a materially
positive impacton the prospects
of yourbusiness?
37%
Simplified employment regulations
37%
20%
Better taxation of employee stock options
8%
20%
More harmonised technology regulation across Europe
24%
LEGEND
Raised external capital
17%
More favorable capital gains taxation across Europe
22%
Bootstrapped
6%
Other
8%
0
5
10
15
20
25
30
35
%ofrespondents
NOTE:
Founder respondents only. Numbers may not
add to 100 due to rounding.
www.stateofeuropeantech.com
218
In Partnership with
&
40
219.
09.2Tech’s Take on Policy
At present, there are
too many instances of
governments trying to
apply existinglegislation
-legislation that was
drafted in a pre-digital
age to respond to the
needs of a different
type of work and a
different type of worker
-to startups and new
technologies.
I think the approach in Europe differs from country to
country. In countries like the UK, France and Portugal,
while still recognising a need to regulate certain aspects
of the tech community, there’s greater openness to
disruptive innovation. Whereas in Spain there’s a distinct
lack of trust at the government level. However, what we
need is a new regulatory framework that focusses on the
digital economy. Ifind it hard to believe there are some
countries in Europe that fail to see the potential of the
digital revolution and the long-term socio-economic
benefits that come with it. At present, there are too
many instances of governments trying to apply existing
legislation - legislation that was drafted in a pre-digital
age to respond to the needs of a different type of work
and a different type of worker - to startups and new
technologies. The digital age has brought about a sea
change in the global economy - changing the ways in which
we live, communicate, work and consume - and we need
regulatory modernisation to really reflect those changes.
Otherwise, we run the risk of slamming the brakes on the
digital economy. Today, we see millions of people around
the world signing up for platform jobs, and yet there’s still
no clear regulation that balances their requirement for
flexibility and their need for increased social benefits. If
we’re going to move forward, then this cannot continue.
OscarPierre
Glovo
Co-founder & CEO
There are clear differences in what matters most to founders of funded
companies of different scales. Interestingly,the importance of better taxation
of stock options is much more likely to be cited by companies that have gained
significant scale (i.e. more than 100 employees), while they are far less likely to
be concerned about changes to improve the harmonisation of tech regulation
across Europe or more favourable capital gains taxation
What is one regulatory change
that would have a materially
positive impacton the prospects
of yourbusiness?
≤10employees
LEGEND
Simpli ed employment regulations
11-100employees
Better taxation of employee stock
options
More favorable capital gains taxation
across Europe
>100employees
More harmonised technology regulation
across Europe
Other
0
10
20
30
40
50
60
70
80
90
% of respondents
NOTE:
Founder respondents of companies who
have raised external capital only. Numbers
may not add to 100 due to rounding.
www.stateofeuropeantech.com
219
In Partnership with
&
100
220.
09.2Tech’s Take on Policy
We also asked the European tech community to share their view on who is
most impacted by the regulatory burden in Europe today. Whether they are
empirically right or wrong,the perception of respondents from most occupation
groups, including European tech founders and investors, is that the burden is
being carried by the region’s tech startups.
Who do you think is most
impacted by the regulatory
burden amongst thefollowing?
LEGEND
FOUNDERS, TECH EMPLOYEES,INVESTORS
Founder
Employee at a tech startup or scale-up
Tech startups
Established private tech companies
Venturecapitalist
Established public tech companies
Non-tech SMEs
No difference
LP investing in private equity & venture capital
Angelinvestor
Otherinvestor
0
10
20
30
40
60
50
70
80
90
100
90
100
% of respondents
OTHEROCCUPATIONS
Academic/researcher
Consultant/ M&A advisor/investment banker
Employee at a company that is not a tech startup or
scale-up
Employeein the public sector
Media/journalist
Other (pleasespecify)
Policymaker/regulator
Student
0
10
20
30
40
60
50
70
80
% of respondents
NOTE:
Numbers may not add to 100 due to
rounding.
www.stateofeuropeantech.com
220
In Partnership with
&
221.
09.2Tech’s Take on Policy
This perception may be impacted by the fact that the general level of
awareness of the key priorities of the European Commission in the tech
and digital sphere appears to be low.When asked to determine which of the
Commission’s priorities was most important, the most frequently cited answer
was ‘I don’t feel sufficiently informed to comment’. Interestingly, very few
respondents believe that delivering a connected, single digital market was the
key priority for the European Commission.
FOUNDERS, TECH EMPLOYEES,INVESTORS
What do you think have beenthe
key tech and digital economic
priorities for the European
Commission in the last 12
months?
Founder
Employee at a tech startup or scale-up
LEGEND
Venturecapitalist
I don't feel su ciently informedto
comment
Policing a handful of major platform
companies/Big Tech
LP investing in private equity & venture capital
Angelinvestor
Supporting the growth of the European
Tech ecosystem
Delivering a connected Digital Single
Market
Otherinvestor
Other
0
10
20
40
30
50
60
70
80
90
100
90
100
% of respondents
OTHEROCCUPATIONS
Academic/researcher
Consultant/M&Aadvisor/investment banker
Employee at a company that is not a tech startup or
scale-up
Employee in the public sector
Media/journalist
Other (pleasespecify)
Policymaker/regulator
Student
0
10
20
40
30
50
60
70
80
% of respondents
ALL RESPONDENTS
All respondents
0
10
20
30
40
50
60
70
80
90
% of respondents
NOTE:
Numbers may not add to 100 due to
rounding.
www.stateofeuropeantech.com
221
In Partnership with
&
100
222.
09.2Tech’s Take on Policy
It’s also telling that just one in five European founders believes that the concerns
and perspectives of the region’s startups and scale-ups are being heard by
European policymakers. We also see that half of all founders perceive that
European regulation makes it harder to start and scale technology businesses.
The European tech community also shared a strong call to benefit more from
‘preferential treatment’ for European tech companies
Do you agree or disagreewith
the followingstatements?
LEGEND
Agree
Disagree
Neither agree nor disagree
The concerns and perspectives of startups and
scaleups are being heard by European policymakers
European regulation makes it harder to start and scale
technology businesses
European startups should benefit from preferential
treatment from European policymakers
Regulation is an opportunity for countries to gain
competitive advantage in the race to attract tech
investmentand talent
Regulation is an opportunity for competitive advantage
formycompany
Deregulation would have a positive impact on the
prospects of my company
The direction of travel of European regulation around
technology is positive for the European Tech ecosystem
0
10
20
30
40
50
60
70
80
90
100
% of respondents
NOTE:
Founders only. Numbers may not add to 100
due to rounding.
Onthe final point of preferential treatment, it’s fascinating that there’s a high
level of agreement across the board from the European tech community,
including amongst European policymakers, that European startups should
benefit from preferential treatment from the region’s policymakers
To what extent do you agree or
disagree with the following
statement: European startups
should bene t from preferential
treatment from European
policymakers
LP investing in private equity & venture capital
Academic/researcher
Other investor
Consultant/M&A advisor/investment banker
LEGEND
Agree
Employee in the public sector
Disagree
Media/journalist
Neither agree nor disagree
Other (please specify)
Angel investor
Founder
Employee at a tech startup or scale-up
Policymaker/regulator
Employee at a company not a tech startup or scale-up
Student
Venture capitalist
0
10
20
30
40
50
60
70
80
90
% of respondents
NOTE:
Numbers may not add to 100 due to
rounding.
www.stateofeuropeantech.com
222
In Partnership with
&
100
223.
09.2Tech’s Take on Policy
One of the shared responsibilities of all government –local and national
- is to deliver key services in areas like health, mobility, housing and
environment. The demand and the opportunities are huge: we have only
just begun to see how public services can be improved when resources
like public data sets are opened up and re-used. But startups/scale-ups
and government services often have different priorities, sensitivities
and timescales. They also have different ways of working. Both sides
need to understand each other better. There are examples of this
here and there - but it’s far too underdeveloped. Wemust promote
cooperation and dialogue.
Linda Griffin
King
VP,Global Public
Policy
Disinformation is most frequently cited by respondents as the technology area that requires
urgent attention from regulators. This is followedby artificial intelligence, data privacy and
cybersecurity as other areas cited as requiring urgent attention. As interesting as what’s top
of the list, is what’s on the bottom. Drones, intermediary liability, autonomous vehicles and
blockchain were all far less likely to be cited as requiring urgent attention.
Inyour opinion, which areas in
tech require urgent attention
from regulators as they are likely
to be most impactful for society
(in a good or bad way) ? Selectup
to 3
Disinformation (e.g. deep fakes)
42%
39%
Artificial Intelligence
Data privacy & management
32%
Cybersecurity
30%
24%
Genetic editing
Tax (e.g. digital tax for big tech)
22%
Platform workers (e.g. gig economy)
20%
19%
Blockchain/cryptocurrency
Autonomous vehicles
18%
Intermediary liability (i.e. platforms responsible for
content uploaded by its users)
13%
Drones
12%
0
5
10
15
20
25
30
35
40
45
% ofrespondents
NOTE:
Numbers do not add to 100 as respondents
could select up to three responses.
It’s interesting to explore the impact of European policy on the European startup community.
Notably,almost half of founders of companies of 10employees or fewer stated that they have not
been negatively impacted by privacy regulation, though that still means that more than half of the
region’s smallest tech startups have been negatively impacted. The larger the company,the more
likely founders are to report having been negatively impacted by privacy regulation over the last 12
months. The most frequent change cited by founders of companies with 10+employees as having
negatively impacted their business is the appointment of Data Protection Officers, a role that
is both difficult and expensive to fill.
Which one of the following
changes to privacy regulation
have impacted your companythe
most over the last 12months?
LEGEND
None of these areas - not negatively impacted by privacy
regulation
Appointment of data protection officers
Right to access (i.e. providing copy of personal data free
of charge)
Right to be forgotten (i.e. ability to ask for their personal
data to be erased)
≤10employees
Privacy by design
11-100employees
>100employees
Data portability
Breach notifications (i.e. data breach notification to
customers and controllers within 72 hours)
0
10
20
30
40
50
% ofrespondents
NOTE:
Founders only. Numbers may not add to 100
due to rounding.
www.stateofeuropeantech.com
223
In Partnership with
&
224.
09.2Tech’s Take on Policy
The impact of data privacy regulation is the top-ranked area of regulation
perceived as most challenging by founders of companies of all sizes.
Thinking about any potential
negative impact on your
business from regulation, which
one area doyouviewas the most
challenging for yourcompany?
Data protection and privacy
Tax
Employment
Competition
Certification
LEGEND
≤10employees
Data localisation
None of these areas - not negatively impacted by
regulation
Copyright
11-100employees
Licensing
>100employees
Patents
0
5
10
15
20
25
30
3
%ofrespondents
NOTE:
Founders only. Numbers may not add to 100
due to rounding.
VCs, LPs, tech workers and founders are more likely to agree that European
founders can compete equally on the global tech stage, while policymakers
and media are more sceptical. Who’s right and who has the better vantage
point? And if policymakers are sceptical about the ability for European
founders to compete on the global stage, what can they do to better
support the founders in that objective?
To what extent do you agreeor
disagree with the following
statement: Europeanfounders
can compete equally on the
global technology stage
LEGEND
Venture capitalist
Other investor
Employee at a tech startup or scale-up
Employee in the public sector
Agree
Disagree
Academic/researcher
Neither agree nor disagree
Founder
Employee at a company not a tech startup or scale-up
Other
Student
Consultant/M&A advisor/investment banker
Policymaker/regulator
Angel investor
Media/journalist
0
10
20
30
40
50
60
70
80
90
% ofrespondents
NOTE:
Numbers may not add to 100 due to
rounding.
www.stateofeuropeantech.com
224
In Partnership with
&
100
225.
09.2Tech’s Take on Policy
It’s interesting that respondents from outside Europe show a
materially higher level of agreement with the view that European
founders can compete equally on the global stage.
To what extent do you agreeor
disagree with the following
statement: Europeanfounders
can compete equally on the
global technology stage
Outside Europe
LEGEND
Agree
Disagree
InsideEurope
Neither agree nor disagree
0
10
20
30
50
40
60
70
80
90
100
% ofrespondents
NOTE:
Numbers may not add to 100 due to
rounding.
Opinionis split on Europe’s likelihood to gain ground relative
to the US and China in the next decade.
Do you agree or disagreewith
the followingstatement?
European tech is likelyto gain
ground relative to the US and
China in the nextdecade
LP investing in private equity & venture capital
Venture capitalist
Employee at a tech startup or scale-up
LEGEND
Media/journalist
Agree
Disagree
Other
Neither agree nor disagree
Founder
Grand total
Academic/researcher
Student
Consultant/M&A advisor/investment banker
Employee at a company not a tech startup or scale-up
Other investor
Employee in the public sector
Policymaker/regulator
Angel investor
0
10
20
30
40
50
60
70
80
90
% of respondents
NOTE:
Numbers may not add to 100 due to
rounding.
www.stateofeuropeantech.com
225
In Partnership with
&
100
226.
09.2Tech’s Take on Policy
Europe’s tech ecosystem remains characterised by a strong level of optimism
about the future. 91%of respondents said they were more optimistic about the
future of European tech or the same as they were 12months ago.This is on par
with the levels seen in the past two years.
Are you more or less optimistic
about the future of European
technology today than youwere
12monthsago?
100
91%
90%
91%
2017
2018
2019
%of respondents
75
50
25
0
NOTE:
%of all respondents that answered either
'More' or 'About the same' .
Interestingly, however, there is a large divergence depending on the
occupation of respondents. Investors in European tech, including both VCs
and LPs, are amongst the most optimistic occupations, while founders
and tech employees also expressed strong sense of optimism about the future
of European tech. Policymakers, by contrast, were the least optimistic.
This divergence of opinion between the founders operators and investors
on the one hand, and policymakers on the other,speaks volumes.
Are you more or less optimistic
about the future of European
technology today than youwere
12monthsago?
LP investing in private equity & venture capital
Venture capitalist
Academic/researcher
LEGEND
About the same
Student
Less
More
Consultant/M&A advisor/investment banker
Employee at a tech startup or scale-up
Employee in the public sector
Founder
Other
Media/journalist
Angel investor
Other investor
Employee at a company not a tech startup or scale-up
Policymaker/regulator
0
10
20
30
40
50
60
70
80
90
% of respondents
NOTE:
Numbers may not add to 100 due to
rounding.
www.stateofeuropeantech.com
226
In Partnership with
&
100
227.
09.2Tech’s Take on Policy
There is still a wide gap between the world of policymaking and that of
tech entrepreneurs... Ithink that venture capitalists have a key role to play
in bridging that gap between the two worlds.
There is still a wide gap between the world of
policymaking and that of tech entrepreneurs.
Policymakers genuinely want to help, but they
don’t know a thing about tech startups, and
they usually don’t count tech entrepreneurs
as friends or acquaintances, which makes it
even more difficult for them to understand
what’s going on. On the other hand, tech
entrepreneurs have difficulties reaching
out to policymakers because they don’t
understand that world, where everything
seems so slow and so bureaucratic; they
rightfully prefer to focus on growing their
businesses.
This is the reason why, by the way, Ithink that
venture capitalists have a key role to play in
bridging that gap between the two worlds.
Unlike entrepreneurs, venture capitalists
don’t have to focus on one single problem
over the course of several years. They can
embrace a long-term view of the market,
identify the many regulatory obstacles that
still stand in the way, and help policymakers
understand technology and come up with
sound regulations designed to boost local
champions.
Nicolas Colin
The Family
Co-Founder&
Director
It’s both about providing entrepreneurs with
the resources and the security they need to
take more risks and about raising the bar for
European tech companies, forcing them to
get better on various fronts, and ultimately
consolidating their competitive advantage
at a global scale - an industrial policy for the
Entrepreneurial Age.
The OECD has given the UK its highest overall score for the quality of our
regulatory practices, but we're not resting on our laurels. Weare bringing
forward world-leading policies to boost innovation and build trust in
digital markets, to promote ethical and responsibletechnology and give
tech firms growing on our shores the competitive advantage they need.
Nicky Morgan
UK Secretary of
State for Digital,
Culture, Media &
Sport
Photoby:SamuliPentti
www.stateofeuropeantech.com
227
In Partnership with
&
228. 10 About
This report was produced in partnership with Slush and Orrick.Nearly 100 people and 20 organizations came together to provide
insights and data. This is who they are.
www.stateofeuropeantech.com
228
In Partnership with
&
229. 10.1 Our Contributors
10.1OurContributors
Thanks to all of the following people for their assistance and
insight in developing this year’s State of European Tech Report
Contributors
GiovanniAnelli
SophiaBendz
AliceBentinck
ElsaBernadotte
CERN
Atomico
EF
Karma
TomBlomfield
Kat Borlongan
LoubnaBouarfa
Christina Brinck
Monzo
La French Tech
OKRA Technologies
Sixth Swedish National Pension Fund
AnisahOsman Britton
OpheliaBrown
JessicaButcher
SurangaChandratillake
23 Code Street
Blossom Capital
Tick
Balderton Capital
StjinChristiaens
JamesClark
ThomasClozel
NicolasColin
Collibra
London Stock Exchange
Owkin
The Family
www.stateofeuropeantech.com
229
In Partnership with
&
230.
10.1Our Contributors
SimonCook
AndyDavis
SonalideRycker
PierreEntremont
Draper Esprit
Backstage Capital
Accel
FRST
MadeleineEvans
EkaterinaGianelli
LindaGriffin
IrinaHaivas
Levell
Inventure
King
Atomico
ThomasHellmann
KateHilyard
TaavetHinrikus
SophiaHmich
University of Oxford
Healx
TransferWise
Future Positive Capital
Christine Hockley
AntoineHubert
MikiKuusi
DanielKeiper-Knorr
British Patient Capital
Ynsect
Wolt
Speedinvest
JacopoLosso
YuryMelnichek
OsnatMichaeli
MartinMignot
EBAN
Bulba Ventures
Infarm
Index
www.stateofeuropeantech.com
230
In Partnership with
&
231.
10.1Our Contributors
ValentinaMilanova
NickyMorgan
AkshayNaheta
SteveO’Hear
Daye
UK Secretary of State for Digital,
Culture, Media & Sport.
SoftBank Vision Fund
TechCrunch
DeborahOkenla
PatrickPichette
OscarPierre
MariaRaga
YSYS
Inovia Capital
Glovo
Depop
AndreasSaari
AbbyScarborough
NarenShaam
PerryTeicher
Slush
Yena
Omio
Orrick
AlexTerrien
NigelToon
RoxanneVarza
CheckWarner
Future Positive Capital
Graphcore
Station F
Diversity VC
DavidYork
LeilaRastegar Zegna
NiklasZennström
TopTier Capital Partners
Kindred Capital
Atomico
www.stateofeuropeantech.com
231
In Partnership with
&
232. 10.2 Acknowledgements
We wouldn’t have been able to put together the State of European Techwithout a lot of help - thanks to all of the following in particular:
Acknowledgements
MikeAllanson
KaloyanAndonov
GiovanniAnelli
KarlBjelland
Studio Lovelock
Global University Venturing
EuropeanOrganization for Nuclear
Research (CERN)
Politico
JonBrewer
YuliyaChernova
JamesClark
GeorgeClayton
Orrick
Craft
London Stock Exchange
Studio Lovelock
MattCollins
KatelynDennis
IvanDraganov
AnastasiyaDudareva
Studio Lovelock
Shareworks
Dealroom
Craft
www.stateofeuropeantech.com
232
In Partnership with
&
233.
10.1Our Contributors
MarkDunbavan
OscarFarres
RugiyyaGahramanli
SofianGiuroiu
Studio Lovelock
EIF
London Stock Exchange
PEREP Analytics/EDC
SarahGuemouri
ThierryHeles
BenJakob
AntJumratsilpa
Atomico
Global University Venturing
Studio Lovelock
Studio Lovelock
BryceKeane
JulieKim
ThomasKösters
JulienKrantz
Atomico
Quid
EuropeanStartup Initiative
InvestEurope
IlyaLevtov
JoeLovelock
ElissaMaercklein
GligorMicajkov
Craft
Studio Lovelock
Craft
Dealroom
www.stateofeuropeantech.com
233
In Partnership with
&
234.
10.1Our Contributors
ElmoPakkanen
AngelinaPanagiotopoulou
JulienPuls
AnaisRassat
Slush
Studio Lovelock
Dealroom
EuropeanOrganization for Nuclear
Research (CERN)
JuliaSilge
MaxineSmith
KarthikSuresh
EleanorWarnock
Stack Overflow
Atomico
Craft
Atomico
TomWehmeier
YoramWijngaarde
Thepurpose-driven porpoise
Atomico
Dealroom
Self-employed
www.stateofeuropeantech.com
234
In Partnership with
&
235. 10.3 About Atomico
10.3AboutAtomico
We’re Atomico. You probably knew thatalready.
But who are we really?
We’re not a traditional venture capital firm.
We are built by founders for founders. Every single aspect of Atomico, every part
of our culture, and every decision we take, is designed with the sole ambition
of helping our partners succeed.
We exist for more than returns. We believe entrepreneurs are the ultimate agents
of positive, transformational change across every aspect of our society and economy.
Our mission is to spur this progress forward.
It’s why we partner with the world’s most ambitious founders. The rule-breakers who
want to build the next leader in their category. The world-shapers creating companies
that fundamentally shift the way we live today. The gamechangers using technology
to rewire the world in favour of something better, for as many people as possible.
When we find these people, we invest much more than money. We work hand-in-glove
with them, drawing on hard-won experience scaling some of the most successful
technology companies in the world.
10.4
AboutOrrick
But who isOrrick?
Creators. Visionaries. Underdogs. The Daring.
Orrick counsels more than 2,700 tech companies, as well as the most active
funds, corporate venture investors and public tech companies worldwide.
We help you disrupt. We help you build. We protect you. We help you win.
We are the No. 1most active law firm in European venture capital, No. 3
globally (PitchBook), top 15 for global M&A (Bloomberg) and advisors to seven of the
top 15global private equity funds. We offer destination practices in other areas that are
important to tech companies’ success: privacy and cybersecurity, intellectual property,
payments, andbeyond.
And we innovate not only in our legal advice but also in the way we deliver our services.
That’s why Financial Times has named us the most innovative law firm in North America
for the last three years in a row.
www.stateofeuropeantech.com
235
In Partnership with
&
236. 10.4 About Slush
10.4AboutSlush
Onceagainwe’vepartneredwithSlush
toproducetheStateofEuropeanTechreport
But why are so many people flocking
to Helsinki in November?
Slush is a student-driven, not-for-profit movement with the mission
to create and help the next generation of groundbreaking entrepreneurs.
The Slush year culminates in Helsinki in November, when 25,000 founders,
investors, media and executives from 130+countries gather in Helsinki.
Held during the darkest time of the year, Slush has always been characterized
by a unique energy and enthusiasm.
Slush is run by a community of students who want to radically change how
entrepreneurship is perceived in Northern Europe and beyond. Several successful
entrepreneurs, from the founders of Supercell and Spotify among others, have already
become a part of the not-for-profit initiative that has already become a movement
ofglobal magnitude.
10.5
About StudioLovelock
Brandingtoengageandinspire
Studio Lovelock partners with ambitious scale-ups
ready to embrace the power of brand to drive growth
Studio Lovelock is a branding and communications design agency based in London.
We are a collection of open-minded, smart and creatively restless folk, driven to help
the businesses we believe in achieve great things. We are founded on the belief that
creativity and clear design thinking are critical components in the long term success of
any business. We pride ourselves on our willingness to push beyond our comfort zone
and the quality of the relationships we’ve built with our clients.
Being friendly, helpful and reliable doesn’t hurt either.
View more of our work at studiolovelock.com
www.stateofeuropeantech.com
236
In Partnership with
&
237. 11 Appendix
Last but not leastwww.stateofeuropeantech.com
237
In Partnership with
&
238. 11.1 Survey Respondents
11.1SurveyRespondents
Occupation ofsurvey
respondents
Founder
27%
Employee at a tech startup or scale-up
19%
Employee at a company that is not a tech startup or
scale-up
16%
Venturecapitalist
10%
Consultant/M&A advisor/investmentbanker
7%
Student
5%
Other
4%
Employee in the public sector
3%
Academic/researcher
2%
Angelinvestor
2%
Otherinvestor
2%
LP investing in private equity & venture capital
1%
Media/journalist
NOTE:
1%
Policymaker/regulator
Numbers may not add to 100 due to
rounding.
1%
0
5
10
15
20
25
30
% of respondents
Company size ofsurvey
respondents
≤10employees
35%
11-100employees
29%
100+employees
30%
NOTE:
Numbers may not add to 100 due to
rounding.
Not applicable
6%
0
5
10
15
20
25
30
35
40
% of respondents
www.stateofeuropeantech.com
238
In Partnership with
&
239.
11.1Survey Respondents
Experience level offounder
respondents
First-time founder
51%
Repeat founderwith limited experience
NOTE:
31%
Repeat founder with significant experience
18%
Founders only. Numbers may not add to 100
due to rounding.
0
5
10
15
20
25
30
35
40
45
50
55
% of respondents
Gender of surveyrespondents
Male
67%
Female
31%
Prefer not to say
2%
Non-binary 0%
NOTE:
Numbers may not add to 100 due to
rounding.
Other 0%
0
10
20
30
40
50
60
70
% ofrespondents
Ethnicity of surveyrespondents
Caucasian/White
81%
Asian
6%
Prefer not to say
4%
3%
Mixed
Hispanic/Latinx
2%
Middle Eastern/NorthAfrican
2%
Other (please specify)
NOTE:
Numbers may not add to 100 due to
rounding.
1%
Black/African/Caribbean
1%
0
10
20
30
40
50
60
70
80
90
% of respondents
Geographic origin ofsurvey
respondents
Nordics
39%
UK & Ireland
16%
DACH
13%
CEE
9%
France & Benelux
8%
Southern Europe
8%
Rest of world
NOTE:
Numbers may not add to 100 due to
rounding.
4%
Rest of Europe
2%
UnitedStates
2%
0
5
10
15
20
25
30
35
40
%of respondents
www.stateofeuropeantech.com
239
In Partnership with
&
240. 11.2 More About Our Data Partners
11.2More About Our DataPartners
Aon
Radford is the technology and life sciences unit of Aon’s Rewards Solutions practice.
ABOUT REWARDSSOLUTIONS
The Rewards Solutions practice at Aon empowers business leaders to reimagine their approach to
rewards in the digital age through a powerful mix of data, analytics and advisory capabilities. Our
colleagues support clients across a full spectrum of needs, including compensation benchmarking,
pay and workforce modeling, and expert insights on rewards strategy and plan design. To learn
more, visit:rewards.aon.com.
ABOUTAON
Aon plc (NYSE:AON) is a leading global professional services firm providing a broad range of risk,
retirement and health solutions. Our 50,000 colleagues in 120 countries empower results for
clients by using proprietary data and analytics to deliver insights that reduce volatility and improve
performance. For further information, please visit aon.com.
Dealroom.co
Dealroom is a global company information database & research firm. Its software, database and
bespoke research enable its clients to stay at the forefront of innovation, discover promising
companies and identify strategic opportunities. Among its clients are world-leading strategy
consulting firms, investment banks, multinationals, technology firms, venture capital & buyout
firms and governments. For more information, please visit: dealroom.co
CBRE
CBRE Group, Inc. (NYSE:CBRE), a Fortune 500 and S&P 500 company headquartered in Los
Angeles, is the world’s largest commercial real estate services and investment firm (based on 2018
revenue). The company has more than 90,000 employees (excluding affiliates) and serves real
estate investors and occupiers through more than 480 offices (excluding affiliates) worldwide.
CBRE offers a broad range of integrated services, including facilities, transaction and project
management; property management; investment management; appraisal and valuation; property
leasing; strategic consulting; property sales; mortgage services and development services. Please
visit our website at www.cbre.com.
www.stateofeuropeantech.com
240
In Partnership with
&
241.
11.2More About Our Data Partners
The European Organization
forNuclearResearch(CERN)
The European Organization for Nuclear Research (CERN) - is a world-renowned centre for scientific
research, celebrated for its recent discovery of the Higgs boson. CERN’s technology provides
concrete business solutions in many fields: from medtech to aerospace, and industry 4.0, and are
already present in start-ups hosted in CERN’s network of Business Incubation Centres. CERN is also
part of the ATTRACT initiative, a European call for breakthrough ideas that will fund 170innovative
projects from 2019.
Craft
Craft is building the ‘Source of Truth’ on companies, mapping the global economy, and delivering
unique intelligence on companies to corporate decision-makers globally. Craft collects, aggregates
and curates financial, operating and human capital data to provide the deepest picture of private
and public companies to assist decision-makers to manage their supply chain, maximize their
investments, mitigate risks, grow their sales, leverage their talent and enhance their competitive
position.
TheEuropeanBusinessAngelsNetwork(EBAN)
EBAN, The European Business Angels Network, is the pan-European representative for early stage
investors gathering over 150member organizations in more than 50 countries. Established in 1999
by a group of pioneer angel networks in Europe with the collaboration of the European Commission
and EURADA, EBAN represents a sector estimated to invest over 7 billion Euros a year and playing
a vital role in Europe’s future, notably in the funding of Start-Ups SMEs. EBAN has been conducting
research on the business angel market since 2001 and is the leading source of knowledge in Europe
for thisindustry.
TheEuropeanInvestmentFund(EIF)
The European Investment Fund (EIF) is part of the European Investment Bank group. Its central
mission is to support Europe’s micro, small and medium-sized businesses (SMEs) by helping them to
access finance. EIF designs and develops venture and growth capital, guarantees and microfinance
instruments, which specifically target this market segment. In this role, EIF fosters EU objectives in
support of innovation, research and development, entrepreneurship, growth, and employment.
Flourish
Flourish makes it easy to produce beautiful and engaging data visualizations and interactive
presentations. Used by companies from Google and EY to Sky News and the BBC, it converts
complex datasets into animated, mobile-friendly, on-brand data stories in minutes. No coding
required. Get started for free at flourish.studio.
www.stateofeuropeantech.com
241
In Partnership with
&
242.
11.2More About Our Data Partners
Global UniversityVenturing
Global University Venturing is both a quarterly magazine and website written for and about
universities taking stakes in spinouts. We help universities to share best practice and to connect
with each other, with investors and with other useful parties in the innovation ecosystem. Our aim
is to help improve the processes of bringing innovations from academia to the market and facilitate
their integration into the business ecosystem.
Graphext
Graphext provides a data science software for business decision makers. Combining the latest
machine learning techniques and a user friendly interface, Graphext automates and simplifies data
driven decision making for all aspects of your business.
Indeed
More people find jobs on Indeed than anywhere else. Indeed is the #1job site in the world and allows
jobseekers to search millions of jobs on the web or mobile in over 60 countries and 28 languages.
More than 250 million people each month search for jobs, post resumes, and research companies on
Indeed. For more information, visit indeed.com.
InvestEurope
Invest Europe is the association representing Europe’s private equity, venture capital and
infrastructure sectors, as well as their investors.
Our members take a long-term approach to investing in privately held companies, from start-ups
to established firms. They inject not only capital but dynamism, innovation and expertise. This
commitment helps deliver strong and sustainable growth, resulting in healthy returns for Europe’s
leading pension funds and insurers, to the benefit of the millions of European citizens who depend
on them.
Invest Europe aims to make a constructive contribution to policy affecting private capital
investment in Europe. We provide information to the public on our members’ role in the economy.
Our research provides the most authoritative source of data on trends and developments in our
industry.
Invest Europe is the guardian of the industry’s professional standards, demanding accountability,
good governance and transparency from our members.
Invest Europe is a non-profit organisation with 25 employees in Brussels, Belgium.
For more information visit www.investeurope.eu
www.stateofeuropeantech.com
242
In Partnership with
&
243.
11.2More About Our Data Partners
London StockExchange
London Stock Exchange Group (LSE.L) is a diversified international exchange Group that sits
at the heart of the world’s financial community. The Group can trace its history back to 1801.
The Group operates a broad range of international equity, bond and derivatives markets, including
London Stock Exchange; Borsa Italiana; MTS, Europe’s leading fixed income market; and the
pan-European equities platform, Turquoise. Through its markets, the Group offers international
business, and investors, unrivalled access to Europe’s capital markets.
Post trade and risk management services are a significant and growing part of the Group’s business
operations. LSEG operates CC&G, the Rome headquartered CCP and Monte Titoli, the significant
European settlement business, selected as a first wave T2S participant. The Group is also a
majority owner of leading multi-asset global CCP, LCH.
The Group offers its customers an extensive range of real-time and reference data products,
including Sedol, UnaVista and RNS. FTSE calculates thousands of unique indices that measure
and benchmark markets and asset classes in more than 80 countries around the world.
London Stock Exchange Group is also a leading developer of high performance trading platforms
and capital markets software. In addition to the Group’s own markets, over 40 other organisations
and exchanges around the world use the Group’s MillenniumIT trading, surveillance
and post trade technology.
Headquartered in London, United Kingdom with significant operations in Italy, France, North
America and Sri Lanka, the Group employs approximately 4,700 people.
Meetup
Meetup is a global community platform that connects people in real life. It was founded with one
simple idea: use technology to get people off technology. Our vision is to harness technology to
remove the barriers to human connection and deliver real life community.
Meetup supports over 40 million members+, 320,000+Meetup groups and 12,000 Meetups per day
around the world. Meetup was acquired by WeWork in 2017.The two companies share a vision of
the power of bringing people together, and together using technology to create new and innovative
ways of building community. Follow us @Meetup on Twitter, @Meetup on Instagram and Facebook,
or visit meetup.com to learn more.
POLITICO
POLITICO,a global nonpartisan politics and policy news organization, launched in Europe in April 2015.
POLITICOEurope is a joint-venture between POLITICOLLC, based in the USA and Axel Springer, the
leading publisher in Europe.
Withoperations based in Brussels and additional offices in London, Berlin, Paris, Rome,and Warsaw,
POLITICOconnects the dots between global power centers. InJune 2018,an annualComRes/BursonMarsteller survey ranked POLITICOas the #1most influentialpublication on European affairs, for the
secondyear running.
POLITICO’spremium politics and policy news service, POLITICOPro, empowers thousands of policy
experts and decision-makers from over 900 organizations on key industries. Launched in 2015, Pro
nowcovers 7policy areas: Agricultureand Food, Energy and Climate, Financial Services, Healthcare,
Technology, Trade, and Mobility.POLITICOPro has 5 cross-industry products: Brexit Pro, Sustainability
Pro, Cybersecurity and Data ProtectionPro, EU Budget Pro and CompetitionPro. Subscribers includeEU
and national government,corporations, trade associations, consultancies, lawfirms, and NGOs.
POLITICO Pro’s newest offering, Pro Intelligence, is an innovative platform which fuses the power of
technology with the power of journalism, providing professionals with an overview of bills, legislation,
voting behavior and attendance, tweets, activities, press releases, transcripts and more, at the touch of a
button. Users can track information on the EU Institutions and national legislatures in the UK, France and
Germany. Pro Intelligence was used by Atomico to research data on EU Tech legislation for this report.
www.stateofeuropeantech.com
243
In Partnership with
&
244.
11.2More About Our Data Partners
Quid
Quid is a big data research platform that inspires full picture thinking by drawing connections
across massive amounts of unstructured data. The software applies advanced natural language
processing technology, semantic analysis, and artificial intelligence algorithms to reveal patterns in
large, unstructured datasets, and generate visualizations to allow users to gain actionable insights,
enabling our Fortune 1000 clients to quickly complete analyses like tech scouting, competitive
tracking, market landscapes, and brand narrative maps.
Shareworks
Option Impact by Shareworks is the leading provider of pre-IPO compensation data. We partner
with over 180 top-tier investors and over 3600 private companies to produce the world’s largest
corporate-sourced compensation database specific to private, venture-backed companies. Option
Impact is a rolling cash and equity survey providing relevant market data across all levels and job
families for $0 in exchange for maintaining current information in the system. To learn more, please
email us at compensation@shareworks.com.
Sifted
Sifted is the new Financial Times backed media platform for European entrepreneurs, innovators
and investors. It is an essential, trusted and independent resource for the startup and tech world: a
source of news, information and analysis and also a channel for discovery.
StackOverflow
Founded in 2008, Stack Overflow is the largest, most trusted online community for anyone that
codes to learn, share their knowledge, and build their careers. More than 50 million unique visitors
come to Stack Overflow each month to help solve coding problems, develop new skills, and find job
opportunities. Stack Overflow partners with businesses to help them understand, hire, engage, and
enable the world’s developers. Stack Overflow’s products and services are focused on developer
marketing, advertising, technical recruiting, and enterprise knowledge sharing.
Startup HeatmapEurope
The Startup Heatmap Europe is a data & knowledge platform enabling tech communities in Europe
to grow. Find more information on the data and courses for ecosystem builders on
www.startupheatmap.com
The Startup Heatmap Europe is an annual survey among founders and the greater tech community
on mobility and the attractiveness of startup hubs. The 2019 survey was collected between May
and August 2019 and had 1,200 participants. After cleaning and sampling the data 806 complete
datasets remained that were weighted to adjust for regional representativeness on country level.
Founders were 53%of respondents. For long-term trends in founder mobility, we used a combined
dataset of 4 years with >6,000founder opinions. Analysis of key topics and trends was based on
social media data and a dataset of >20,000 startup meetup.
www.stateofeuropeantech.com
244
In Partnership with
&