


 economics
Similar presentations:


International economic analysis
1.
Week 2:The Basic Theory Using Demand
and Supply (Ch. 2)
McGraw-Hill/Irwin
Copyright © 2012 by The McGraw-Hill Companies, Inc. All rights reserved.
2.
Key points1. Consumer surplus and producer surplus
2. National welfare with no trade
3. Welfare effects of free trade
2-2
3.
1. Demand & Consumer SurplusA Demand curve shows how much of a good
consumers are willing to buy at each possible
price, holding other influences on demand
constant.
The law of demand states that, other things being
equal, the lower the price of a good, the higher is
the quantity demanded
Other things include tastes, prices of related goods, income,
expected future prices etc.
2-3
4.
1. Demand & Consumer SurplusChanges in these other things lead to shift of the
demand curve (rather than a movement along
the demand curve
(tastes, prices of related goods, income, expected
future prices)
2-4
5.
1. Demand & Consumer surplusConsumer surplus
The demand curve shows the maximum price the
consumer is willing to pay for each unit
As the demand curve is negatively sloped, the
consumer is willing to pay less and less for the
successive units
Yet, in a competitive market, consumers only pay the
market price for these units
Hence, there is a consumer surplus.
2-5
6.
1. Demand & Consumer surplusConsumer surplus is a measure of the difference
between the maximum price the consumer is willing to
pay for a unit (measured on the demand curve) and
the price she actually pays for it (the market price).
2-6
7.
2. Supply & Producer SurplusA supply curve shows the quantity of a good that
producers are willing to supply at each possible
price, holding constant all the other influences on
supply
The law of supply states that the higher the price
of the good, the higher is the quantity supplied,
holding other things constant.
Other things include: prices of factors of production, technology,
expected future prices, the number of suppliers etc.
2-7
8.
2. Supply & Producer SurplusChanges in these other things lead to shift of the
supply curve (rather than a movement along the
supply curve
2-8
9.
2. Supply & Producer SurplusProducer Surplus
The supply curve shows the lowest possible price at
which a producer would be willing to supply each unit
As the supply curve is positively sloped, the producer
requires higher prices to produce additional units
But, producers actually receive the going market price
for these units
2-9
10.
2. Supply & Producer SurplusHence there is a producer surplus.
Producer surplus is the difference between the price
for which a good sells (the market price) and the
minimum amount necessary for the producer to be
willing to produce the good (measured on the supply
curve)
2-10
11.
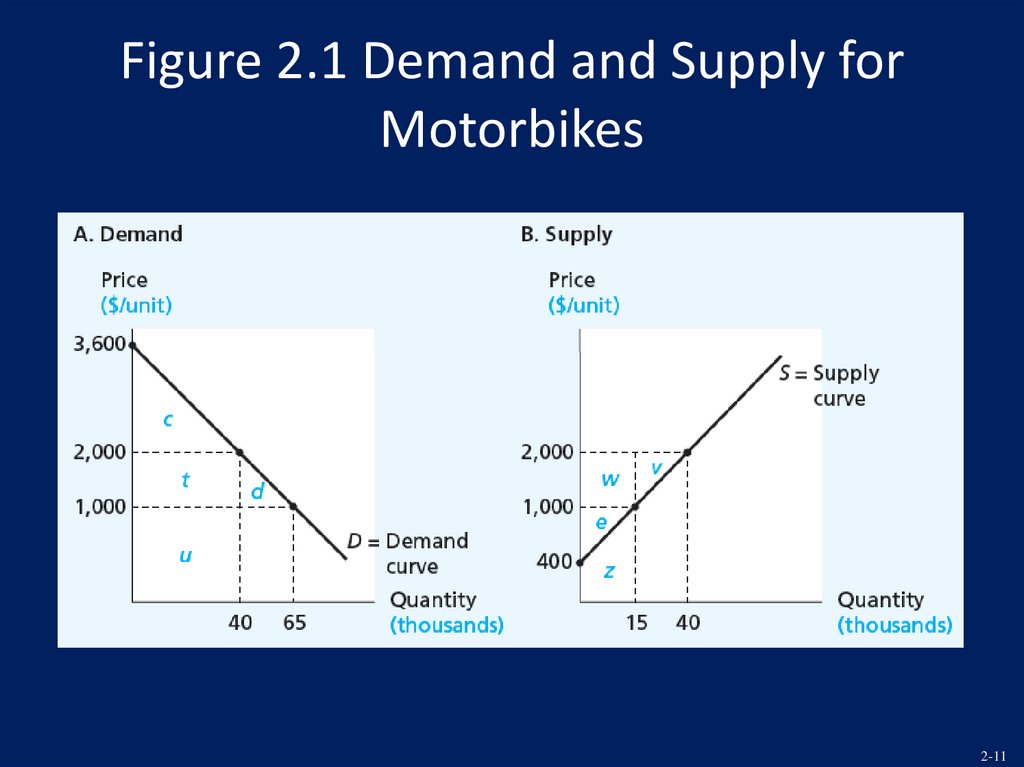
Figure 2.1 Demand and Supply forMotorbikes
2-11
12.
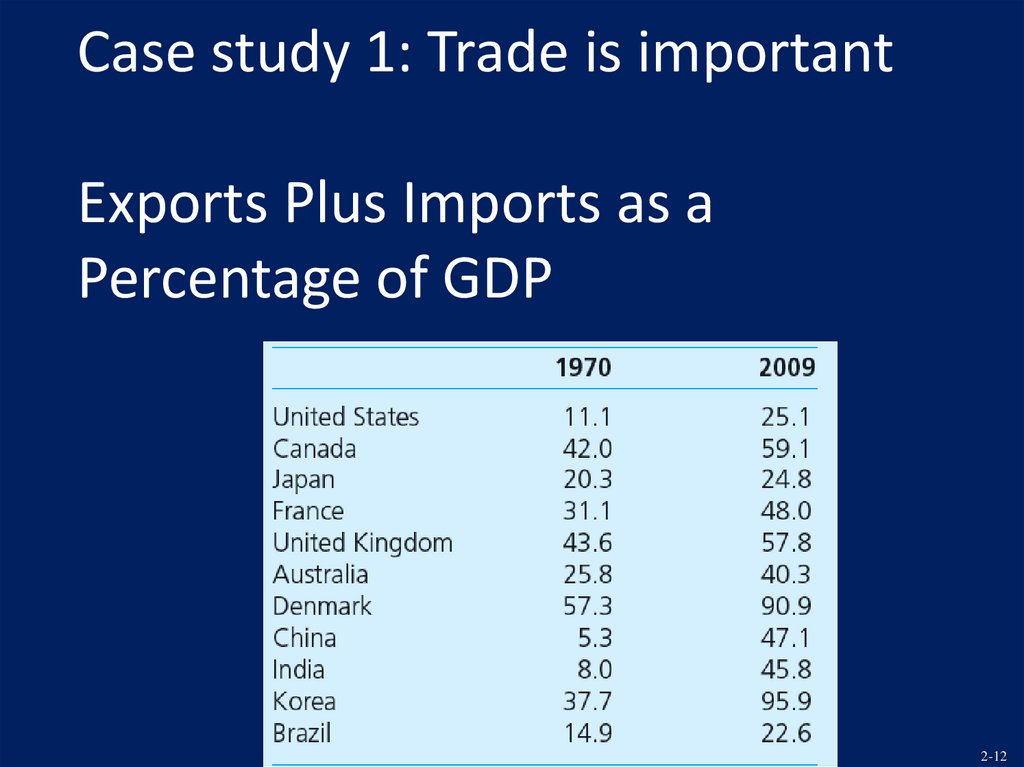
Case study 1: Trade is importantExports Plus Imports as a
Percentage of GDP
2-12
13.
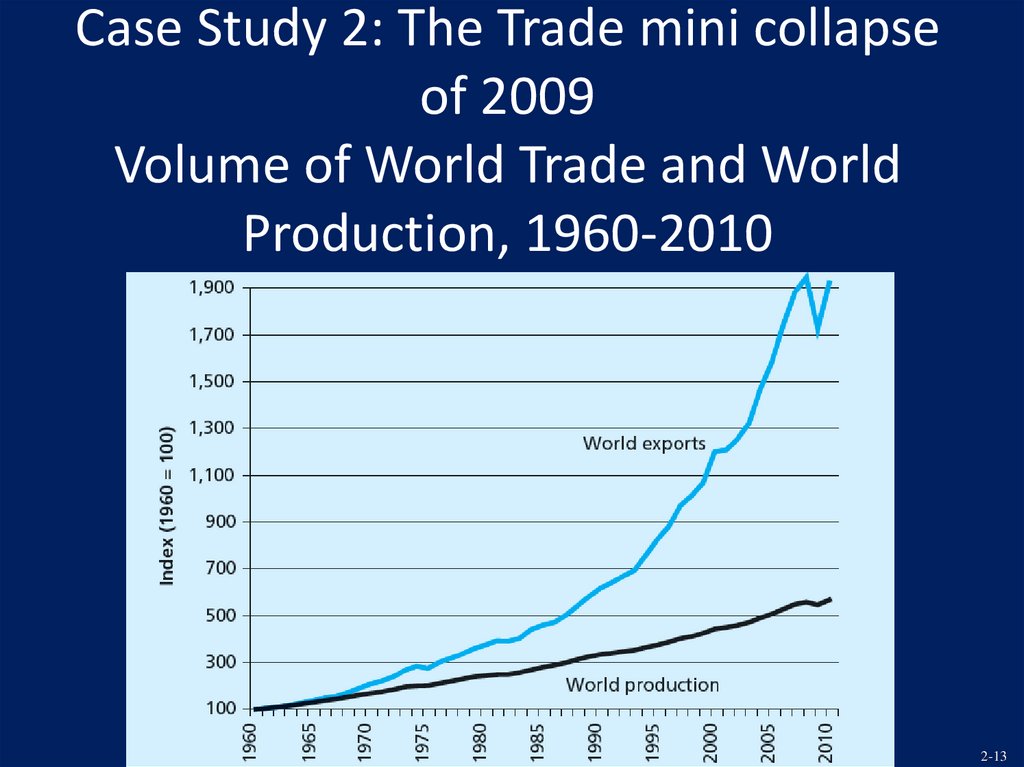
Case Study 2: The Trade mini collapseof 2009
Volume of World Trade and World
Production, 1960-2010
2-13
14.
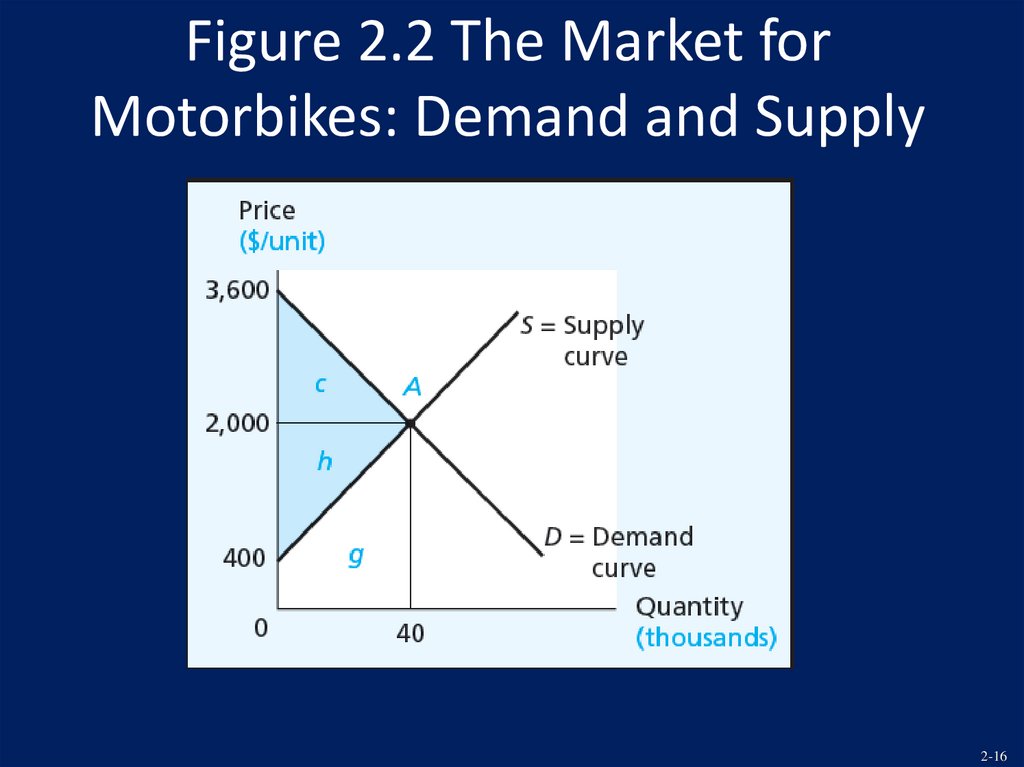
3. National market with no tradeIn the following figure, D represents national
demand for the product and S represents
national supply
No trade equilibrium occurs at A (where D=S),
with a price of $2000 per motorbike and 40 000
motorbikes demanded and supplied.
2-14
15.
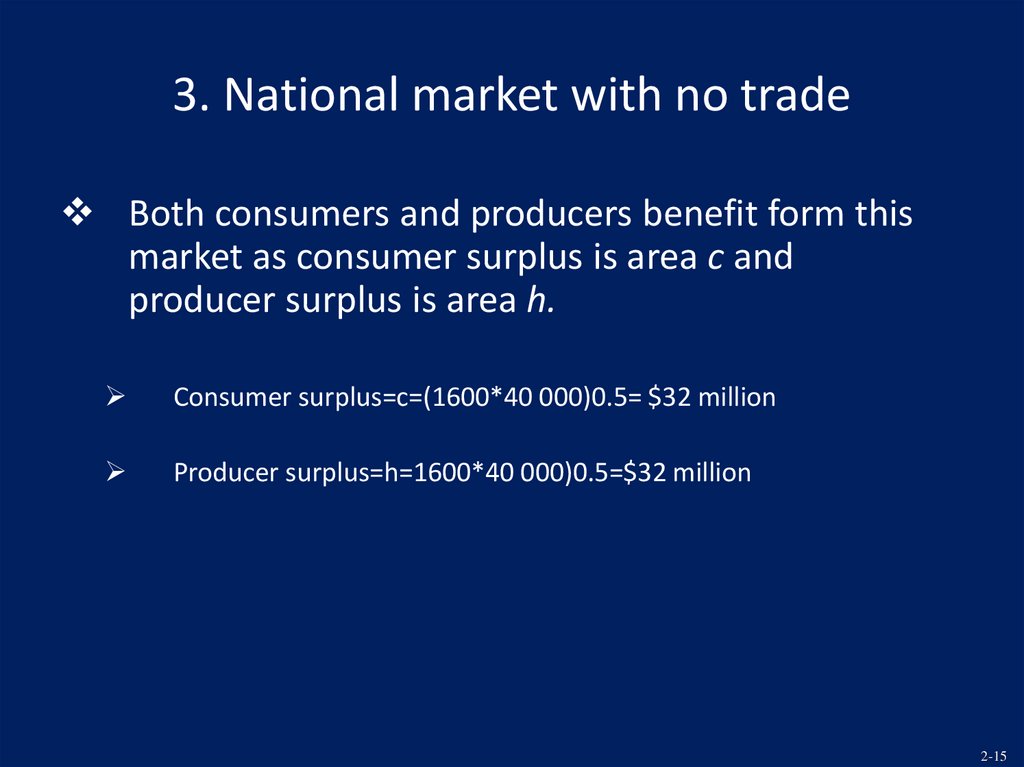
3. National market with no tradeBoth consumers and producers benefit form this
market as consumer surplus is area c and
producer surplus is area h.
Consumer surplus=c=(1600*40 000)0.5= $32 million
Producer surplus=h=1600*40 000)0.5=$32 million
2-15
16.
Figure 2.2 The Market forMotorbikes: Demand and Supply
2-16
17.
4. National markets & opening of tradeSuppose that there are two countries: the US and
The Rest of the World (ROW)
With no trade, the market equilibrium in the US
occurs at A
P=$2000 and Q=40 000.
2-17
18.
4. National markets & opening of tradeWith no trade, the market equilibrium in The Rest
of the World occurs at H
P=$700 and Q=50 000
One can see profit opportunities at these prices
That is, there will be arbitrage: “buy low” in the
Rest of the World and “sell high” in the US
2-18
19.
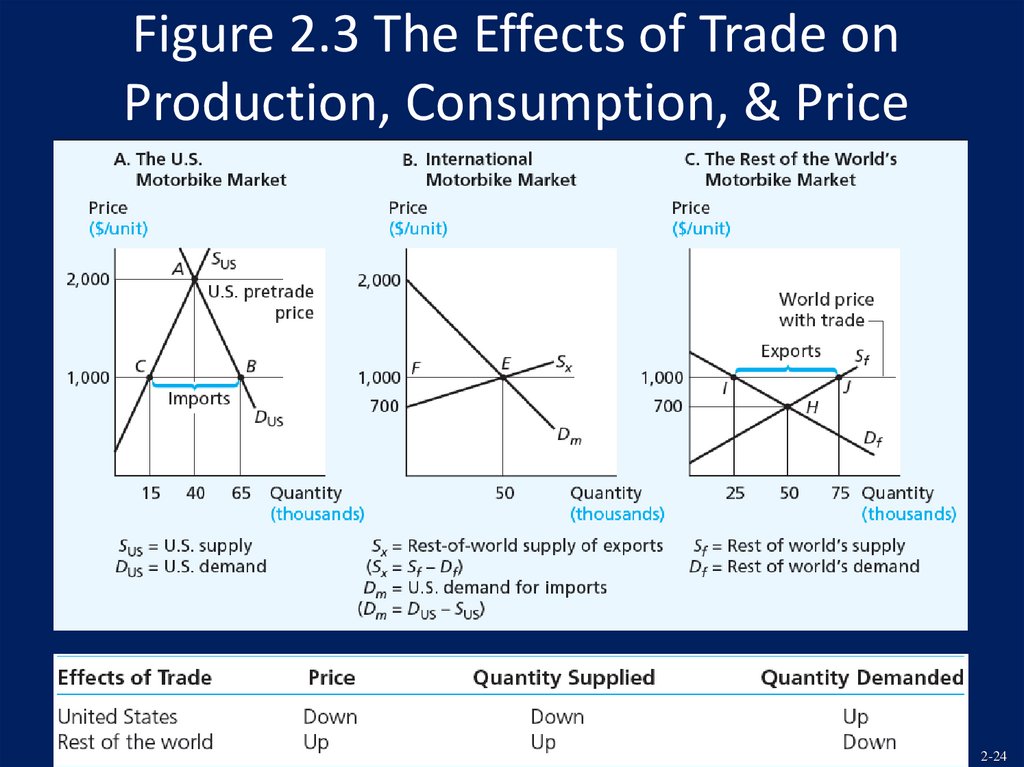
4. National markets & opening of tradeAs international market develops between the
two countries, it affects the market prices in the
two countries
Imports to US increase supply and reduce P in the US
The additional demand in the ROW (met by exports)
increases price in the ROW.
2-19
20.
4. National markets & opening of tradeIf there are no transportation costs or other
frictions, free trade results in the two countries
having the same price for motorbikes, the
international price or the world price.
2-20
21.
4. National markets & opening of tradeFree-trade equilibrium occurs at the price that
clears the international market, where quantity
demanded of imports equals quantity supplied
of exports
The demand for imports can be determined for
each possible price
i.e. at P=$2000, there is no excess demand for imports.
At P=$1000, there is excess demand of equal to 50 000
units in the US.
2-21
22.
4. National markets & opening of tradeThe supply of exports can be determined in a
similar way
i.e. at p=$700, there is no excess supply (no export
supply). At P=$1000, then excess supply (exports) of
50 000 motorbikes
2-22
23.
4. National markets & opening of tradeAt the world price of $1000, the total world
quantity demanded is 90 000 motorbikes (65 000
in the US and 25 000 in the ROW)
The excess demand for motorbikes within the US
market is met by the excess supply from the
ROW.
2-23
24.
Figure 2.3 The Effects of Trade onProduction, Consumption, & Price
2-24
25.
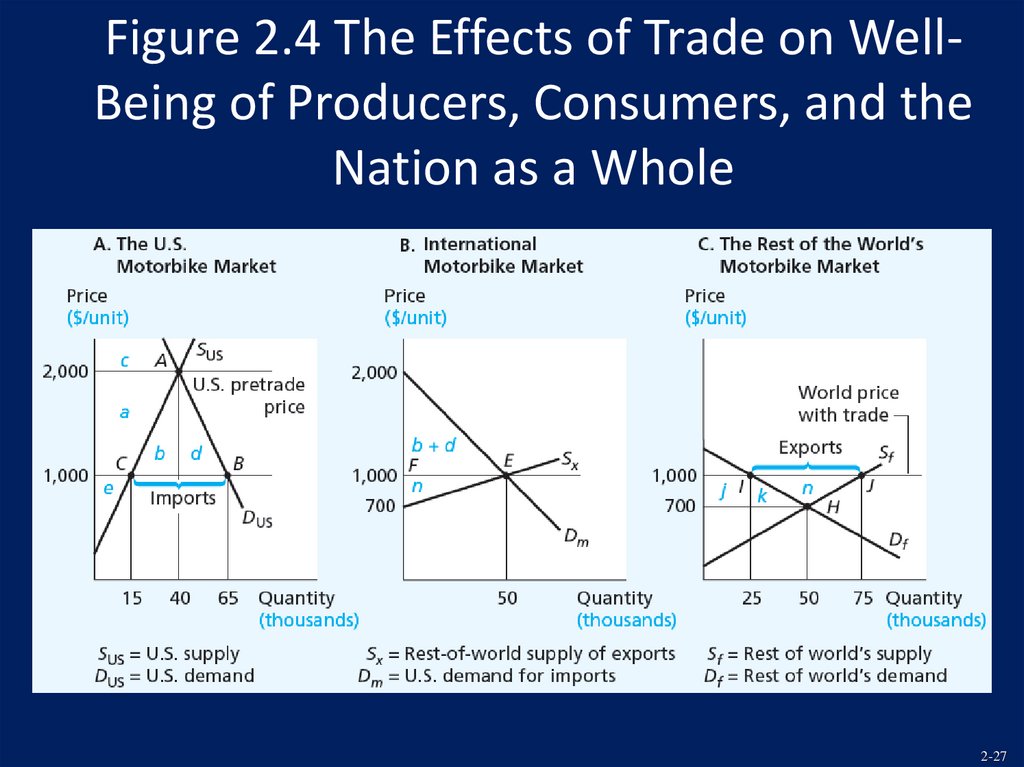
5. The welfare effects of free tradeThe US
Consumers benefit from lower prices and higher
quantities consumed.
Producers are hurt by lower prices and fewer units
sold
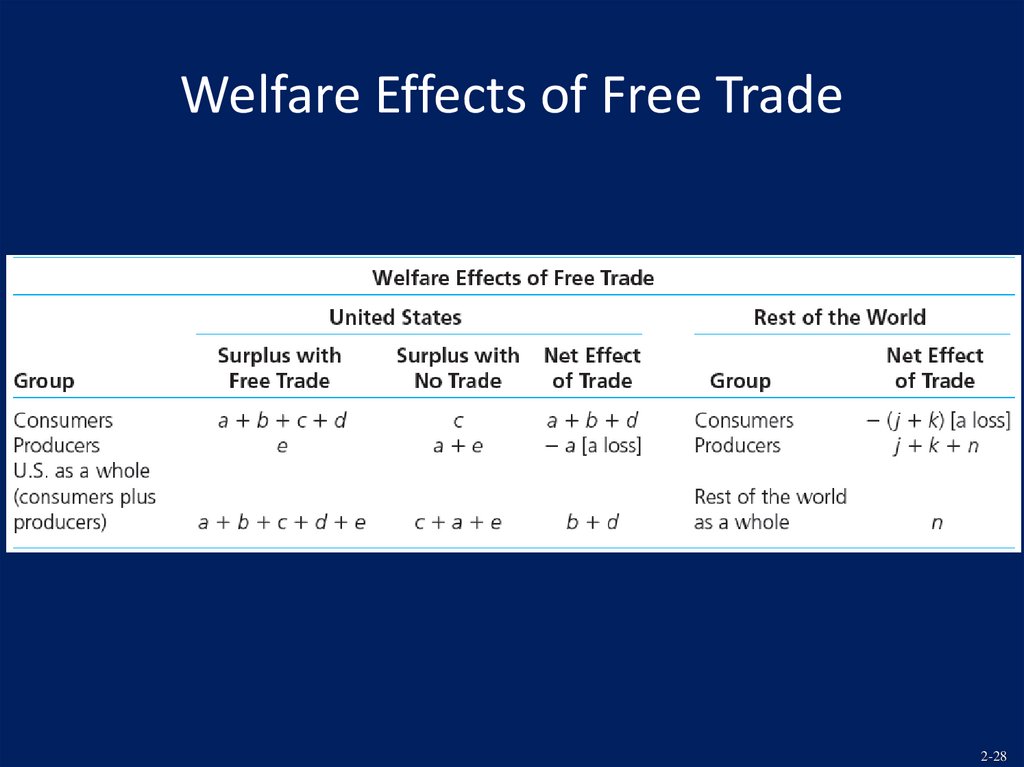
Consumers’ net gain=a+b+d
Producers’ net loss=a
Net national gain=b+d
2-25
26.
5. The welfare effects of free tradeThe ROW
Consumers are hurt by higher prices and lower
consumption
Producers gain from higher prices and higher
production
Consumers’ net loss= j+k
Producer’s net gain=j+k+n
Net national gain=n
The world as a whole
Net world gain=b+d+n
2-26
27.
Figure 2.4 The Effects of Trade on WellBeing of Producers, Consumers, and theNation as a Whole
2-27
28.
Welfare Effects of Free Trade2-28