


 mechanics
 electronics
Similar presentations:


Training Material 4
1.
VHMS CONTROLLERSystem Configuration ( Example : Engine for HD465/605-5, HD785/985-5)
Additional sensors
Engine oil Temp. Sensor
Engine Speed Sensor
Exhaust Gas Temp. Sensor
Engine Oil Pressure Sensor
Engine Blow-by Sensor
Rack Position Sensor
Sensors
Basically, Use the electrical data on machine’s operation.
Controllers
Pay Load
Engine
Transmission
Monitor
Meter (Option)
Controller
Controller
Panel
Rack
Position
Payload meter
data
Data
VHMS CONTROLLER
Orbcomm
Controller
Snapshot
Switch
Download PC
Antenna
Error Code
SMR
2.
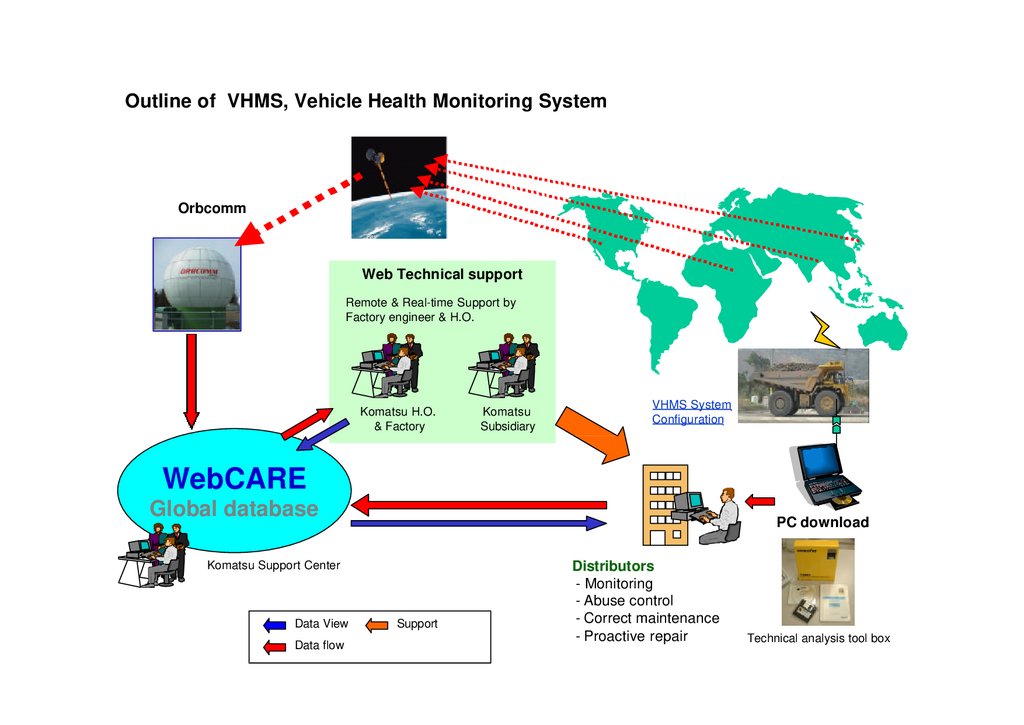
Outline of VHMS, Vehicle Health Monitoring SystemOrbcomm
Web Technical support
Remote & Real-time Support by
Factory engineer & H.O.
Komatsu H.O.
& Factory
Komatsu
Subsidiary
VHMS System
Configuration
WebCARE
Global database
PC download
Komatsu Support Center
Data View
Data flow
Support
Distributors
- Monitoring
- Abuse control
- Correct maintenance
- Proactive repair
Technical analysis tool box
3.
What kinds of information(data) are collected and stored in VHMS?Item
Functional outline
Orbcomm
View by
WebCARE
Service meter,
date, and time
To monitor the operating condition by service meter.
When failures (see their codes to be described later) occur,
record the service meter, date, and time.
YES
YES
Failure codes
<Error history>
To record the error codes being displayed on the monitor panel.
However, the limitation is 600. If a new error occurs after then,
an old one will be deleted.
Besides, to those errors occurred frequently, its occurring times
in every 30-minute will be recorded.
YES
(When
error
occurred
each time.)
YES
Trend
By detecting the change with the moving graph, actions can be
taken before a breakdown occurs.
To record the data of the max. rpm, the max. exhaust
temperature, and the highest blowby pressure in every 20 hours.
<See the list of each model for the items to be measured>
YES (Each
setting
hours e.g.
20H,200H)
YES
Map
To analyze the way of using the machine, and then give
recommendation.
These data are used to relatively judge the degree of
accumulated loads of the components such as the engine load,
transmission shift change frequency, and so on.
No
YES
Snap-Shot
To analysis the data just before and after the failure for an early
solution to the problem.
If a serious error occurs, those data in the period of 5.5 minutes
before and 2 minutes after its occurrence (totally 7.5 minutes)
will be recorded.
<See the list of each model for the kinds of data>
No
limited
items only
Quick PM
<Manual
Trigger>
The above Snap-Shot function can be started by pressing the
manual switch. Those data in the period of 7.5 minutes after
pressing the button will be recorded. Since various data can be
collected automatically in case of torque converter stall, the
measuring time of Pm clinic can be reduced.
<The items to be measured are the same as those in SnapShot>
No
(Transfer
Error code
“MFA0”
only)
Limited
items only
Payload Meter
<when the
option is
installed>
To record the information collected via Payload Meter (option).
The times of over-load and exceeding speed limit can be used
as reference to judge the way of using the machine.
YES
(Each 24H)
YES
Maintenance
Record
<If this function
is installed on
the monitor
panel>
To record the maintenance history being input to the vehicle
monitor panel or the color graphic console.
No
No
Operating
Availability
For H/E
To record the time for each Hydraulic systems (Work Equipment,
Swing, Travel) . And calculate the ratio of operation.
No
No
Engine ON/OFF
history
To record the history of Engine ON/OFF and Engine start/stop.
No
YES
4.
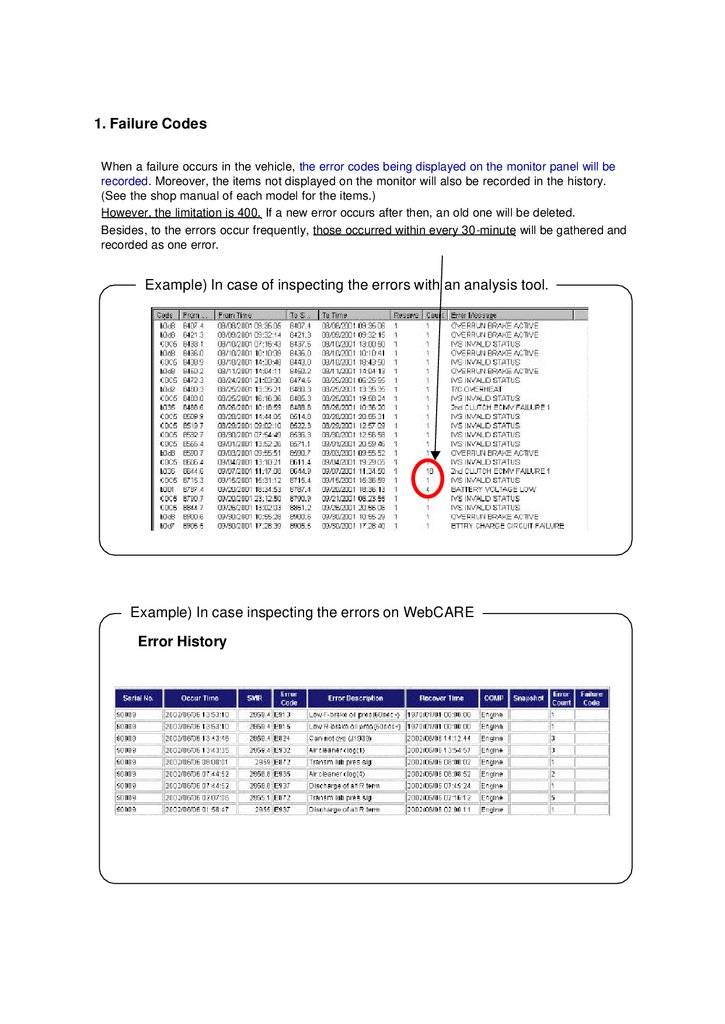
1. Failure CodesWhen a failure occurs in the vehicle, the error codes being displayed on the monitor panel will be
recorded. Moreover, the items not displayed on the monitor will also be recorded in the history.
(See the shop manual of each model for the items.)
However, the limitation is 400. If a new error occurs after then, an old one will be deleted.
Besides, to the errors occur frequently, those occurred within every 30-minute will be gathered and
recorded as one error.
Example) In case of inspecting the errors with an analysis tool.
Example) In case inspecting the errors on WebCARE
Error History
5.
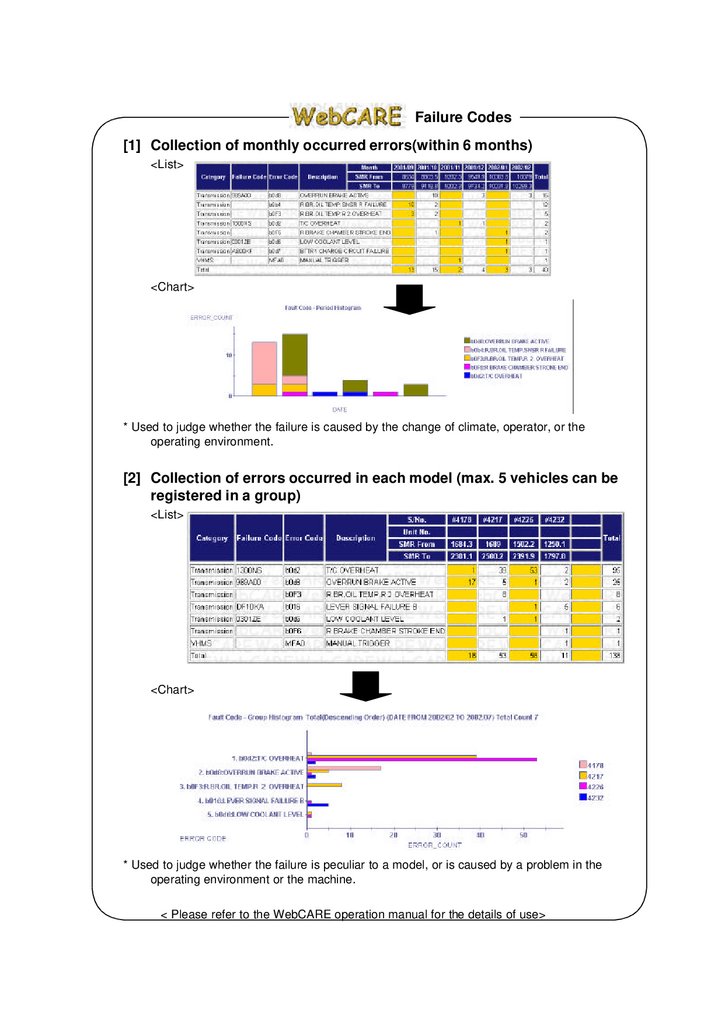
Failure Codes[1] Collection of monthly occurred errors(within 6 months)
<List>
<Chart>
* Used to judge whether the failure is caused by the change of climate, operator, or the
operating environment.
[2] Collection of errors occurred in each model (max. 5 vehicles can be
registered in a group)
<List>
<Chart>
* Used to judge whether the failure is peculiar to a model, or is caused by a problem in the
operating environment or the machine.
< Please refer to the WebCARE operation manual for the details of use>
6.
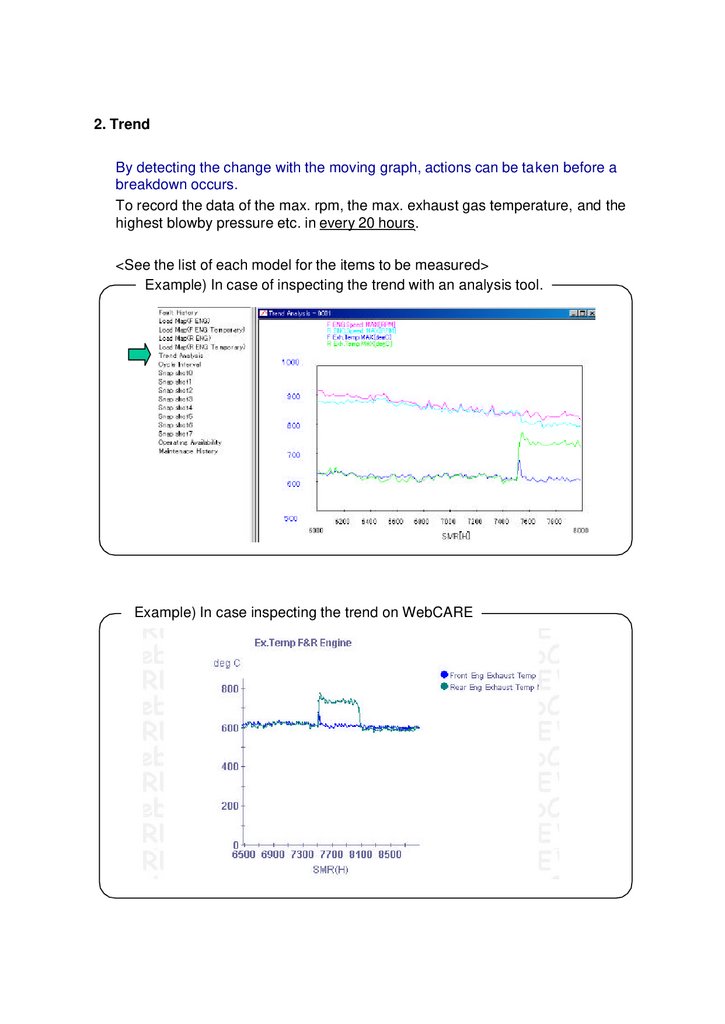
2. TrendBy detecting the change with the moving graph, actions can be taken before a
breakdown occurs.
To record the data of the max. rpm, the max. exhaust gas temperature, and the
highest blowby pressure etc. in every 20 hours.
<See the list of each model for the items to be measured>
Example) In case of inspecting the trend with an analysis tool.
Example) In case inspecting the trend on WebCARE
7.
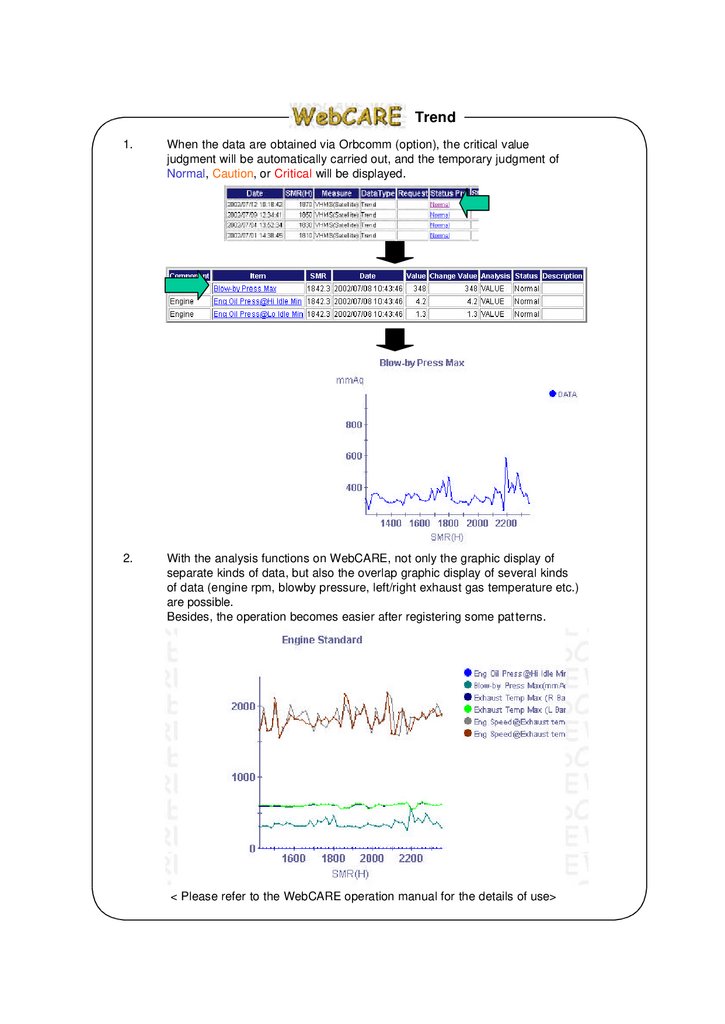
Trend1.
When the data are obtained via Orbcomm (option), the critical value
judgment will be automatically carried out, and the temporary judgment of
Normal, Caution, or Critical will be displayed.
2.
With the analysis functions on WebCARE, not only the graphic display of
separate kinds of data, but also the overlap graphic display of several kinds
of data (engine rpm, blowby pressure, left/right exhaust gas temperature etc.)
are possible.
Besides, the operation becomes easier after registering some patterns.
< Please refer to the WebCARE operation manual for the details of use>
8.
Key Points!!!In Pm clinic, when measuring the engine rpm, exhaust gas temperature, and blowby pressure,
the torque converter stall and oil pressure relief are taken as the load condition. While in
VHMS, the data are sampled continuously in 20 hours, and the maximum, the minimum, and
the mean can be obtained.
By inspecting the trend of the data, it is easy to judge whether the load is a continuous one or a
temporary one. Monitoring data in this way is helpful to estimate the life of the machine.
Particularly, the following 3 items (blowby pressure, exhaust gas temperature, and the fuel
consumption ) are important in inspecting the load.
[1] The blowby pressure, measured at the point of maximum horse power, is at its maximum
value. Therefore, the engine rpm at the point of the maximum blowby pressure can be handle
as the rated engine rpm.
≈ Means “Approximate Value”
The maximum blowby value ≈ the rated point (the maximum horse power)
<The engine rpm at the maximum blowby ≈ the rated engine rpm>
By the load conditions of torque converter stall and oil pressure relief being used in Pm clinic,
the data in real operation have high possibility to become the condition of rated rpm (the
maximum horse power).
Important
On the specification of blowby pressure
The conditions for carrying out the quick PM or PM clinic are torque stall, or torque stall +
operating machine relief. The specification at this time is described in the job manual.
However, when inspecting the maximum value in the real operation of 20 hours like the
trend of VHMS, the specification for judging OK/NG is also changed.
In the case of the maximum value of the real operation 20 hours obtained from the real
data, under the influences of being near to the maximum horse power, the over shoot, and
so on, a higher value than that in specified condition of quick PM or PM clinic can be
obtained.
Therefore, the specification used in judging abnormality on VHMS or inspecting the trend
on WebCARE is set to a higher value than that described in the shop manual.
9.
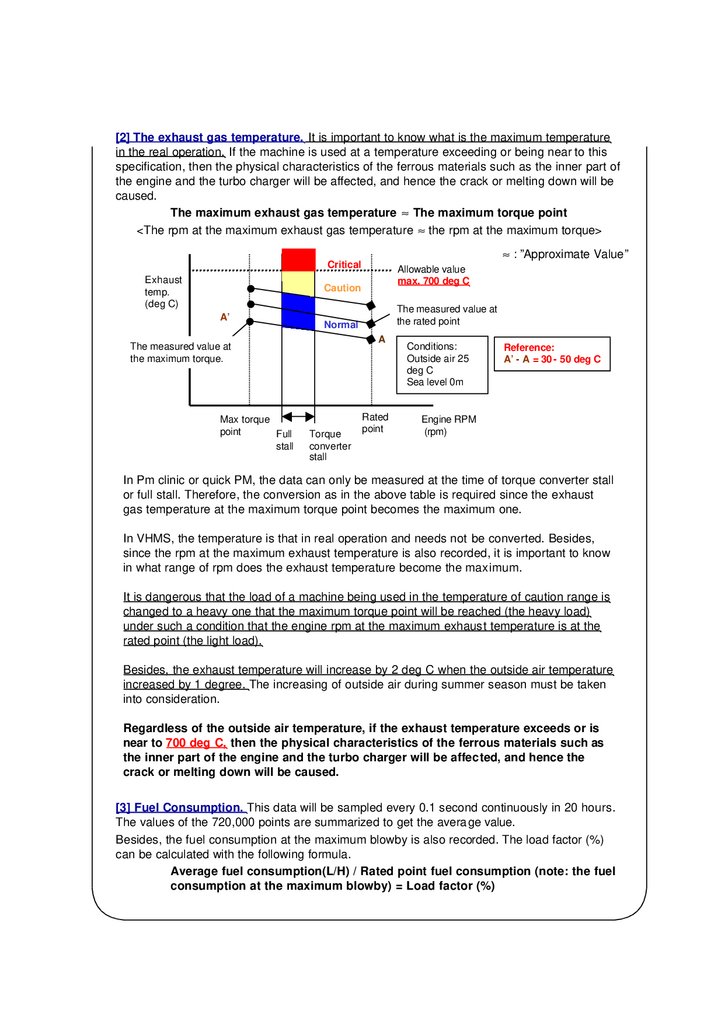
[2] The exhaust gas temperature. It is important to know what is the maximum temperaturein the real operation. If the machine is used at a temperature exceeding or being near to this
specification, then the physical characteristics of the ferrous materials such as the inner part of
the engine and the turbo charger will be affected, and hence the crack or melting down will be
caused.
The maximum exhaust gas temperature ≈ The maximum torque point
<The rpm at the maximum exhaust gas temperature ≈ the rpm at the maximum torque>
≈ : ”Approximate Value”
Critical
Exhaust
temp.
(deg C)
Allowable value
max. 700 deg C
Caution
A’
A
The measured value at
the maximum torque.
Max torque
point
Full
stall
The measured value at
the rated point
Normal
Torque
converter
stall
Rated
point
Conditions:
Outside air 25
deg C
Sea level 0m
Reference:
A’ - A = 30 - 50 deg C
Engine RPM
(rpm)
In Pm clinic or quick PM, the data can only be measured at the time of torque converter stall
or full stall. Therefore, the conversion as in the above table is required since the exhaust
gas temperature at the maximum torque point becomes the maximum one.
In VHMS, the temperature is that in real operation and needs not be converted. Besides,
since the rpm at the maximum exhaust temperature is also recorded, it is important to know
in what range of rpm does the exhaust temperature become the maximum.
It is dangerous that the load of a machine being used in the temperature of caution range is
changed to a heavy one that the maximum torque point will be reached (the heavy load)
under such a condition that the engine rpm at the maximum exhaust temperature is at the
rated point (the light load).
Besides, the exhaust temperature will increase by 2 deg C when the outside air temperature
increased by 1 degree. The increasing of outside air during summer season must be taken
into consideration.
Regardless of the outside air temperature, if the exhaust temperature exceeds or is
near to 700 deg C, then the physical characteristics of the ferrous materials such as
the inner part of the engine and the turbo charger will be affected, and hence the
crack or melting down will be caused.
[3] Fuel Consumption. This data will be sampled every 0.1 second continuously in 20 hours.
The values of the 720,000 points are summarized to get the average value.
Besides, the fuel consumption at the maximum blowby is also recorded. The load factor (%)
can be calculated with the following formula.
Average fuel consumption(L/H) / Rated point fuel consumption (note: the fuel
consumption at the maximum blowby) = Load factor (%)
10.
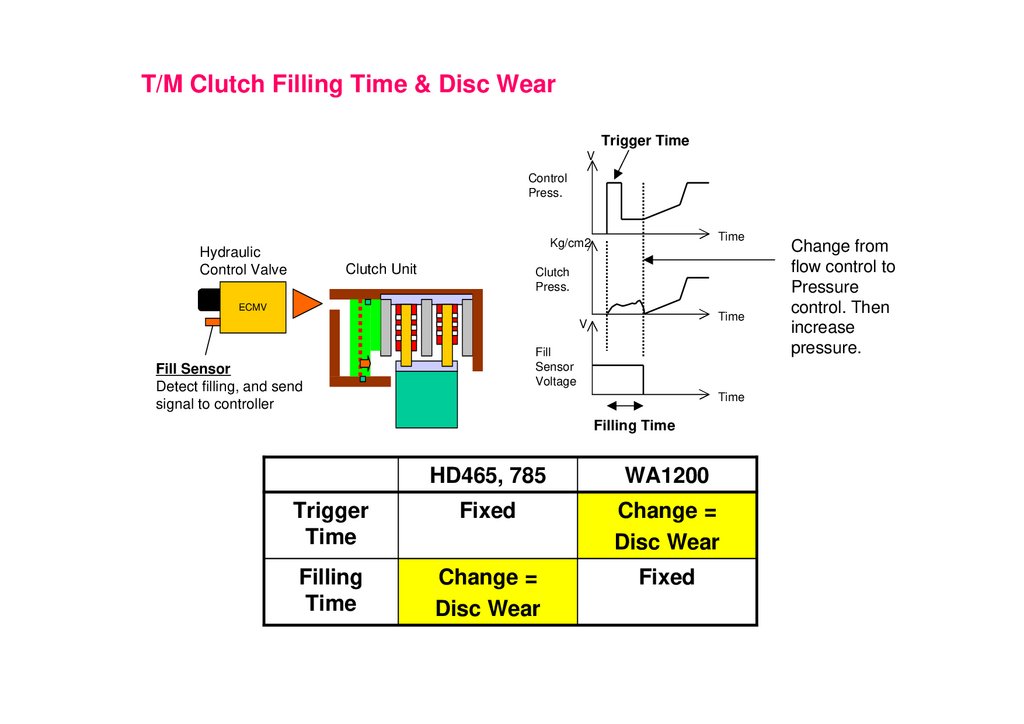
T/M Clutch Filling Time & Disc WearTrigger Time
V
Control
Press.
Time
Kg/cm2
Hydraulic
Control Valve
Clutch Unit
Clutch
Press.
ECMV
Time
V
Fill
Sensor
Voltage
Fill Sensor
Detect filling, and send
signal to controller
Time
Filling Time
HD465, 785
WA1200
Trigger
Time
Fixed
Change =
Disc Wear
Filling
Time
Change =
Disc Wear
Fixed
Change from
flow control to
Pressure
control. Then
increase
pressure.
11.
Transmission Shift Change MapTo record the frequency (times) on the shift changes from one rpm to another rpm.
Besides, it can also be seen what area of speed was used.
Important
The abuse of machine can be detected
As an example of HD785-5 in the above table, it was found that the vehicle was operated by
frequently changing from “D range” to “N” . And the vehicle was operated by changing from
“N” to “D” while moving from force of habit.
In normal operation, change from F3, F4 to “N” or from “N” to F3,F4 that is not allowed.
Example) In case of using WebCARE
3D display
Bubble display
< Please refer to the WebCARE operation manual for the details of use>
12.
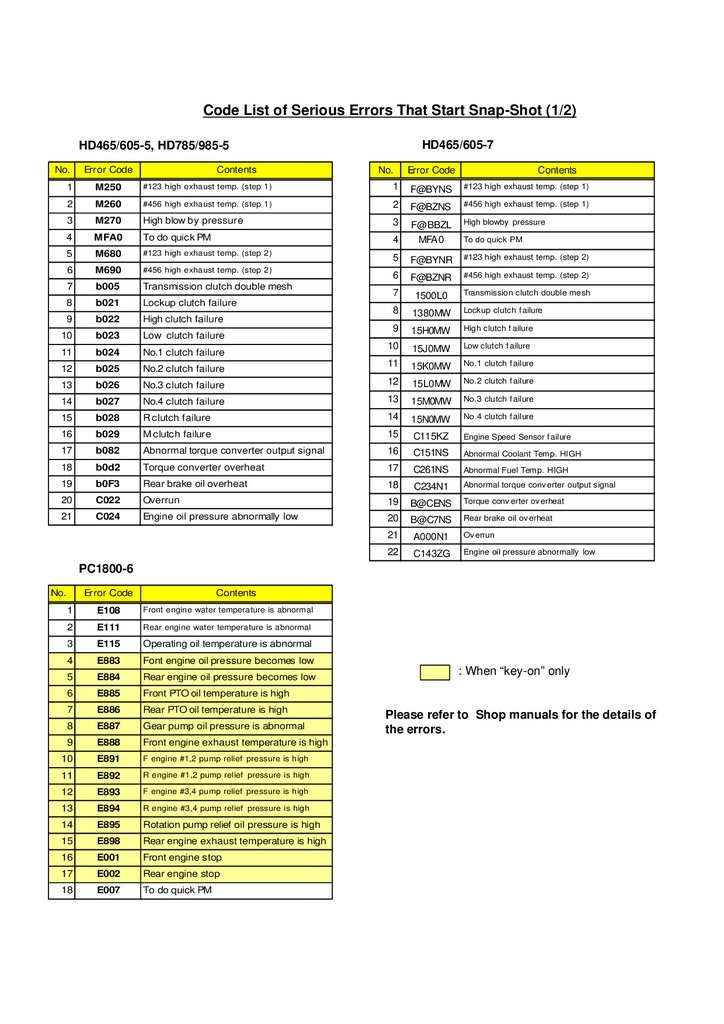
Code List of Serious Errors That Start Snap-Shot (1/2)HD465/605-7
HD465/605-5, HD785/985-5
No.
Error Code
Contents
No.
Error Code
Contents
1
M250
#123 high exhaust temp. (step 1)
1
F@BYNS
#123 high exhaust temp. (step 1)
2
M260
#456 high exhaust temp. (step 1)
2
F@BZNS
#456 high exhaust temp. (step 1)
High blowby pressure
3
M270
High blow by pressure
3
F@BBZL
4
MFA0
To do quick PM
4
MFA0
5
M680
#123 high exhaust temp. (step 2)
5
F@BYNR
#123 high exhaust temp. (step 2)
6
M690
#456 high exhaust temp. (step 2)
6
b005
Transmission clutch double mesh
F@BZNR
#456 high exhaust temp. (step 2)
7
7
b021
Lockup clutch failure
1500L0
Transmission clutch double mesh
8
b022
High clutch failure
8
1380MW
Lockup clutch f ailure
9
10
b023
Low clutch failure
To do quick PM
9
15H0MW
High clutch f ailure
10
15J0MW
Low clutch f ailure
11
15K0MW
No.1 clutch f ailure
11
b024
No.1 clutch failure
12
b025
No.2 clutch failure
13
b026
No.3 clutch failure
12
15L0MW
No.2 clutch f ailure
14
b027
No.4 clutch failure
13
15M0MW
No.3 clutch f ailure
15
b028
R clutch failure
14
15N0MW
No.4 clutch f ailure
16
b029
M clutch failure
15
C115KZ
Engine Speed Sensor f ailure
17
b082
Abnormal torque converter output signal
16
C151NS
Abnormal Coolant Temp. HIGH
18
b0d2
Torque converter overheat
17
C261NS
Abnormal Fuel Temp. HIGH
19
b0F3
Rear brake oil overheat
18
C234N1
Abnormal torque conv erter output signal
20
C022
Overrun
19
B@CENS
Torque conv erter ov erheat
21
C024
Engine oil pressure abnormally low
20
B@C7NS
Rear brake oil ov erheat
21
A000N1
Ov errun
22
C143ZG
Engine oil pressure abnormally low
PC1800-6
No.
Error Code
Contents
1
E108
Front engine water temperature is abnormal
2
E111
Rear engine water temperature is abnormal
3
E115
Operating oil temperature is abnormal
4
E883
Font engine oil pressure becomes low
5
E884
Rear engine oil pressure becomes low
6
E885
Front PTO oil temperature is high
7
E886
Rear PTO oil temperature is high
8
E887
Gear pump oil pressure is abnormal
9
E888
Front engine exhaust temperature is high
10
E891
F engine #1,2 pump relief pressure is high
11
E892
R engine #1,2 pump relief pressure is high
12
E893
F engine #3,4 pump relief pressure is high
13
E894
R engine #3,4 pump relief pressure is high
14
E895
Rotation pump relief oil pressure is high
15
E898
Rear engine exhaust temperature is high
16
E001
Front engine stop
17
E002
Rear engine stop
18
E007
To do quick PM
: When “key-on” only
Please refer to Shop manuals for the details of
the errors.
13.
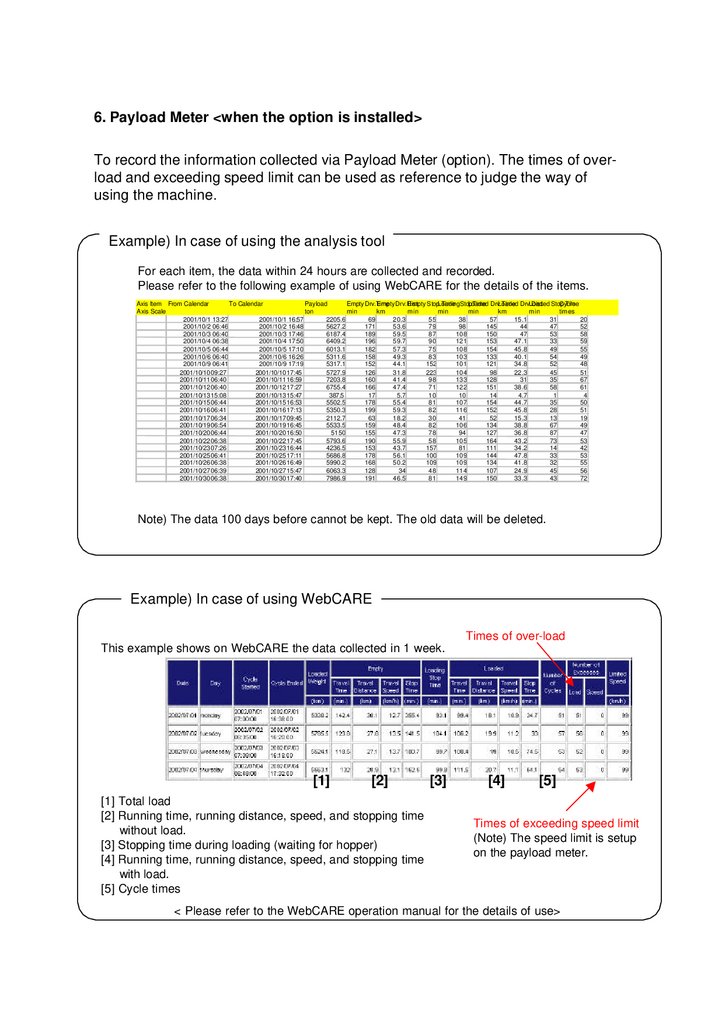
6. Payload Meter <when the option is installed>To record the information collected via Payload Meter (option). The times of overload and exceeding speed limit can be used as reference to judge the way of
using the machine.
Example) In case of using the analysis tool
For each item, the data within 24 hours are collected and recorded.
Please refer to the following example of using WebCARE for the details of the items.
Axis Item From Calendar
To Calendar
Payload
Empty Drv.Time
Empty Drv.Dist.
Empty StopLoadingStopTime
Time
Loaded Drv.Time
Loaded Drv.Dist.
Loaded Stop
Cycle
Time
Axis Scale
ton
min
km
min
min
min
km
min
times
2001/10/1 13:27
2001/10/1 16:57
2205.6
69
20.3
55
38
57
15.1
31
20
2001/10/2 06:46
2001/10/2 16:48
5627.2
171
53.6
79
98
145
44
47
52
2001/10/3 06:40
2001/10/3 17:46
6187.4
189
59.5
87
108
150
47
53
58
2001/10/4 06:38
2001/10/4 17:50
6409.2
196
59.7
90
121
153
47.1
33
59
2001/10/5 06:44
2001/10/5 17:10
6013.1
182
57.3
75
108
154
45.8
49
55
2001/10/6 06:40
2001/10/6 16:26
5311.6
158
49.3
83
103
133
40.1
54
49
2001/10/9 06:41
2001/10/9 17:19
5317.1
152
44.1
152
101
121
34.8
52
48
2001/10/10 09:27
2001/10/10 17:45
5727.9
126
31.8
223
104
98
22.3
45
51
2001/10/11 06:40
2001/10/11 16:59
7203.8
160
41.4
98
133
128
31
35
67
2001/10/12 06:40
2001/10/12 17:27
6755.4
166
47.4
71
122
151
38.6
58
61
2001/10/13 15:08
2001/10/13 15:47
387.5
17
5.7
10
10
14
4.7
1
4
2001/10/15 06:44
2001/10/15 16:53
5502.5
178
55.4
81
107
154
44.7
35
50
2001/10/16 06:41
2001/10/16 17:13
5350.3
199
59.3
82
116
152
45.8
28
51
2001/10/17 06:34
2001/10/17 09:45
2112.7
63
18.2
30
41
52
15.3
13
19
2001/10/19 06:54
2001/10/19 16:45
5533.5
159
48.4
82
106
134
38.8
67
49
2001/10/20 06:44
2001/10/20 16:50
5150
155
47.3
78
94
127
36.8
87
47
2001/10/22 06:38
2001/10/22 17:45
5793.6
190
55.9
58
105
164
43.2
73
53
2001/10/23 07:26
2001/10/23 16:44
4236.5
153
43.7
157
81
111
34.2
14
42
2001/10/25 06:41
2001/10/25 17:11
5686.8
178
56.1
100
109
144
47.8
33
53
2001/10/26 06:38
2001/10/26 16:49
5990.2
168
50.2
109
109
134
41.8
32
55
2001/10/27 06:39
2001/10/27 15:47
6063.3
128
34
48
114
107
24.9
45
56
2001/10/30 06:38
2001/10/30 17:40
7986.9
191
46.5
81
149
150
33.3
43
72
Note) The data 100 days before cannot be kept. The old data will be deleted.
Example) In case of using WebCARE
Times of over-load
This example shows on WebCARE the data collected in 1 week.
[1]
[2]
[1] Total load
[2] Running time, running distance, speed, and stopping time
without load.
[3] Stopping time during loading (waiting for hopper)
[4] Running time, running distance, speed, and stopping time
with load.
[5] Cycle times
[3]
[4]
[5]
Times of exceeding speed limit
(Note) The speed limit is setup
on the payload meter.
< Please refer to the WebCARE operation manual for the details of use>
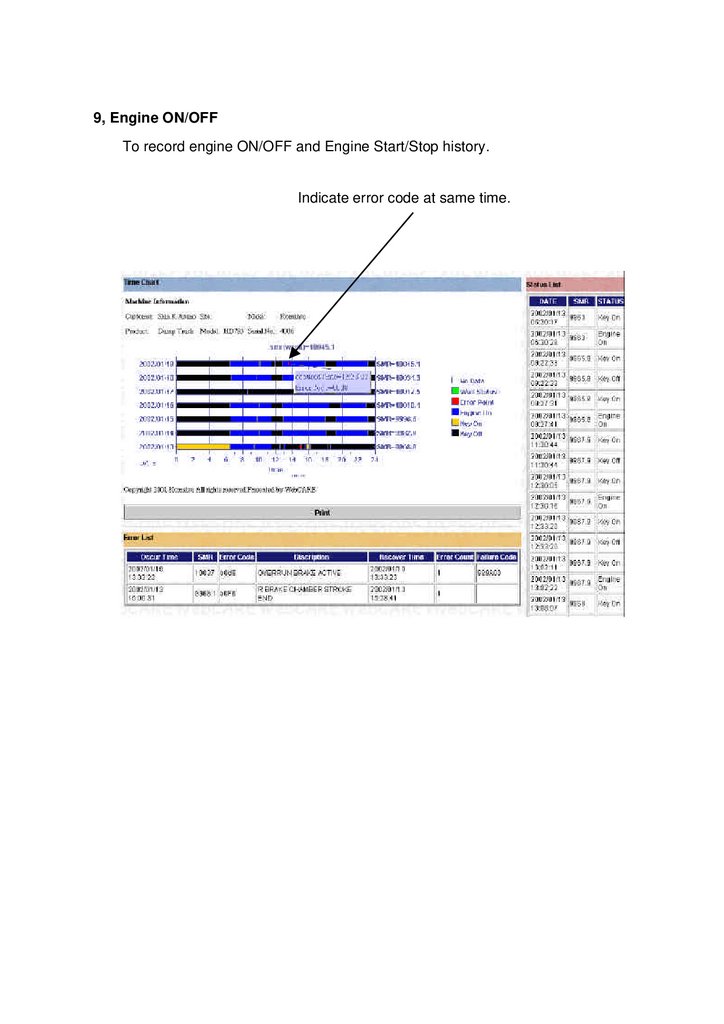
14.
9, Engine ON/OFFTo record engine ON/OFF and Engine Start/Stop history.
Indicate error code at same time.
15.
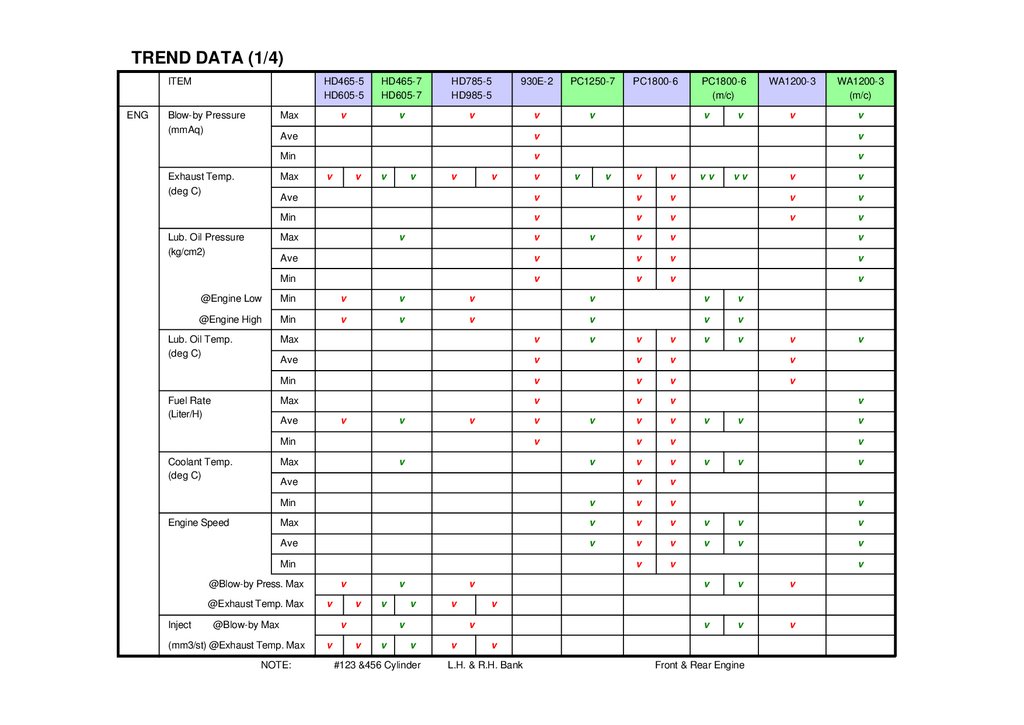
TREND DATA (1/4)ITEM
ENG
Blow-by Pressure
(mmAq)
HD465-5
HD605-5
HD465-7
HD605-7
HD785-5
HD985-5
930E-2
PC1250-7
v
v
v
v
v
Max
Exhaust Temp.
(deg C)
v
v
v
v
v
v
v
v
v
v
v
v
v
v
v
v
vv
vv
v
v
Ave
v
v
v
v
v
Min
v
v
v
v
v
v
v
v
v
v
v
Ave
v
v
v
v
Min
v
v
v
v
v
v
v
v
v
v
@Engine High
Min
v
v
v
v
v
v
v
v
Max
v
v
v
Ave
v
v
v
v
Min
v
v
v
v
Max
v
v
v
v
v
v
v
v
v
v
v
Ave
v
v
v
v
Min
v
v
v
Max
v
v
Ave
Engine Speed
v
Min
Min
Coolant Temp.
(deg C)
WA1200-3
(m/c)
v
@Engine Low
Fuel Rate
(Liter/H)
WA1200-3
v
Max
Lub. Oil Temp.
(deg C)
v
v
v
v
v
v
v
v
v
v
Min
v
v
v
Max
v
v
v
v
v
v
Ave
v
v
v
v
v
v
v
v
Min
@Blow-by Press. Max
@Exhaust Temp. Max
Inject
PC1800-6
(m/c)
Ave
Max
Lub. Oil Pressure
(kg/cm2)
PC1800-6
v
v
@Blow-by Max
(mm3/st) @Exhaust Temp. Max
NOTE:
v
v
v
v
v
v
v
v
v
v
v
#123 &456 Cylinder
v
v
v
v
v
v
v
v
v
v
v
v
v
L.H. & R.H. Bank
Front & Rear Engine
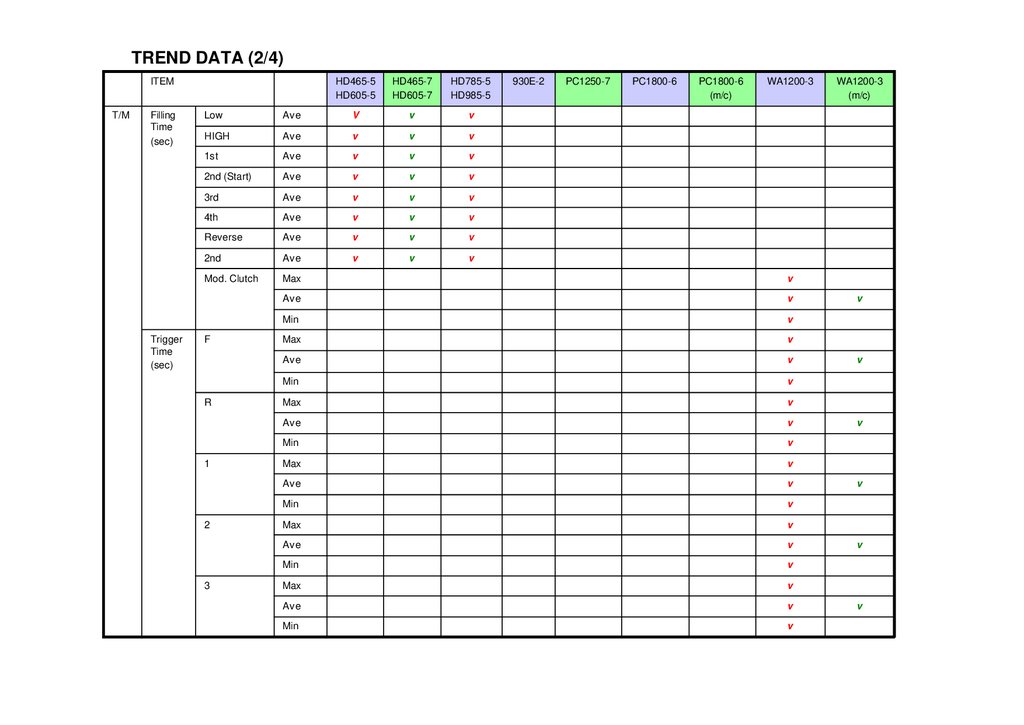
16.
TREND DATA (2/4)ITEM
T/M
Filling
Time
(sec)
Trigger
Time
(sec)
HD465-5
HD605-5
HD465-7
HD605-7
HD785-5
HD985-5
930E-2
PC1250-7
PC1800-6
PC1800-6
(m/c)
WA1200-3
Low
Ave
V
v
v
HIGH
Ave
v
v
v
1st
Ave
v
v
v
2nd (Start)
Ave
v
v
v
3rd
Ave
v
v
v
4th
Ave
v
v
v
Reverse
Ave
v
v
v
2nd
Ave
v
v
v
Mod. Clutch
Max
v
Ave
v
Min
v
Max
v
Ave
v
Min
v
Max
v
Ave
v
Min
v
Max
v
Ave
v
Min
v
Max
v
Ave
v
Min
v
Max
v
Ave
v
Min
v
F
R
1
2
3
WA1200-3
(m/c)
v
v
v
v
v
v