
Similar presentations:


QAP Agency Contact
1.
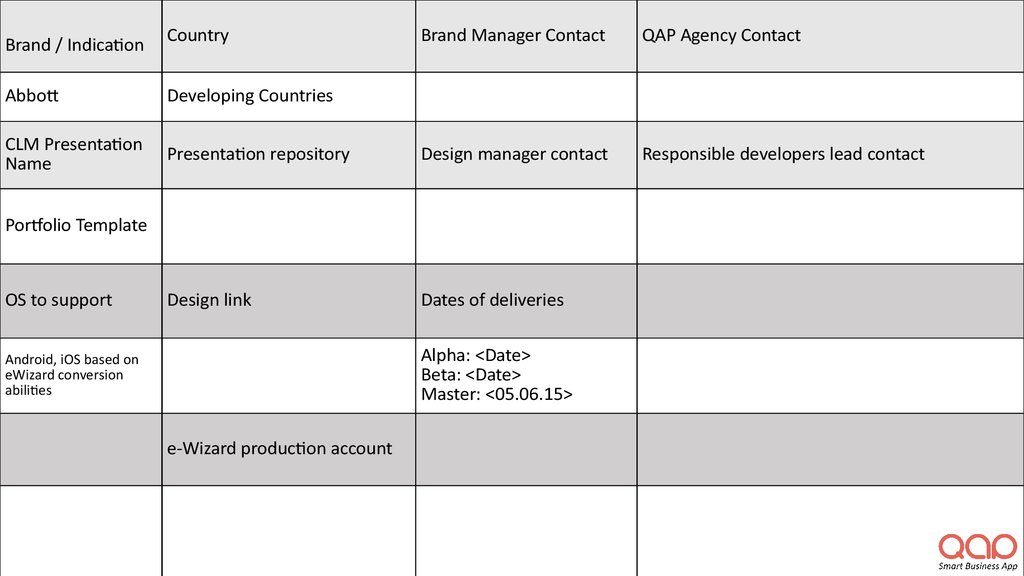
Brand / IndicationCountry
Brand Manager Contact
QAP Agency Contact
Responsible developers lead contact
Abbot
Developing Countries
CLM Presentation
Name
Presentation repository
Design manager contact
Design link
Dates of deliveries
Portfolio Template
OS to support
Alpha: <Date>
Beta: <Date>
Master: <05.06.15>
Android, iOS based on
eWizard conversion
abilities
e-Wizard production account
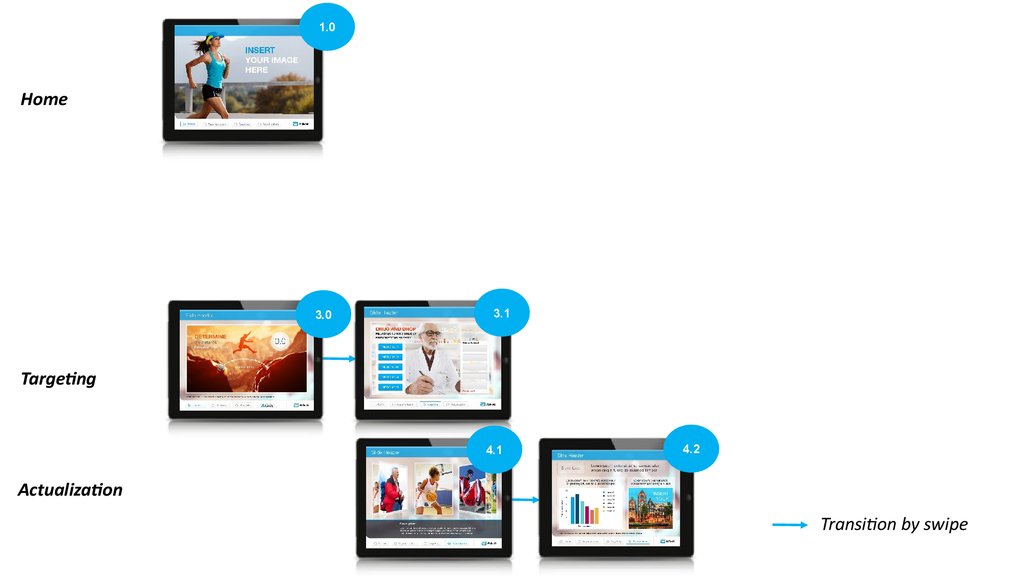
2.
Presentation structure3.
1.0Home
3.0
3.1
Targeting
4.1
4.2
Actualization
Transition by swipe
4.
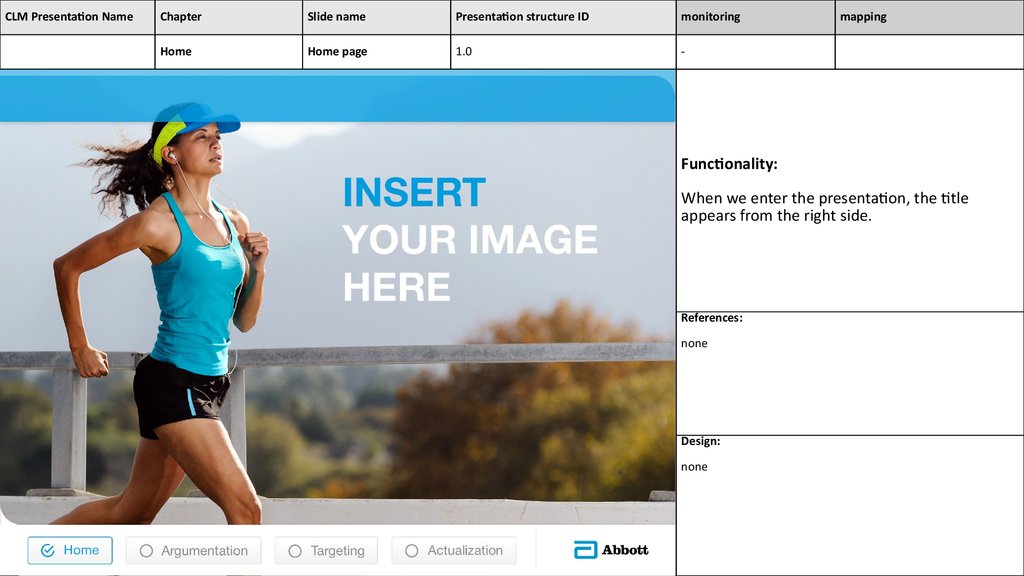
CLM Presentation NameChapter
Slide name
Presentation structure ID
monitoring
Home
Home page
1.0
-
mapping
Functionality:
When we enter the presentation, the title
appears from the right side.
References:
none
Design:
none
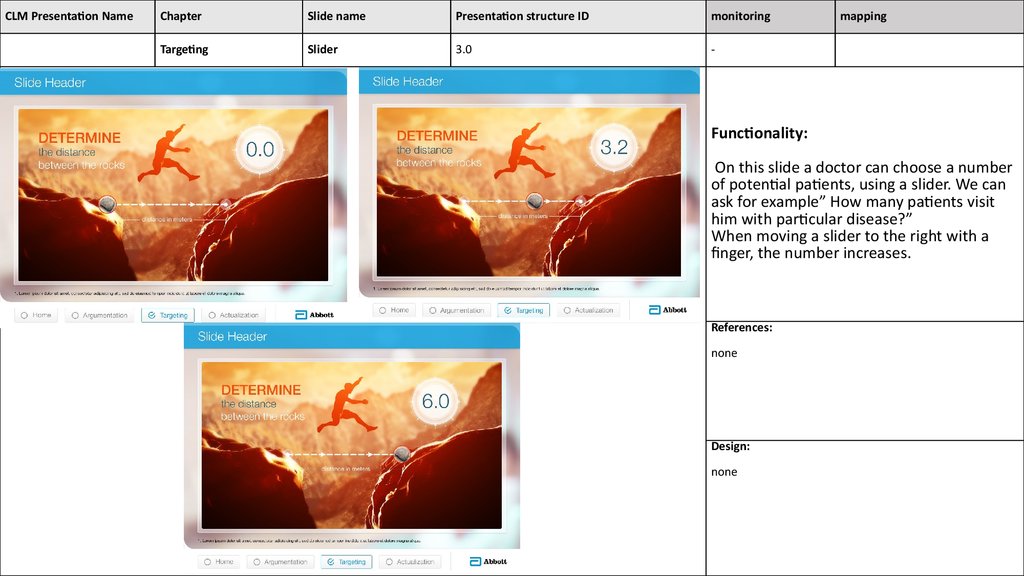
5.
CLM Presentation NameChapter
Slide name
Presentation structure ID
monitoring
Targeting
Slider
3.0
-
mapping
Functionality:
On this slide a doctor can choose a number
of potential patients, using a slider. We can
ask for example” How many patients visit
him with particular disease?”
When moving a slider to the right with a
finger, the number increases.
References:
none
Design:
none
6.
CLM Presentation NameChapter
Slide name
Presentation structure ID
monitoring
Targeting
Draggable
3.1
-
mapping
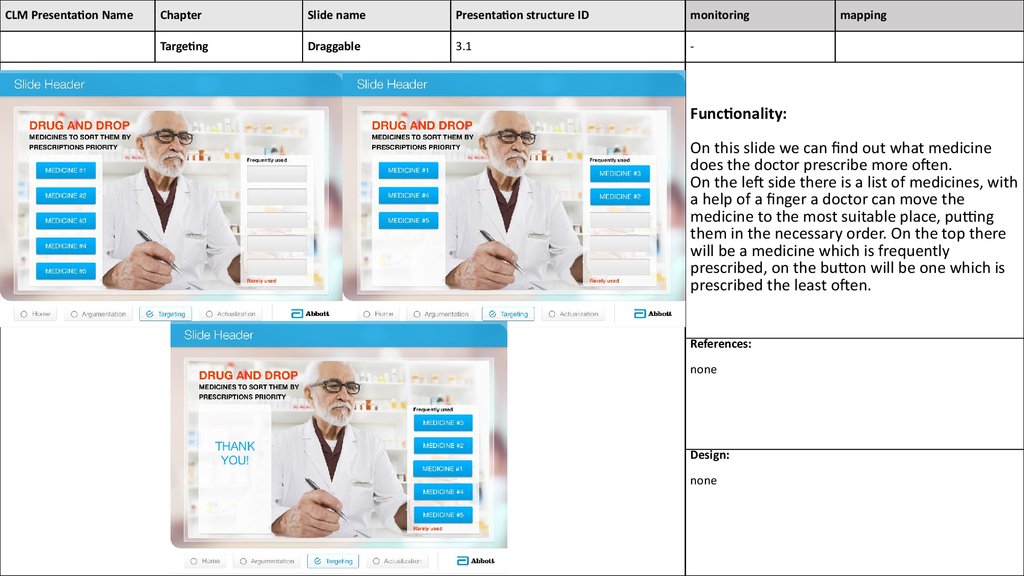
Functionality:
On this slide we can find out what medicine
does the doctor prescribe more often.
On the left side there is a list of medicines, with
a help of a finger a doctor can move the
medicine to the most suitable place, putting
them in the necessary order. On the top there
will be a medicine which is frequently
prescribed, on the buton will be one which is
prescribed the least often.
References:
none
Design:
none
7.
CLM Presentation NameChapter
Slide name
Presentation structure ID
monitoring
Actualization
Cover flow
4.1
-
mapping
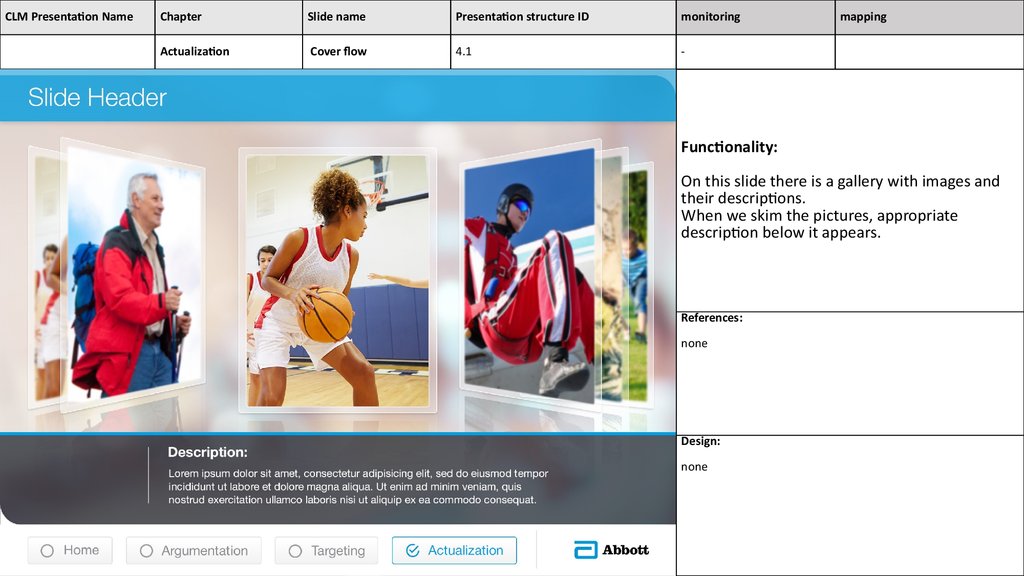
Functionality:
On this slide there is a gallery with images and
their descriptions.
When we skim the pictures, appropriate
description below it appears.
References:
none
Design:
none
8.
CLM Presentation NameChapter
Slide name
Presentation structure ID
monitoring
Actualization
Chart
4.2
-
mapping
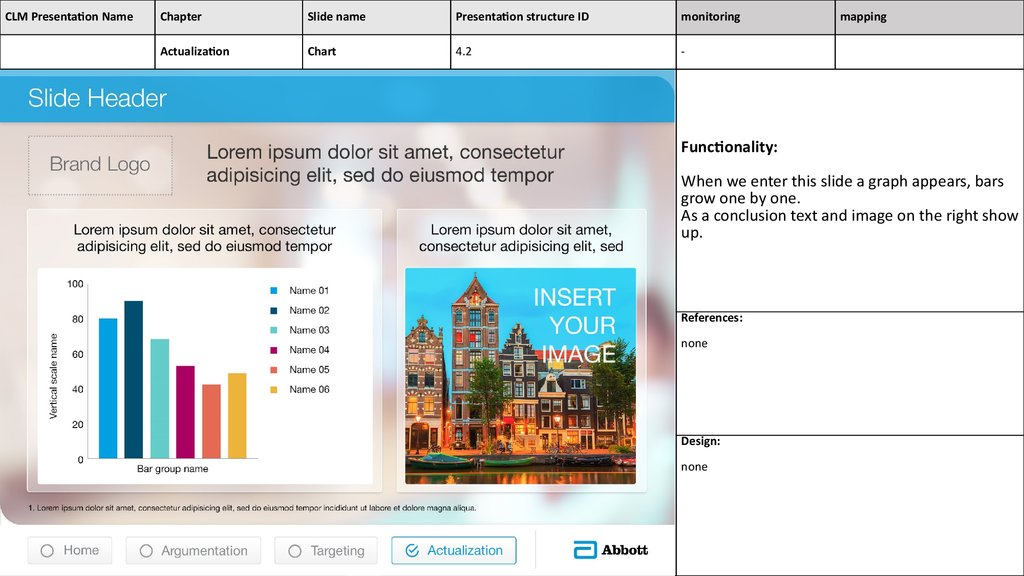
Functionality:
When we enter this slide a graph appears, bars
grow one by one.
As a conclusion text and image on the right show
up.
References:
none
Design:
none