


 finance
Similar presentations:
")


Methods of comparable data obtaining. Currency conversion. Average annual exchange rate. The purchasing power parity
1.
Methods ofcomparable data
obtaining
Тимофеева А.А. 2018 ©
1
2.
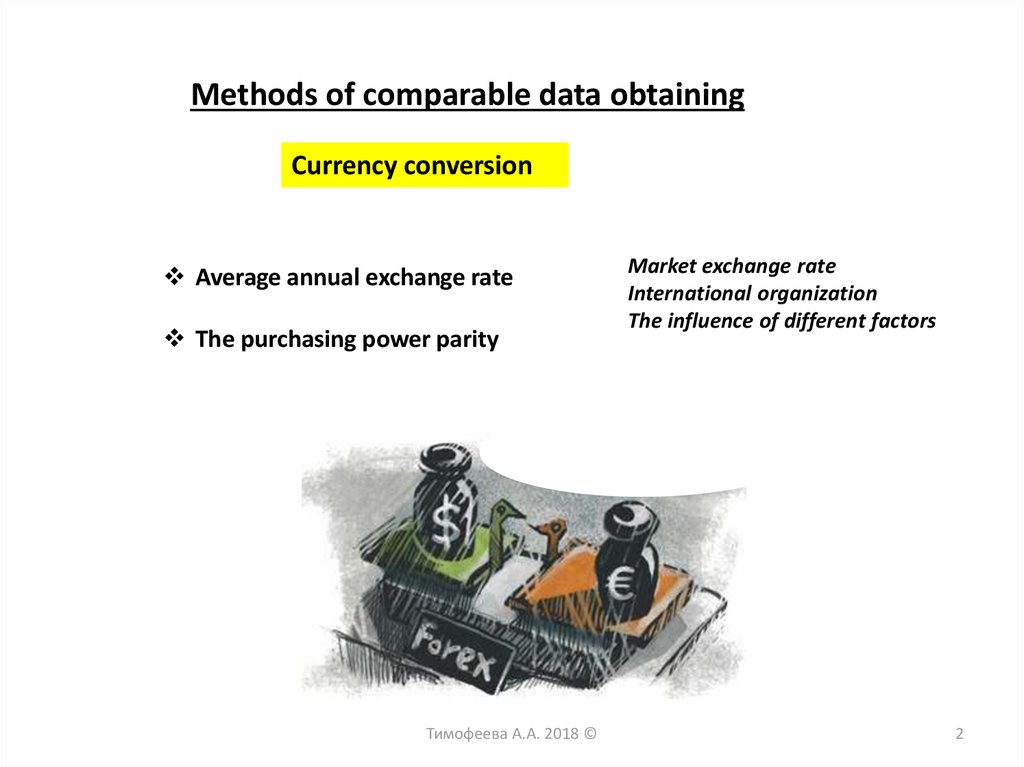
Methods of comparable data obtainingCurrency conversion
Average annual exchange rate
The purchasing power parity
Тимофеева А.А. 2018 ©
Market exchange rate
International organization
The influence of different factors
2
3.
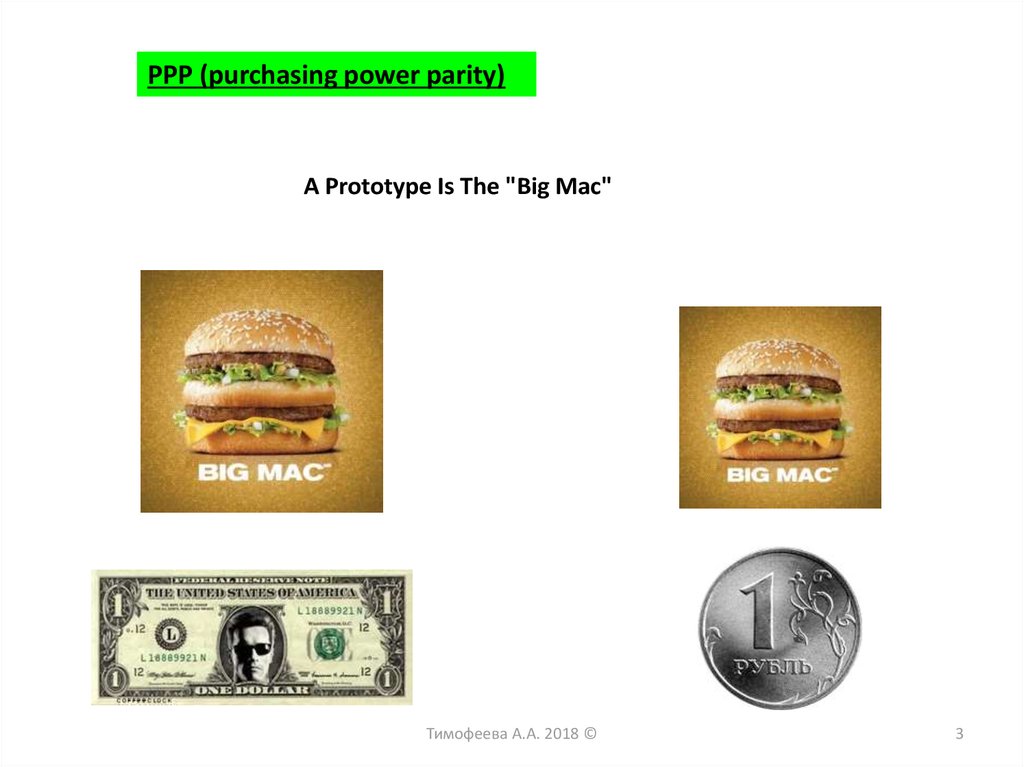
PPP (purchasing power parity)A Prototype Is The "Big Mac"
Тимофеева А.А. 2018 ©
3
4.
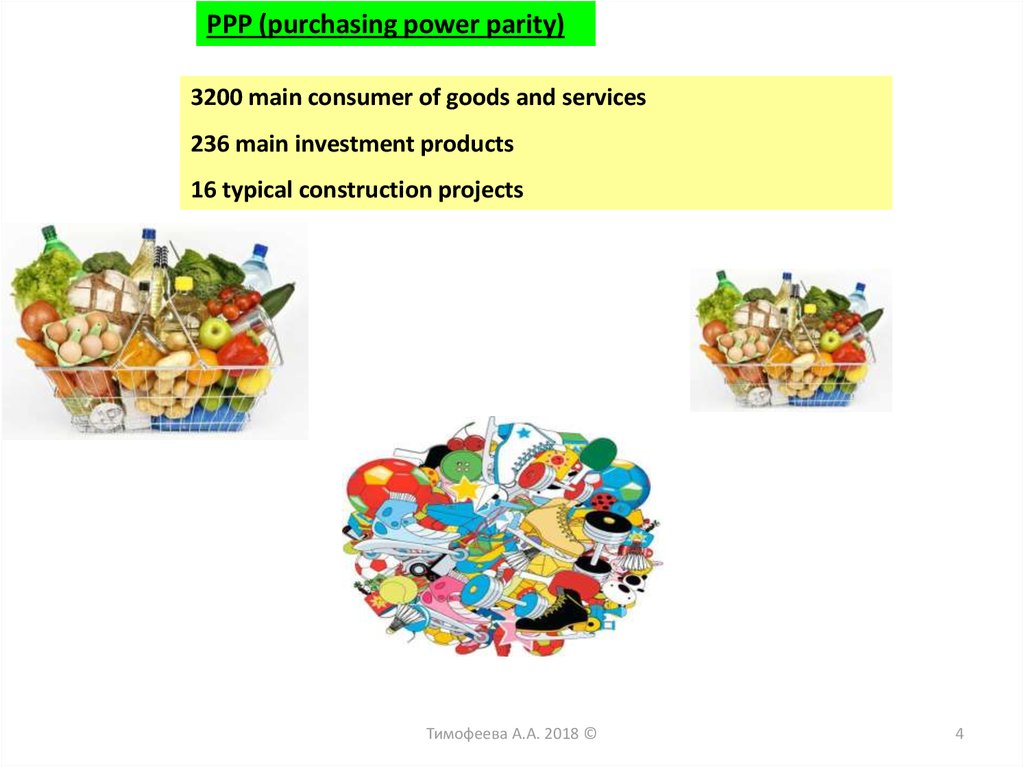
PPP (purchasing power parity)3200 main consumer of goods and services
236 main investment products
16 typical construction projects
Тимофеева А.А. 2018 ©
4
5.
When PPP?Cross-country comparisons
Rational allocation of limited funds (quotas of the IMF)
The identification of appropriate exchange rates for countries
opening their economies
Тимофеева А.А. 2018 ©
5
6.
Сomparable price levelТимофеева А.А. 2018 ©
6
7.
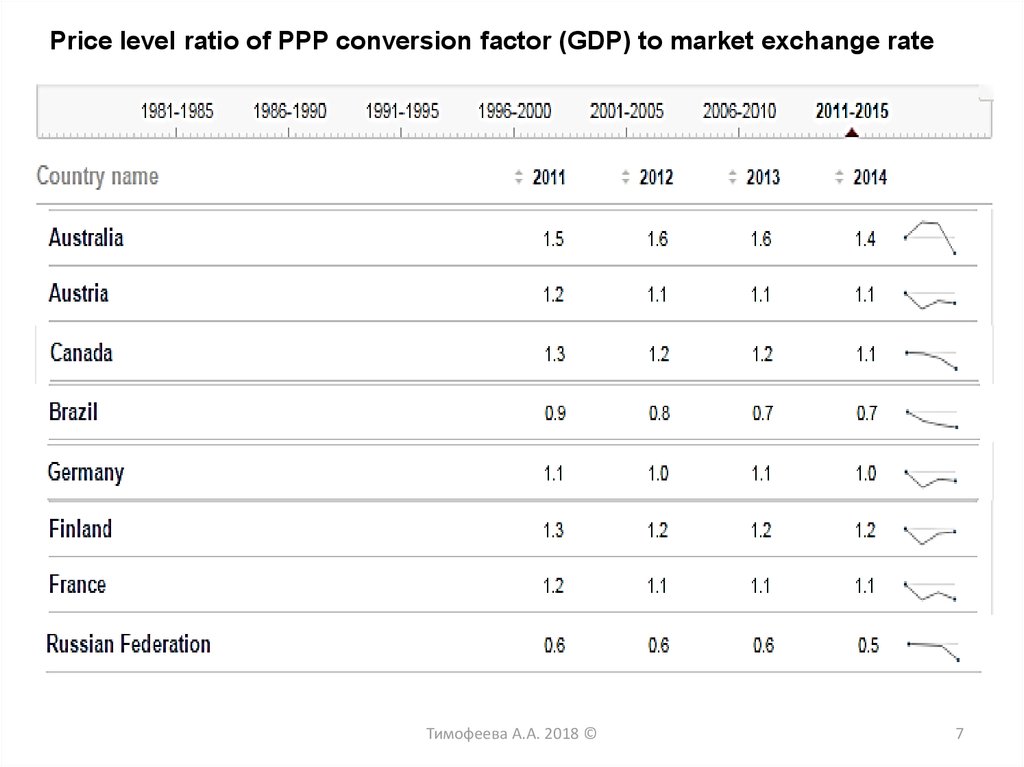
Price level ratio of PPP conversion factor (GDP) to market exchange rateТимофеева А.А. 2018 ©
7
8.
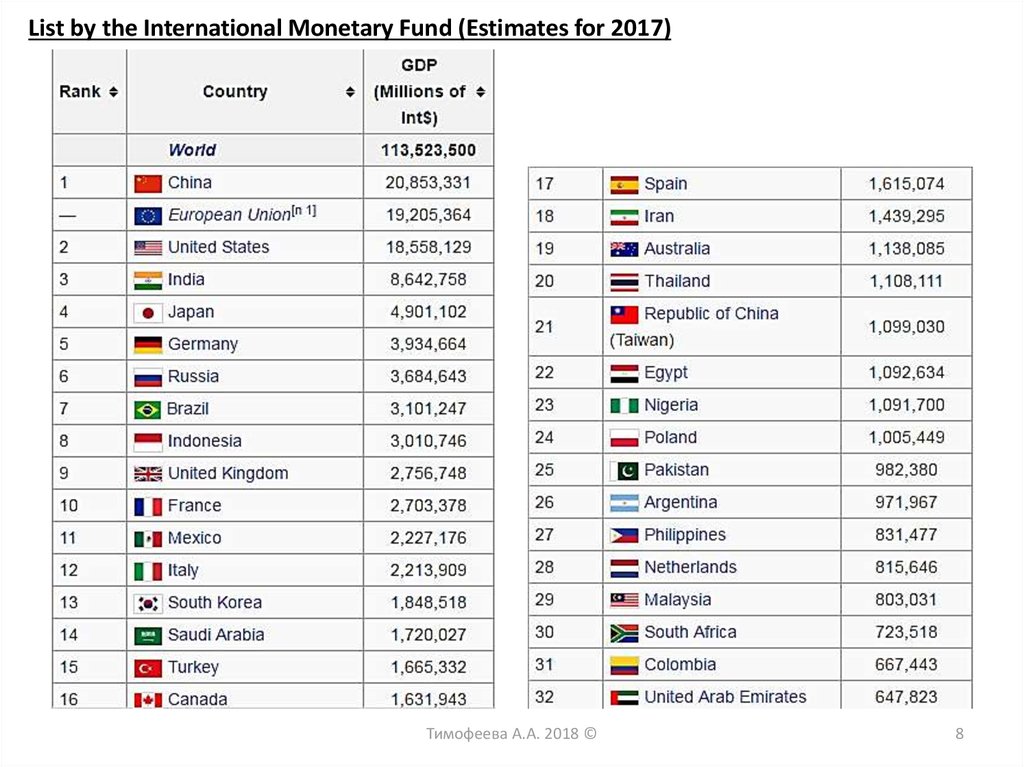
List by the International Monetary Fund (Estimates for 2017)Тимофеева А.А. 2018 ©
8
9.
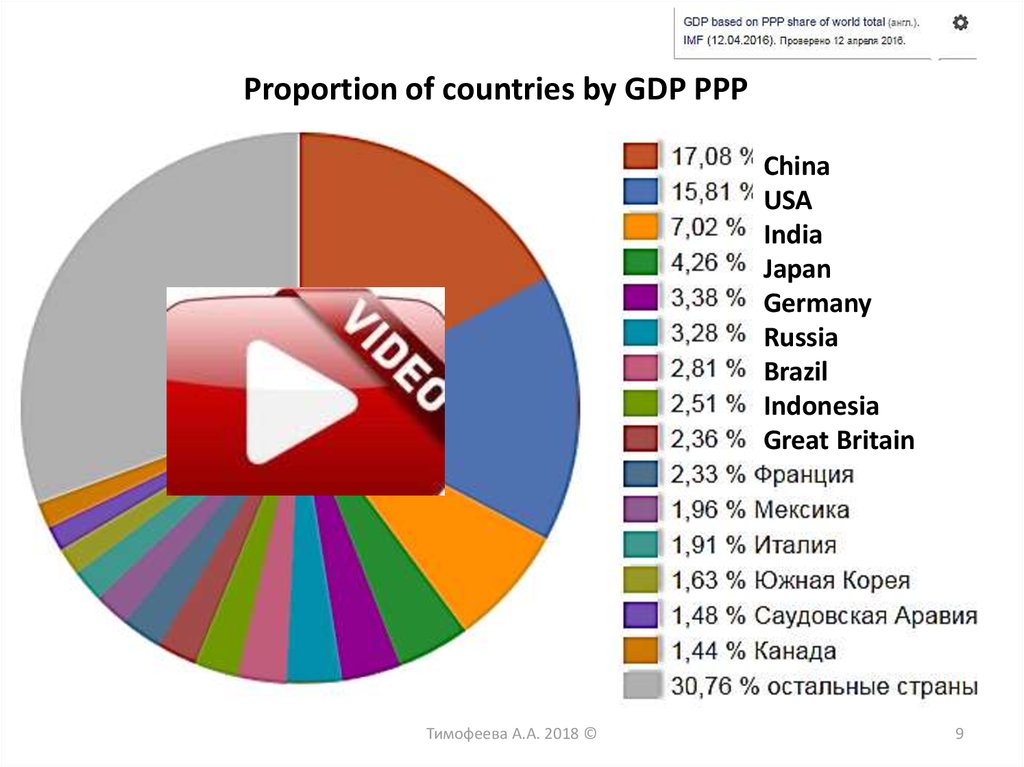
Proportion of countries by GDP PPPChina
USA
India
Japan
Germany
Russia
Brazil
Indonesia
Great Britain
Тимофеева А.А. 2018 ©
9
10.
Сlassification of the countries10
11.
The number of States and dependent territories in the world195 countries, 72 dependent areas
Country = economy
≠ state
Colony = "dependent
territory"
Neocolonialism
11
12.
Signs of dependent areasAdvantages for mother-country
Advantages for dependent area
12
13.
Group of countriesDeveloped
countries
Developing
countries
Transition
economy(?)
5
14.
Criteria:The nature of the
economy
The level of socio-economic
development
6
15.
The level of socio-economic developmentSectoral structure of GDP as an indicator of the
level of socio-economic development
The level and quality of life
GDP/GNI per capita
7
16.
Sectoral structure of GDP as an indicator of the level ofsocio-economic development of the country
High level development => tertiary sector
secondary sector =>manufacturing
Developing = > if tertiary - tourism, trade
if secondary - mining
2004:
1:2:3 %
USA: 2:23:75
Russia: 5:34:61
India: 23:26:52
2013:
1:2:3 %
USA: 1:20:79
Russia: 4:38:58
India: 17:26:57
8
17.
The level and quality of lifeLifespan
The incidence
Personal safety
Natural environment
Unemployment
Consumption
Human development index
Lifespan
The level of education
The level of GDP
9
18.
Rank2015
estimates
for 2014
1
2
3
4
5
6
6
8
9
9
11
12
13
14
14
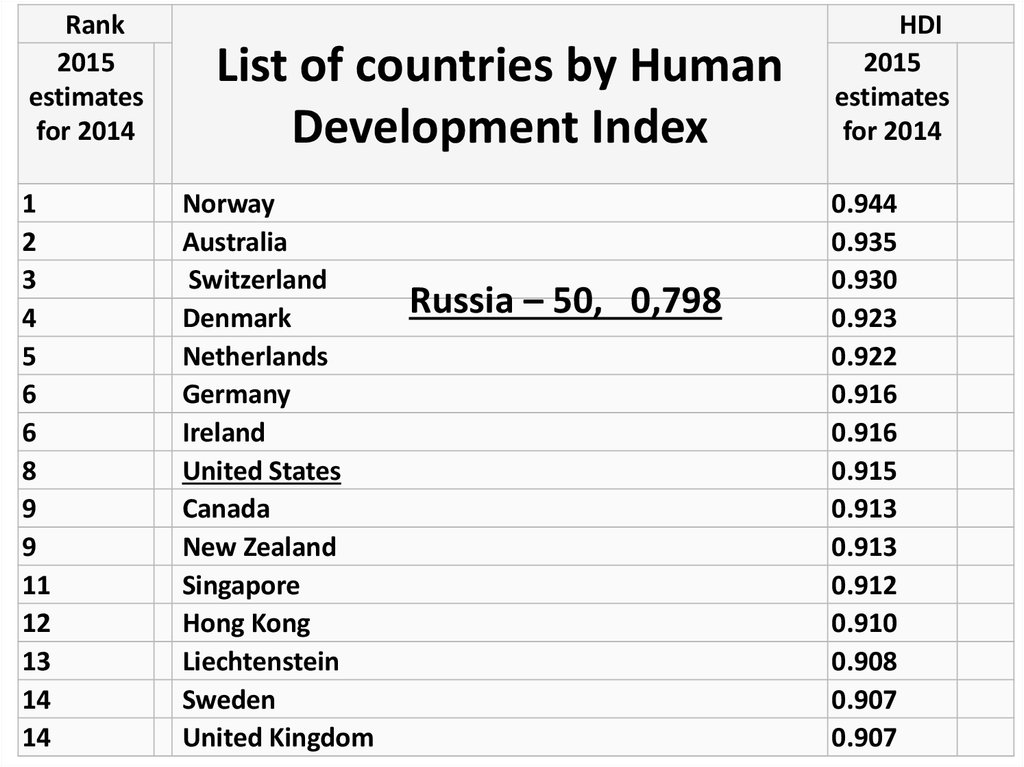
List of countries by Human
Development Index
Norway
Australia
Switzerland
Denmark
Netherlands
Germany
Ireland
United States
Canada
New Zealand
Singapore
Hong Kong
Liechtenstein
Sweden
ИРЧП 2013
United Kingdom
Russia – 50, 0,798
HDI
2015
estimates
for 2014
0.944
0.935
0.930
0.923
0.922
0.916
0.916
0.915
0.913
0.913
0.912
0.910
0.908
0.907
0.907
18
19.
over 0.9000.850–0.899
0.800–0.849
0.750–0.799
0.700–0.749
0.650–0.699 0.400–0.449
0.600–0.649
0.550–0.599 0.350–0.399
0.500–0.549 0.300–0.349
0.450–0.499
World map indicating the Human Development
Index (based on 2014 data, published on
December 14, 2015)
19
20.
Approximatecharacteristics of
developed
countries
1) GDP per capita is on average about 30
thousand dollars and it is growing =>
2) A high level of consumption
and investment and the standard
of living of the population as a
whole
3) Social support – the "middle class" who
share the values and basic foundations of
society
20
21.
Approximatecharacteristics of
developed
countries
4) Evolution towards domination of the industry and the trend
of transformation of the industrial economy in the postindustrial
5) Growing service sector , and the share of the population employed in it is leading
6) Technological progress has a significant impact on economic growth and the
structure of the economy
21
22.
Approximatecharacteristics of
developed
countries
7) Business structure is non-uniform. The leading role in the
economy belongs to powerful corporations – TNCs
8) The wide distribution of small and medium business as factor of economic and social
stability. This business employs up to 2/3 of the economically active population. In many
countries, small businesses provide up to 80% of new workplaces and affects the sectoral
structure of the economy
22
23.
Approximatecharacteristics of
developed
countries
9) The state of developed countries is an active participant in economic activity
23
24.
Approximatecharacteristics of
developed
countries
10) The openness to the world economy and the liberal organization of the
foreign trade regime
11) In the field of international labour migration, developed
countries act as the receiving party
24
25.
Countries with economies in transition:The former socialist countries of Central and Eastern Europe:
Albania, Bulgaria, Hungary, Poland, Romania, Slovakia, Czech
Republic, successors of the Socialist Federal Republic of
Yugoslavia — Bosnia and Herzegovina, Republic of Macedonia,
Slovenia, Croatia, Serbia and Montenegro;
The former Soviet republics, now the CIS countries:
Azerbaijan, Armenia, Belarus, Georgia, Kazakhstan, Kyrgyzstan,
Moldova, Russian Federation, Tajikistan, Turkmenistan,
Uzbekistan, Ukraine;
The former Baltic republics: Latvia, Lithuania, Estonia.
A particular challenge is the classification of China, since the
building of capitalism and, therefore, market relations is under the
leadership of the Communist party of China (CPC).
25
26.
Exemplarycharacteristics of
transition countries
The term "transition economy" is used to describe the transformation of the socialist
economy to the market one.
The transition to the market :
The deregulation of the economy, requiring privatization and stimulation of
development of private enterprises;
The development of non-state forms of ownership, including private ownership
on the means of production;
The formation of the consumer market and the saturation of its products
The experience of “shock therapy” is not a guarantee of a strong economy
26
27.
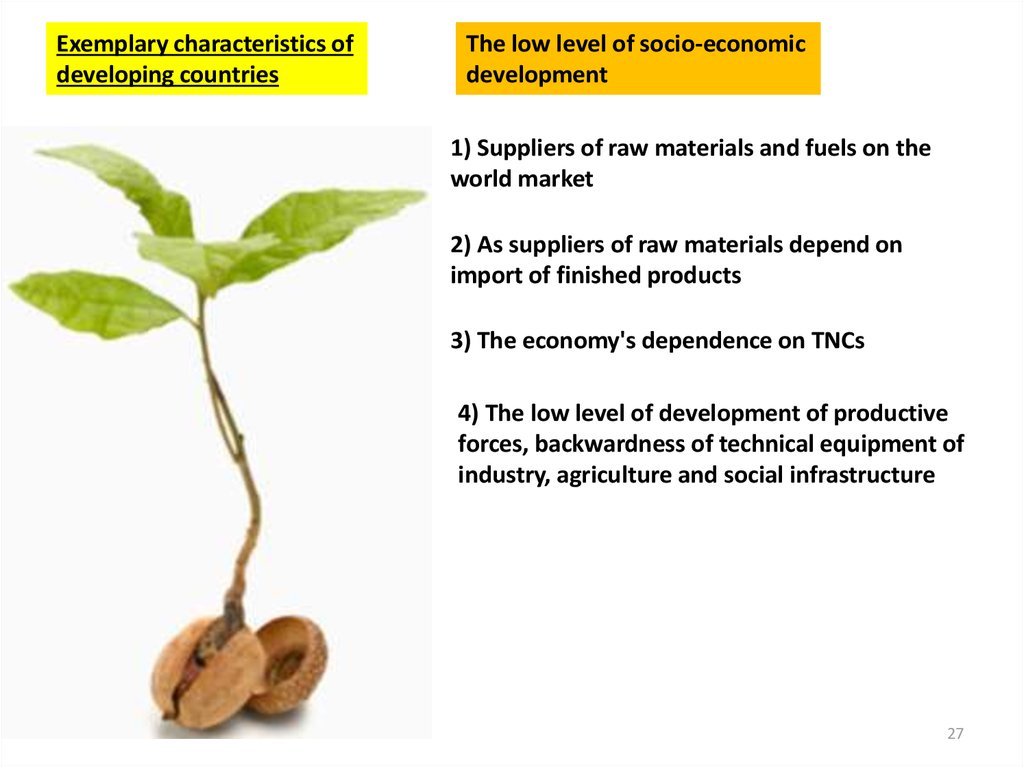
Exemplary characteristics ofdeveloping countries
The low level of socio-economic
development
1) Suppliers of raw materials and fuels on the
world market
2) As suppliers of raw materials depend on
import of finished products
3) The economy's dependence on TNCs
4) The low level of development of productive
forces, backwardness of technical equipment of
industry, agriculture and social infrastructure
27
28.
Exemplary characteristics ofdeveloping countries
5) The agricultural profile of the economy and the
share of the population employed in agriculture
6) Poverty, overpopulation, high
unemployment
7) Economic role of the state is large and along with the
traditional functions include:
The exercise of national sovereignty over natural
resources;
Control over foreign financial assistance;
Agrarian transformation associated with increased
agricultural production, creation of cooperatives, etc.;
28
29.
The classification of theInternational Monetary Fund
2 groups of countries
«Industrialized countries»
«Other emerging market and
developing countries»
Major industrialized country,
or "Big seven"
Euro area countries
Australia
Austria
Belgium
Germany
Greece
Denmark
Ireland
Spain
Italy
Canada
Netherlands
New Zealand
Norway
Portugal
United Kingdom
USA
Finland
France
Switzerland
Sweden
Japan
Cyprus
Czech Republic
Iceland
Israel
South Korea
Luxembourg
Malta
Singapore
Slovakia
Slovenia
+ Hong Kong
Taiwan
The Vatican
Faroe Islands
Bermuda
Liechtenstein
Monaco
San Marino
Andorra
29
30.
Major industrializedcountry,
or "Big seven"
?
11.4% of the
population
50% of the WGDP
42,3% of the
global trade, PPP
Countries
GDP
GDP per capita
Export
Population
USA
$18.57 trillion (2)
$57,400 (20)
$1.471 trillion (2)
326,625,791 (3)
Great Britain
$2.786 trillion (10)
$42,500 (38)
$412.1 billion (10) 64,769,452 (22)
Canada
$1.682 trillion (18)
$46,400 (35)
$390.1 billion (11) 35,623,680 (38)
Japan
$5.238 trillion (5)
$41,300 (42)
$641.4 billion (4)
126,451,398 (10)
Italy
$2.235 trillion (13)
$36,800 (51)
$436.3 billion (9)
62,137,802 (23)
France
$2.734 trillion (11)
$42,300 (39)
$489.1 billion (6)
67,106,161 (21)
Germany
$3.98 trillion (6)
$48,100 (31)
$1.283 trillion (3)
80,594,017 (19)
30
31.
3132.
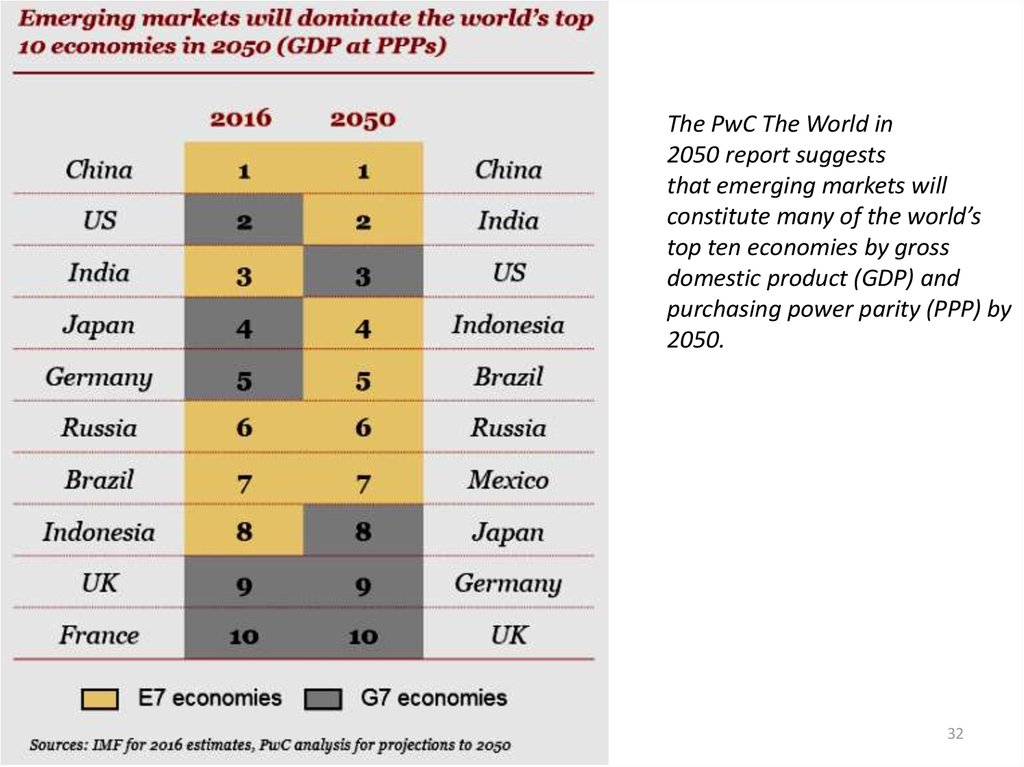
The PwC The World in2050 report suggests
that emerging markets will
constitute many of the world’s
top ten economies by gross
domestic product (GDP) and
purchasing power parity (PPP) by
2050.
Тимофеева А.А. 2018 ©
32
33.
The PwC report also looksat the fastest growing
economies between 2016
and 2050, which include
frontier markets by
today’s definition.
Тимофеева А.А. 2018 ©
33
34.
Тимофеева А.А. 2018 ©34
35.
Тимофеева А.А. 2018 ©35
36.
Challenges for policymakersProtectionism
Benefits of globalisation equity
Green technologies
Тимофеева А.А. 2018 ©
36
37.
Opportunities for business :Mature emerging markets (costs, consumers, B2B)
Тимофеева А.А. 2018 ©
37
38.
«Other emerging market and developing countries»146 countries, 85% of the population, 60% of the WGDP, 65% of world trade
Azerbaijan
Albania
Algeria
Angola
Argentina
Armenia
Afghanistan
Bangladesh
Belarus
Benin
Bulgaria
Bolivia
Bosnia and Herzegovina
Botswana
Brazil
Burkina Faso
Burundi
FYR Macedonia
Hungary
Venezuela
Vietnam
Haiti
Ghana
Guatemala
Guinea
Honduras
Hong Kong SAR
Georgia
Democratic Republic
Of the Congo
Dominican Rep.
Mozambique
Moldova
Mongolia
Namibia
Nepal
Niger
Nigeria
Nicaragua
Egypt
Zambia
Zimbabwe
Yemen
Israel
India
Indonesia
Jordan
Iraq
Iran
Kazakhstan
Cambodia
Cameroon
Kenya
China
Colombia
Korea
Costa Rica
Côte d'ivoire
Kuwait
Kyrgyz Republic
Lao PDR
Latvia
Lesotho
Liberia
Lebanon
Libya
Lithuania
Madagascar
Malawi
Malaysia
Mali
Morocco
Mexico
UAE
Oman
Pakistan
Panama
Papua New Guinea
Paraguay
Peru
Poland
Republic Of The Congo
Russia
Rwanda
Romania
Salvador
Saudi Arabia
Senegal
Serbia
Singapore
38
39.
Sub-group "Other emerging market and developing countries"Criteria:
a) exporters of liquid fuel;
b) exporters of other raw materials;
c) exporters of industrial finished products;
d) exporters of services;
e)financial criteria: countries export capital and import of capital;
f)countries not exporting oil
39
40.
The classification of the world BankGNI per capita
3 groups:
Countries with low income
Crane middle-income
Countries with high income
Countries with above-average income
Country lower middle income
The relationship between poverty, child
mortality and economic performance
40
41.
207 countriesgroup
The per capita income,
dollars.
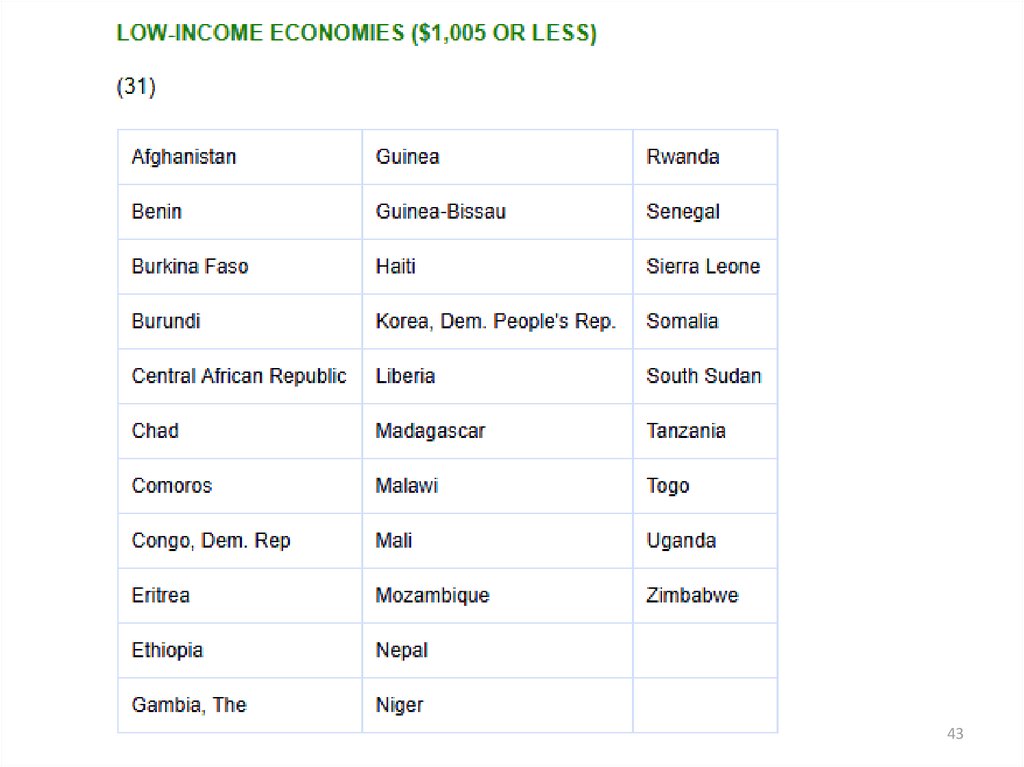
Countries with low income
< $1,005 (31)
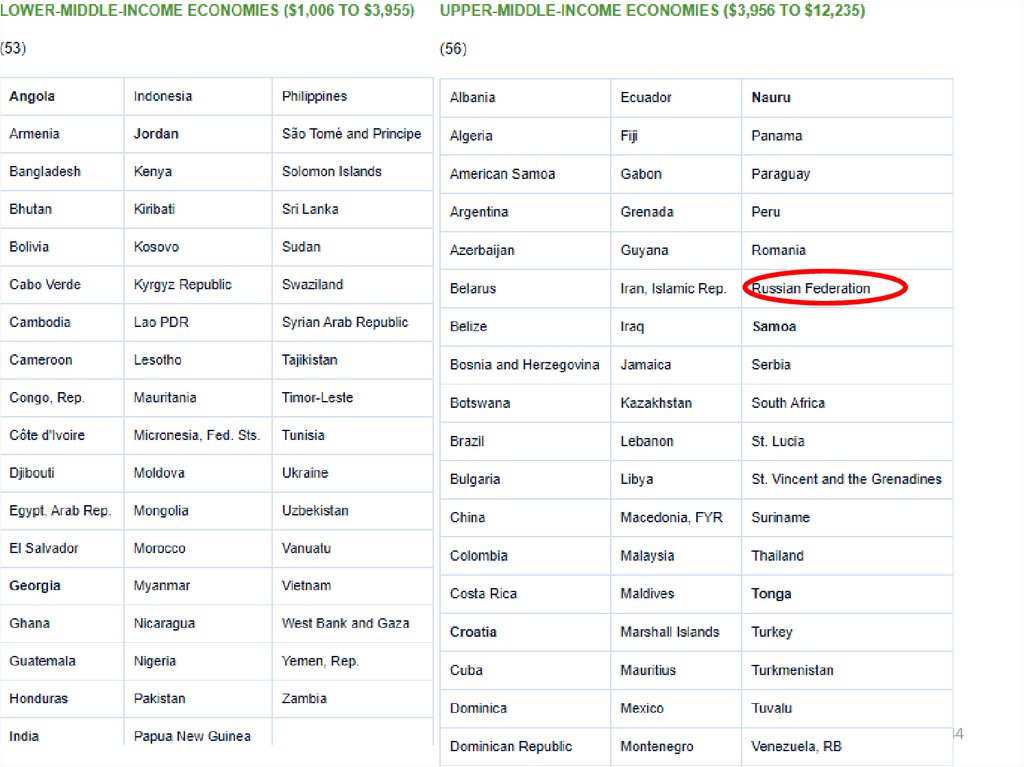
Countries with lower middleincome
$1,006–3,955 (53)
Countries with upper-middle
income
$3,956–12,235 (56)
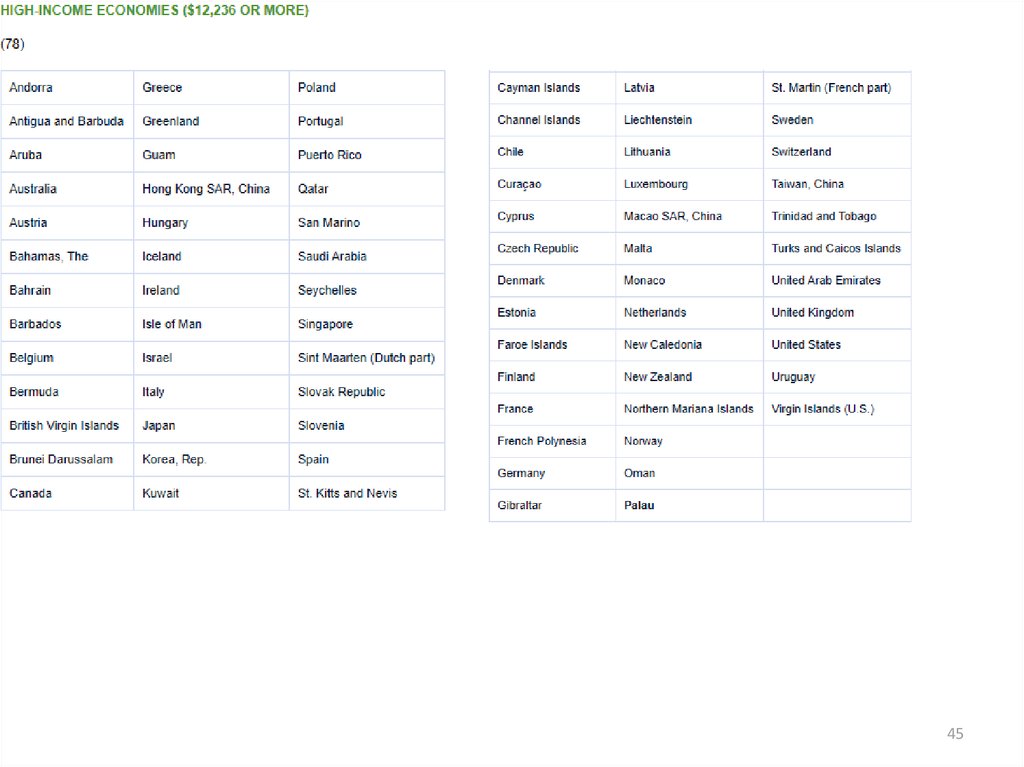
Countries with high income
> $12,236 (78)
41
42.
The state of external debtPoor countries with largest external debt
Countries with moderate debt
Countries with a small debt
Largest external debt
80% of the GNI
220% for export
Moderate debt
>60%
42
43.
4344.
4445.
4546.
4647.
201547