


")


")


")
")

")


 english
Similar presentations:


")
Sverdlovsk region
1. Sverdlovsk region
by Astakhova Polina, IBS, 53052. Sverdlovsk region
3. Reasons to invest into Sverdlovsk Region
1. Stable Financial Position of the RegionCredit rating from Standart&Poor’s agency :
BB, stable outlook, 2009
2. Business-friendly climate
№ 3 among «Best Russian cities for business» according to Forbes’ survey of 2010
3. Active foreign economic activities
125 countries – trade partners of Sverdlovsk region
4. Stable position of industry
3
4. Share of the Sverdlovsk Region in Russia’s overall industrial sector
4Share of the Sverdlovsk Region in Russia’s
overall industrial sector
5. GRP of the Sverdlovsk region
5GRP of the Sverdlovsk region
million rub
1800000
1600000
1400000
1200000
million rub
1000000
800000
600000
400000
200000
0
2011
2012
2013
2014
2015
6. The structure of the gross regional product of the Sverdlovsk region (2014)
6The structure of the gross regional product of
the Sverdlovsk region (2014)
7. SWOT analysis
7SWOT analysis
Strengths: rich resource base, transport
development, large domestic market, largest
regional energy systems
Weaknesses: deficit of certain groups of workers,
high depreciation of fixed assets, high energy
consumption for the production of unit of product,
low demand for innovations, harm for the
enviroment, high transport costs
8. SWOT analysis
8SWOT analysis
Options: import substitution, cooperation with AsiaPacific region, modernization of transport systems,
inter-regional cooperation, attracting federal and
private investment to the region
Threats: depletion of resource base, increased interregional competition, possible change if world prices
for metals and hydrocarbons, reduction of the
population of working age
9. Production index of Sverdlovsk region (mln rub)
9Production index of Sverdlovsk region (mln rub)
2011
2012
2013
2014
2015
Mining
51895
28899
29385
25215
27041
Manufacturing
359865
402241
416010
450701
541447
Production and
distribution of
electricity, gas and
water
60478
59160
59939
71214
71328
Total
472238
490300
505334
547130
639816
103,8
103,06
108,3
116,9
% change
10. The amount of work performed in construction sphere
10The amount of work performed in construction
sphere
120000
100000
80000
million rub
% change to the previous
year
60000
40000
20000
0
2010
2011
2012
2013
2014
11. Retail trade turnover
11Retail trade turnover
1200000
1000000
800000
600000
400000
200000
0
billion rub
% change to the previous
year
12.
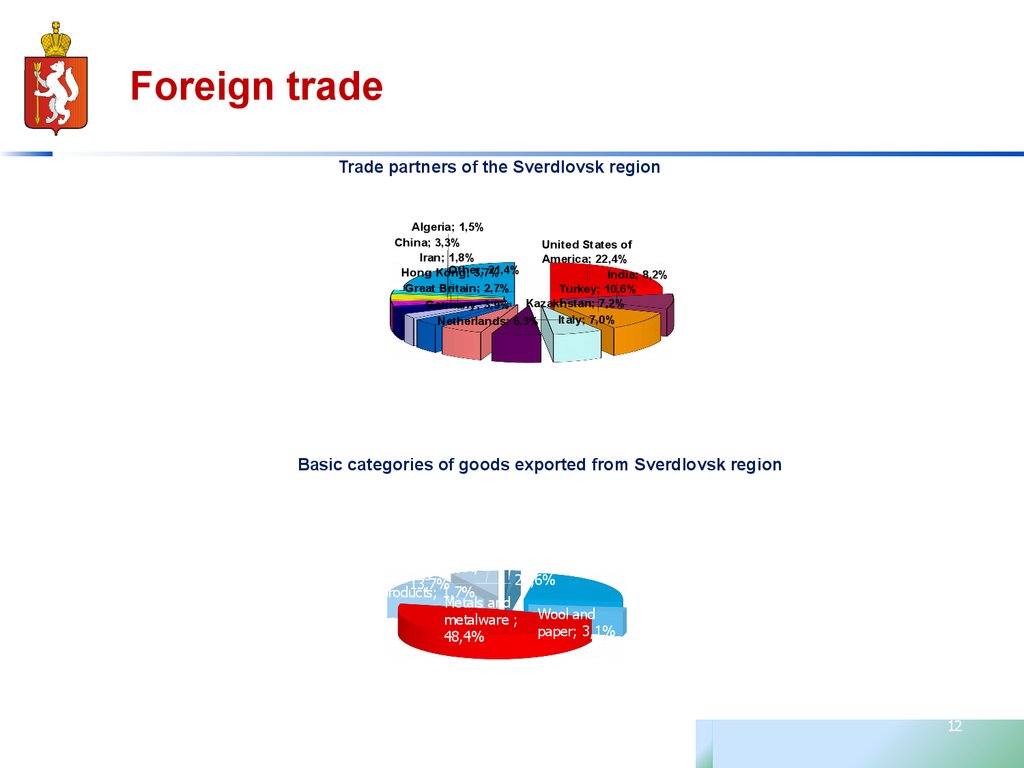
Foreign tradeTrade partners of the Sverdlovsk region
Algeria; 1,5%
China; 3,3%
Iran; 1,8%
Other;
21,4%
Hong Kong;
3,7%
United States of
America; 22,4%
India; 8,2%
Great Britain; 2,7%
Turkey; 10,6%
Germany; 3,9% Kazakhstan; 7,2%
Italy; 7,0%
Netherlands; 6,3%
Basic categories of goods exported from Sverdlovsk region
Machinery, Other goods;
Chemical
equipment 7,8%
production;
production;
Minerals
24,6%
Food ; 0,7%
13,7%
products; 1,7%
Metals and
metalware ; Wool and
paper; 3,1%
48,4%
12
13. Investments including FDIs
13Investments including FDIs
billion rub
400
350
300
250
billion rub
200
150
100
50
0
2000
2011
2012
2013
2014
2015
14. Investments including FDIs in mln USD
14Investments including FDIs in mln USD
12000
mln. USD
10000
8000
6000
4000
2000
0
1999
2000
2001
2002
2003
2004
2005
2006
2007
2008
2009
15. Production of agricultural sector
15Production of agricultural sector
billion rub
90
80
70
60
billion rub
50
40
30
20
10
0
2000
2011
2012
2013
2014
2015
2016
16. Consumer price index (in % to the previous year)
16Consumer price index (in % to the previous
year)
% to the previous year
116
114
112
110
108
106
104
102
2009 2010 2011 2012 2013 2014 2015 2016
% to the previous year
17. Average salary per person (2000; 2011-2015)
17Average salary per person
(2000; 2011-2015)
35000
rub
2015, 30690,8
2014, 29492,2
30000
2013, 27608,2
2012, 25138,8
25000
2011, 22179,2
20000
15000
10000
5000
2000, 2273,8
2000
2011
2012
2013
2014
2015
0
18. Real average income of population
18Real average income of population
rub
40000
35000
30000
25000
rub
20000
15000
10000
5000
0
2000
2011
2012
2013
2014
2015
19. Unemployment. Average number of unemployed per 1 year (th people)
19Unemployment. Average number of
unemployed per 1 year (th people)
th people
250
200
150
th people
100
50
0
2000
2011
2012
2013
2014
2015
20. Reasons to invest into Sverdlovsk Region
5. Developed transport-logistic infrastructureThe main city of the region –
Ekaterinburg ranks third among the
transport centers of Russia:
6 federal autoroads,
7 main railway roads,
airport “Koltsovo”
Developed motorways network
International transport corridor «West – East»
Ekaterinburg ring-road
Federal motorway corridors
Koltsovo international airport hub
Delivers services for international and domestic
long-distance air traffic
Sverdlovsk railway
The main transit and handling center for freight and
passenger flows going in «Europe-Asia direction»
20
21.
21Welcome to Sverdlovsk region!