


 chemistry
Similar presentations:


")
Иммунохимические методы детекции
1. Иммунохимические методы детекции
2.
3.
4.
5.
6.
7.
8.
9.
10.
11.
12.
13.
14.
15.
16.
17.
18.
19.
20.
21.
22.
23.
24.
25.
26.
27.
28.
29.
30.
31.
32.
Перенос антигеновв буферном растворе
Влажный или полусухой перенос
антигенов на мембрану
33. How it Works
• Traditional western blotting takes a variety of formats and reagent conditions toaccomplish. It’s a passive process!
• SNAP i.d. actively drives reagents through the membrane to increase the quality
of the blots and increase the speed of immunodetection!
• It’s a combination of reagent flows and concentrations
Vs.
Standard ‘rocking’ of
reagents
Actively drive reagents with
vacuum flow
34. How it Works – reagent flows
Reagents penetrate more of the membrane 3D structurewhere the proteins are blotted.
Result = Increase quality of the blot in a SNAP!
Standard
Gentle Rocking
Reagents diffuse
slowly into membrane
Reagents rapidly
driven into membrane
Vacuum
35. Standard vs. SNAP i.d. - concentrations
Standard vs. SNAP i.d. concentrationsConcentrations
• Blocking concentrations are limited to prevent clogging of blot holder
• Antibody concentrations are increased to speed up reaction kinetics
Step
Standard
Protocol
SNAP i.d.
Blocking
5% NFDM
0.5% NFDM
Primary Antibody
1X
3X in 1/3
volume
(same quantity)
Washing (3x)
1X
1X
Secondary
Antibody
1X
3X in 1/3
volume
(same quantity)
Washing (3x)
1X
1X
36. Compatible Blocking Reagents and Recommended Concentrations
How it Works – reagent flowsBlocking
• Efficient coverage of membrane which yields higher sensitivity
– Can use 1/10th-1/100th less concentrated blocking solution to minimize
overblocking
• Actively driven vacuum flow coats inner surfaces of membrane in 20 sec
Standard
GAPDH
1
2
3
4
5
6
5%NFDM
7
8
1
2
3
4
5
6
0.5% NFDM
7
8
1
2
3
4 5
6
7
8
0.1% NFDM
1
2
3
4
5
6
7
0.05% NFDM
8
37. How it Works – reagent flows
How it Works: Time savingsWestern Blotting Protocol
SNAP i.d.™
Sample
Prep
Standard
Electrophoresis
Membrane
Transfer
Blocking
1° Antibody
Addition &
Incubation
1 Hr
1 Hr-overnight
Blocking
Antibody
Addition
Detection
Washing
2° Antibody
Addition &
Incubation
Washing
15 min
1 Hr
15 min
4 Hrs
Vs.
20 sec
10 min
1 min
10 min
1 min
22 min
38. How it Works: Time savings
39.
40.
41.
Fig. 1. The diffusion dependence ofsolid-phase immunoassay and
methods used to reduce
its influence. (A) The effect of
vortexing (shaking) microtiters wells
on establishment of
equilibrium (from ref. 13). (B)
Illustration of the physical effect of
vortexing microtiter wells
(rotary agitation) on the distribution of
the fluid phase relative to the solid
phase. The fluid
phase is depicted by wavy lines. (C)
Alternative methods of confining the
reaction volume to
within close proximity to the solid
phase bearing the immobilized
reactant.
42.
43.
44.
45.
46.
47.
48.
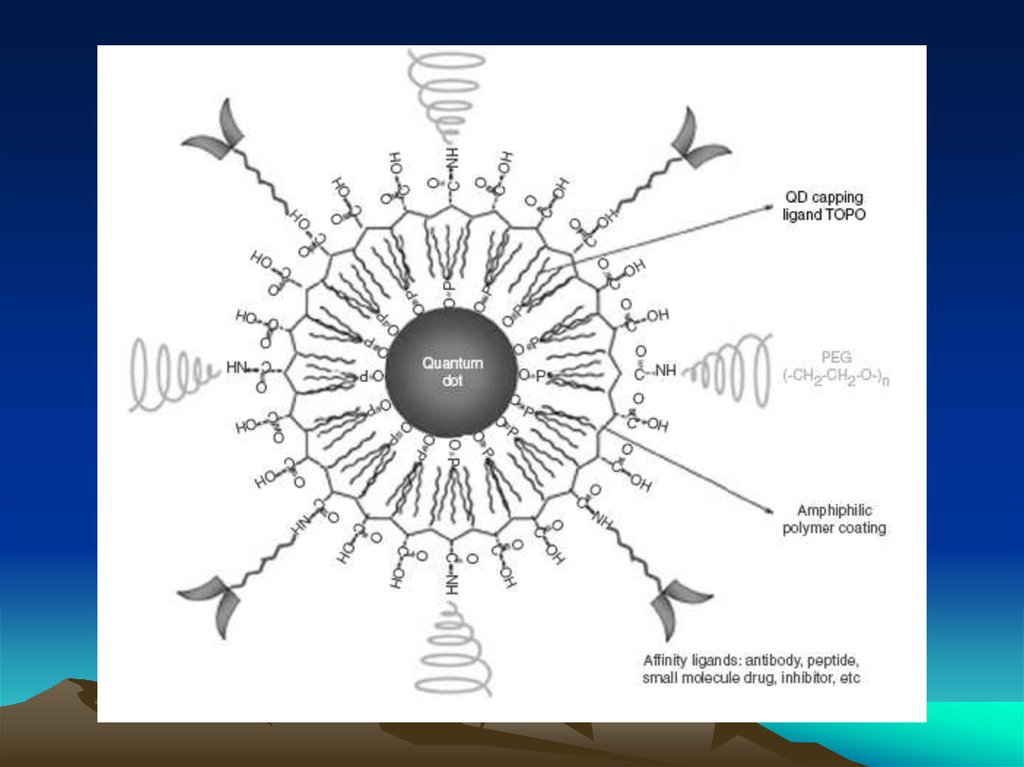
Методы коньюгации – иммобилизации антителна квантовых наночастицах
49.
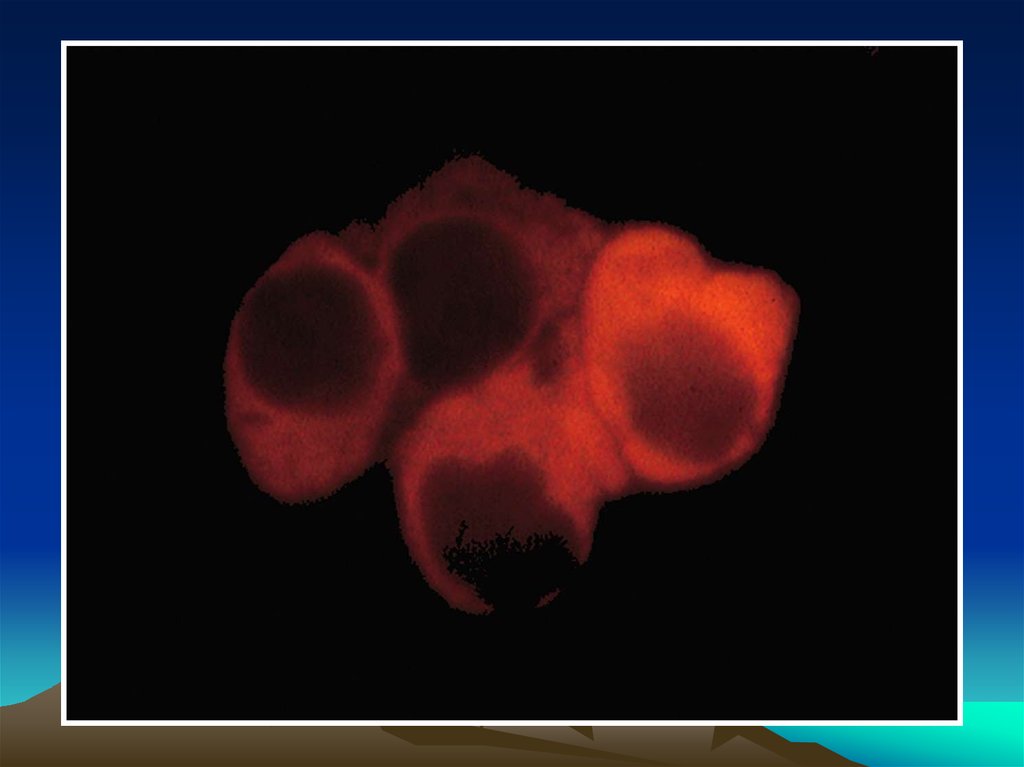
Иммунофлюоресцентный анализ среза тканис использованием антител,
меченных квантовыми наночастицами
50.
51.
52.
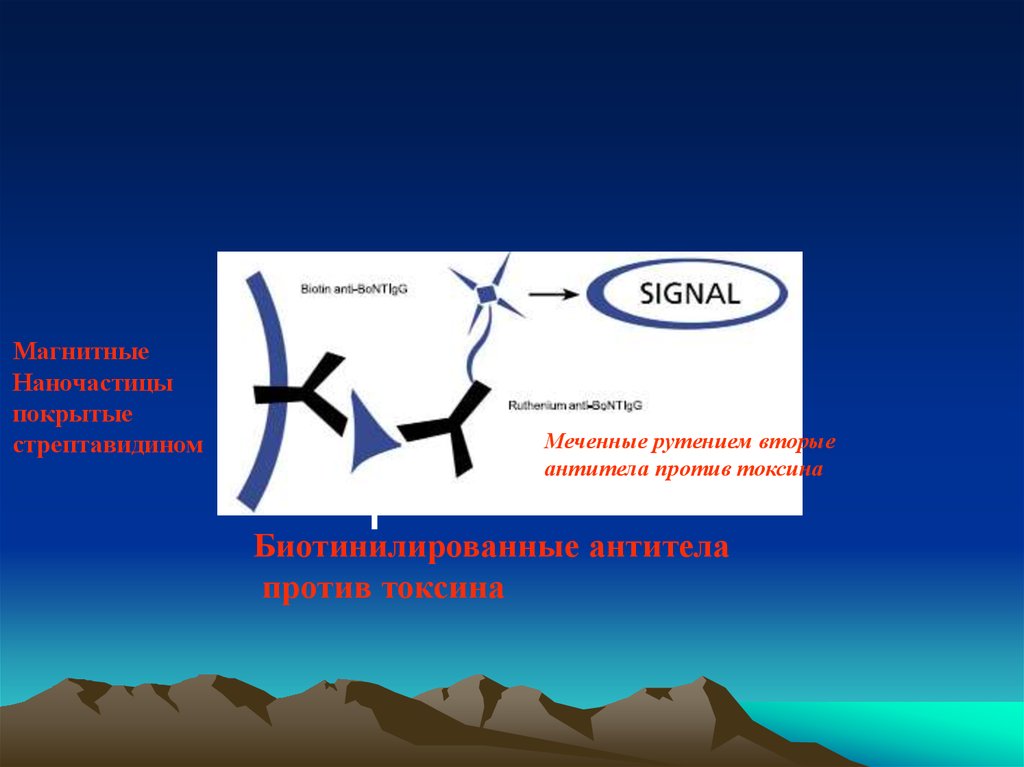
МагнитныеНаночастицы
покрытые
стрептавидином
Меченные рутением вторые
антитела против токсина
Биотинилированные антитела
против токсина
53.
Чиповая технологияс использованием сандвич варианта ИФА
и стрептавидин биотиновой ститемы
Иммобилизация первых антител
на чип, предпочтительнее
ориентированная посадка антител
Захват антигена (зеленые шарики)
антителами
Вторые специфические антитела,
меченные биотином,
взаимодействуют с антигеном
Создание стрептавидинбиотиновых комплексов
Образование комплекса стрептавидин-тирамид или
струптавиди Cy3, которые
детектируются
спектрофотометрически
54. Чиповая технология с использованием сандвич варианта ИФА и стрептавидин биотиновой ститемы
55.
Структура нейротоксинов клостридий имолекулярные мишени
Претеолитическое
расщепление
Молекула токсина
предшественника
Молекулы - мишени бактериальных
нейротоксинов клостридий
Двуцепочная молекула
токсина в активной форме
Созревание токсина и переход
его в активную форму
TeNT
Синаптические
визикулы
Нейрональная
мембрана
Стрелками обозначены места
расщепления эндопротеиназой токсина
мембранных белков синаптических
мембран.
56. Структура нейротоксинов клостридий и молекулярные мишени
Олигонуклеотидные прайменыРецептор
токсина
Липосомы, содержащие
на поверхности
рецептор токсина
и фрагменты ДНК внутри
Определяемый токсин
Антитела
Поверхность иммунопланшета
Липосомы-ПЦР иммуноанализ биотоксинов
57.
Схема иммунохроматографическогоанализа
Контрольные
антитела
Тест антитела
Реагент для детекции
комплексКолоидное
золото-кроличьи антитела
против Токсина
Тест антитела
Контрольные
антитела
Направление потока
Место нанесения образца
Зона коньюгата
АдгезионнаяАдсорбционная
мембрана прокладка
58. Схема иммунохроматографического анализа
59.
60.
61.
62.
63.
64.
65.
66.
67.
68.
69.
70.
71.
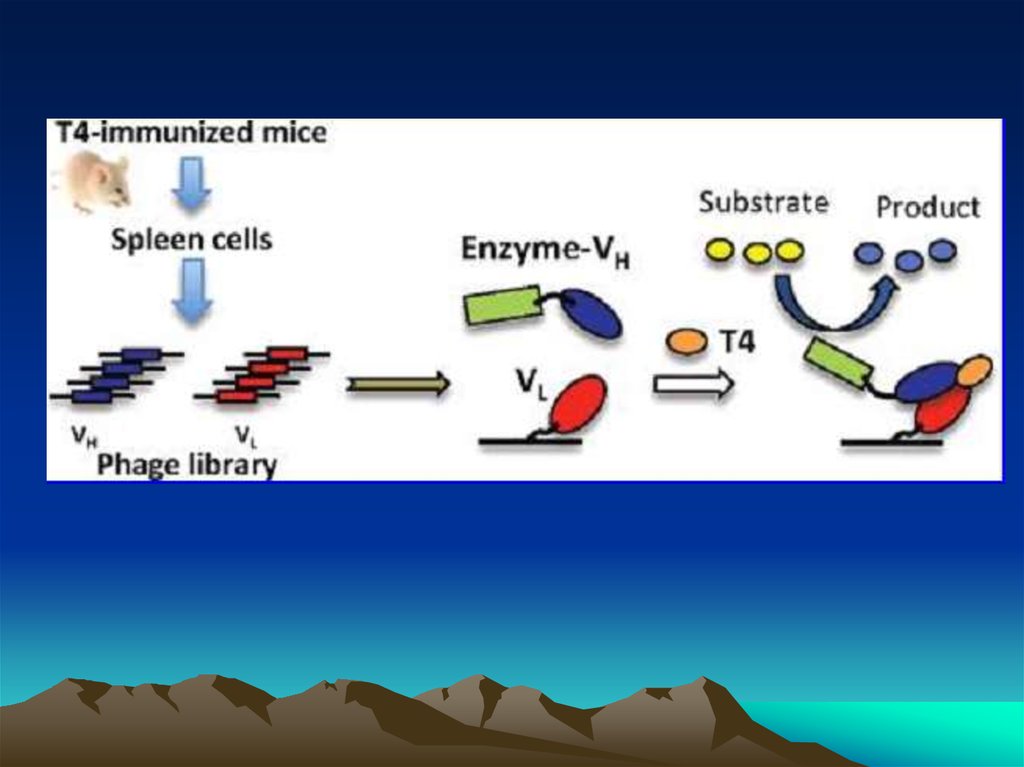
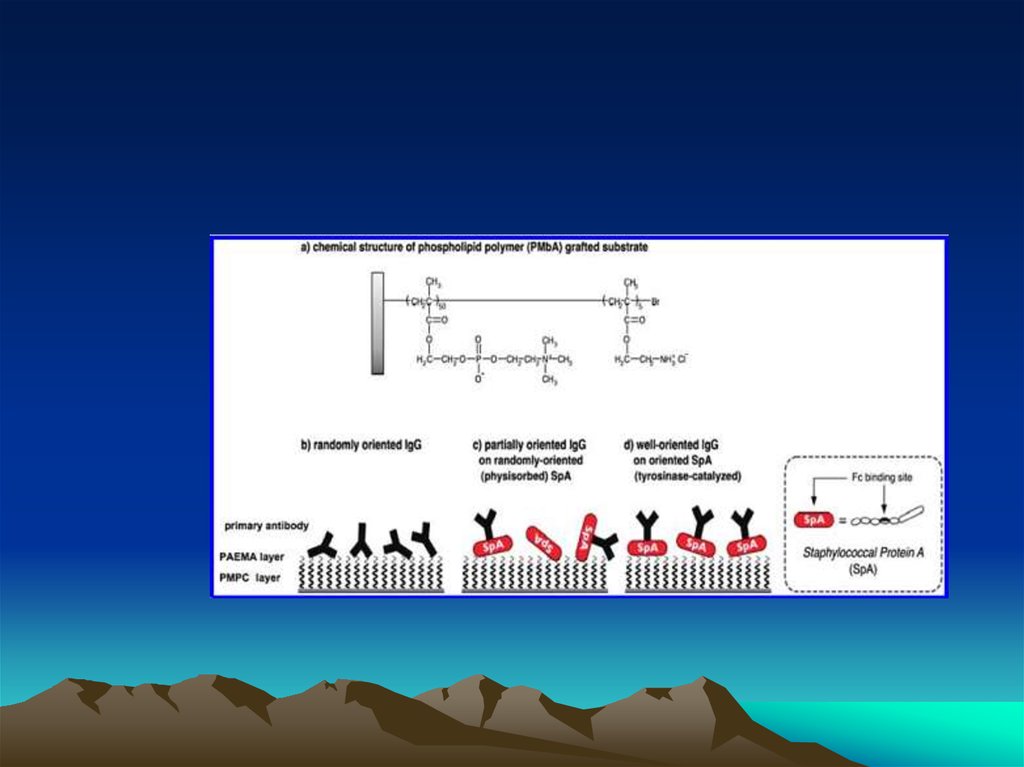
Conjugated to the amino group carrying platform using tyrosinase.To assess the orientation of immobilized antibodies, antigen binding capacity was
measured with four di ere antantigen shaving molecular weight sranging from 66 to
330kDa. Forsmall antigens like albumin and CRP, highly oriented antibodies recorded as
much as 1.8 ( 0.1 antigens per each immobilized antibody suggesting that at least 80% of
immobilized antibodies reacted with two antigens. The multivalent binding analysis
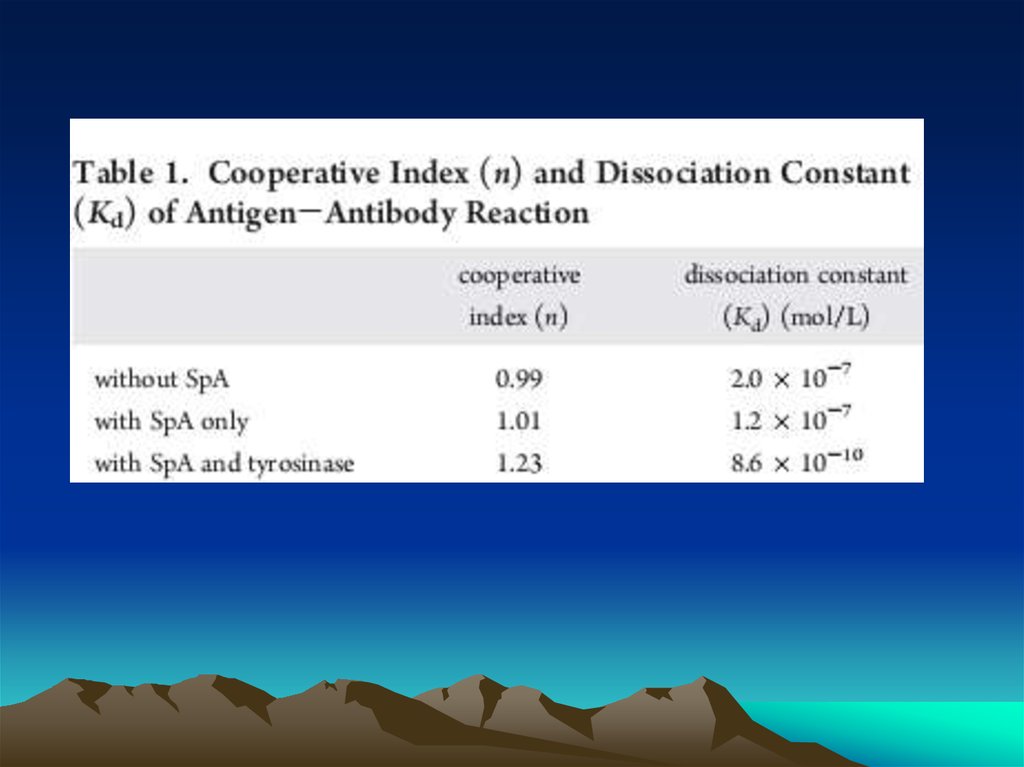
revealed that the oriented antibodies showed exceptionally strong a?nity for -10 antigens
(Kd =8.6 10 mol/L). This value was 100-fold
stronger than values for the partially
oriented and randomly oriented antibodies and is comparable to the reported Kd values of
the active antibodies. Bystrictlycontrolling orientation on an Antibiofoulingphospholipid
platform, we have demonstrated that antibodyorientation improves the binding a?nity and
the binding capacity of immobilized antibodies.
72.
73.
74.
75.
76.
Representative atomic force microscope images of self-assembled oligomeric DNA–STVconjugates (a) and DNA–STV nanocircles (b).
The nanostructured conjugates form the basis of powerful reagents for IPCR assays.
77.
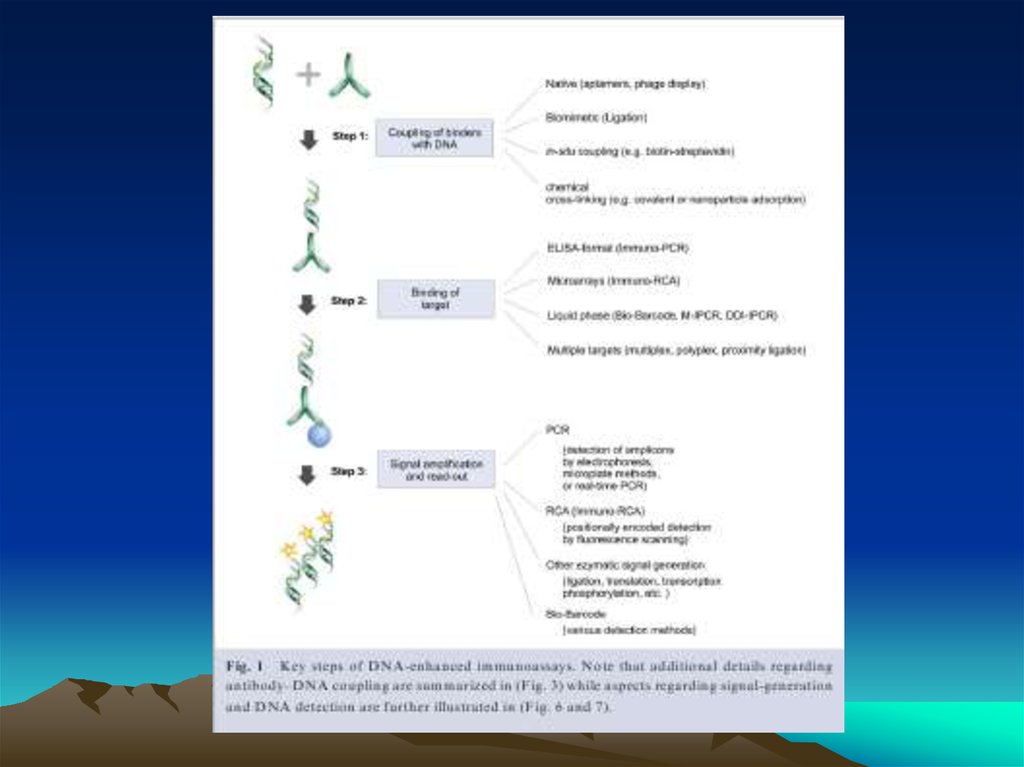
The evolution of immuno-PCR (IPCR): (A) the set-up of ELISAand IPCR is similar.
Instead of an enzyme marker, such as alkaline phosphatase (left),
IPCR uses ampli cation of attached DNA for signal generation
(right). (B) Different strategies for coupling antibodies and DNA:
in the initial version of IPCR2 a Streptavidin (STV)–protein A
chimeric fusion protein was used for tagging the detection
antibody with biotinylated DNA (I). In the universal IPCR protocol,
the signal generating complex is assembled in situ by
subsequent incubation steps of biotinylated detection antibody,
(strept-)avidin and biotinylated DNA; either using a nonbiotinylated primary and a species speci c secondary antibody
(II) or a directly biotinylated primary antibody (III). The
introduction of pre-assembled antibody–DNA conjugates takes
advantage of either species- or marker-speci c secondary
conjugates92 (IV) or direct conjugation of target-speci c
antibodies and DNA14 (V). Approaches such as phage display
mediated IPCR,44 tadpoles of antibodies and DNA,38 or native
chemical ligation introduce elegant ways of coupling antibodies
and DNA by circumventing arti cial modi cations such as biotin
and complex crosslinking chemistries (VI). The linkage of multiple
antibodies and DNA molecules with particles, as used in the biobarcode technology92 has led to polyvalent reagents, which allow
one to connect single antibody–antigen binding events to a
larger number of DNA markers (VII). (C) Comparison of the
multiple steps required for the in situ stepwise reagent assembly
of the classical universal IPCR approach with the simplicity of
speci c antibody–DNA conjugates. Note that each coupling step
requires optimization of reaction parameters and leads to a loss
in sensitivity.
78.
Typical results of immuno-PCR (IPCR)experiments. (A) Comparison of IPCR,
the
analogous conventional ELISA for the
detection of Rotavirus antigens.108
Note the high linearity and broad
dynamic range of IPCR. (B) Comparison
of different IPCR assay techniques for
the detection of human TNFa: the use of
target-speci c antibody–DNA
conjugates enables an increased
sensitivity. The dark and light blue bars
represent signals obtained by
sequential IPCR (see Fig. 3B III) and
direct IPCR with pre-assembled
antibody–
DNA conjugates (see Fig. 3B V),
respectively. The red curve represents
signals obtained in the analogous
ELISA.
79.
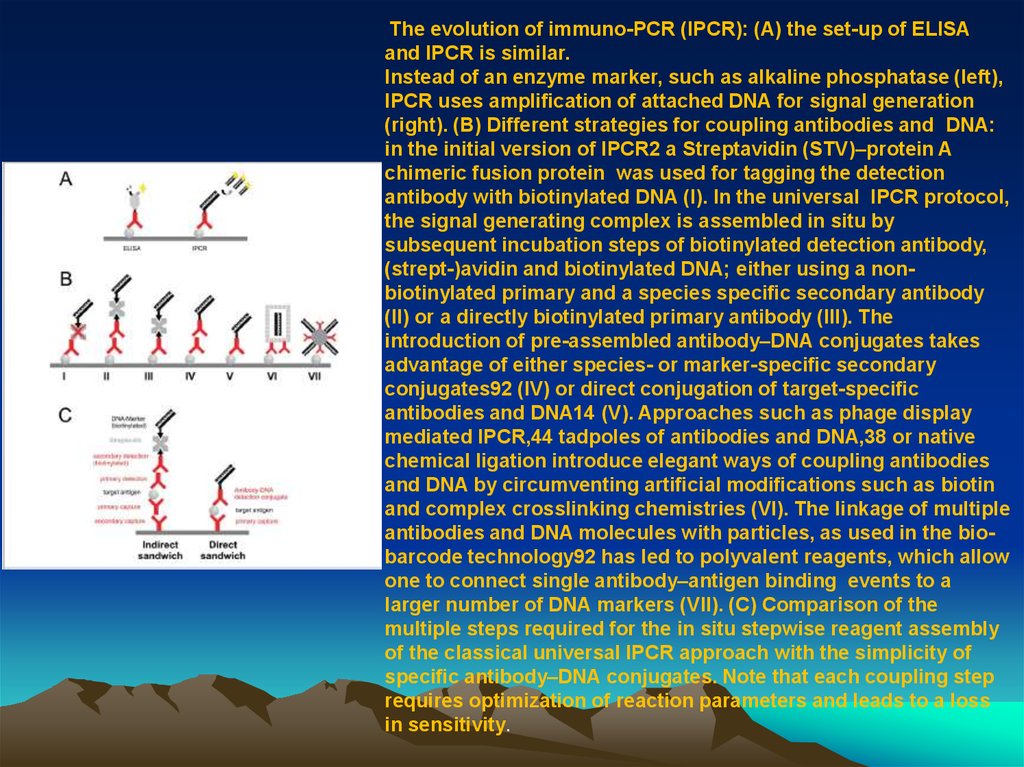
Statistical analysis of references reporting DNAenhanced immunoassays: (A) summary of detectionlimits reported. The majority of examples revealed a
maximum sensitivity in the 0.016 amol–16 amol range
(1000–100 000 molecules, respectively), thus
de ning the standard performance of the method.
Note that the broad detection range of about ≤10
molecules2,74,102 or single cells18 up to 1010
molecules in all cases involves a signi cant
improvement of the analogous ELISA.137,138 A
typical LOD is found at approx. 1000 olecules/sample,
which is in accordance with the expected theoretical
kinetics of immunoassays.13 (B) Overview of the Nfold improvement of conventional ELISA by the
analogous IPCR. The sensitivity enhancement varies
from 5-fold31 to up to 1 000 000 000- fold82,86
depending on the design and optimization state of
the assay as well as the performance of the
antibodies. The majority of studies reported a 100–
1000-fold improvement in LOD. (C) Overview of the
linear dynamic range of IPCR applications. While
conventional ELISA typically reveals a dynamic range
of two orders of magnitude in antigen oncentration,
IPCR shows a signi cantly broader dynamic range
(see also Fig. 5). In the majority of IPCR applications,
the dynamic range comprised about four orders of
magnitude.
80.
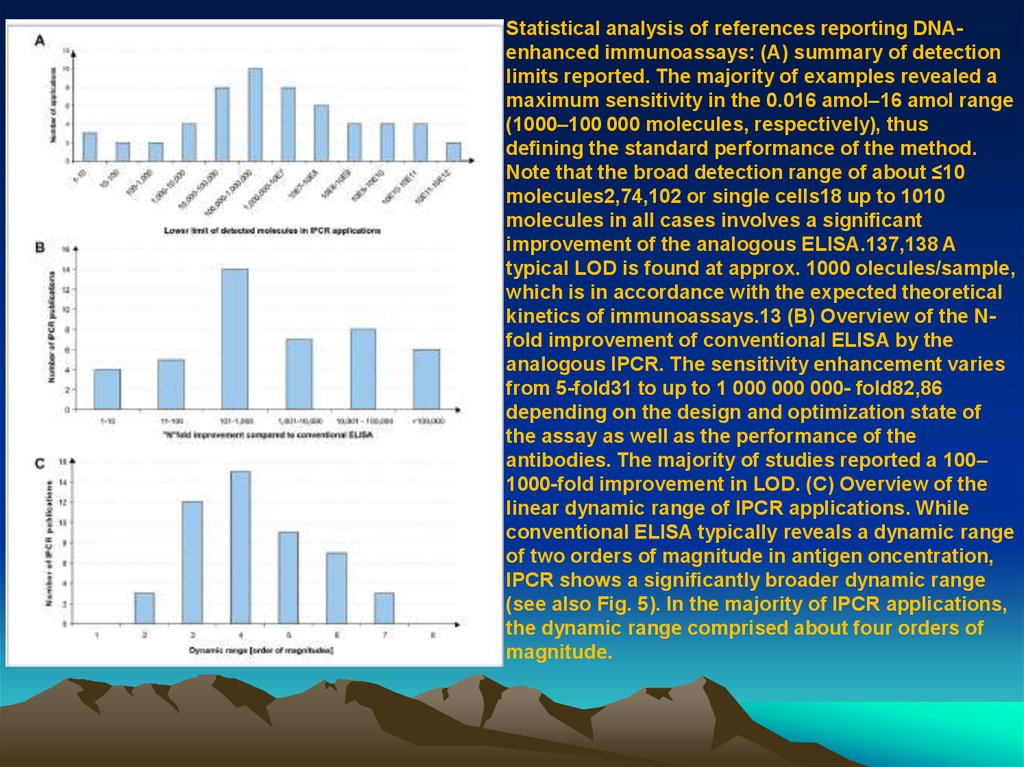
Comparison of the most prominent methods for thedetection and quanti cation of DNA amplicons
generated in DNA-enhanced immunoassays. (A)
Intercalation uorescence markers with increased
speci city for double-stranded DNA, such as
ethidiumbromide or SYBR greenTM, are used in gelelectrophoresis or real-time PCR analyses. Note that
for multiplex IPCR, it is necessary to separate
amplicons of different length by gel-ectrophoresis
while multiplex real-time detection can not be
performed using intercalation marks. (B) Different
types of sequence-speci c uorophore-labeled nucleic
acid probes, e.g. TaqManTM or ScorpionTM are
typically used for real-time quantitative PCR. During
elongation of primers, the probes are modi ed and
thereby, a uorescent signal is generated. (C & D)
Hybridization assays for sequence-speci c DNAdetection. Sensitivity can be increased by binding of
multiple uorophores to the ampli ed DNA by means
of hybridization of uorophore-labeled probes to
products of RCA (C) or PCR (D) processes. In the case
of immuno-RCA, the antibody–DNA–conjugate
remains intact during DNA ampli cation and thus, a
multitude of hybridization probes can bind to spots of
microarrays, containing the immobilized antigen. In
PCR-ELOSA
(D), hapten-labeled amplicons, generated during PCR,
are immobilized by means of surface-bound capture
oligonucleotides and subsequent detection is carried
out by using hapten- speci c antibody–enzyme
conjugates.
81.
82.
83.
84.
85.
Multiplex and polyplex assays for the detection of several antigens in a single sample:in multiplex assays, different antigens (a and b) are tagged with different DNA
sequences. Inpolyplex assays the sample is divided into small aliquots, each of which
is analyzed individually by a target speci c assay.
86.
87.
Schematic representing the flow of reactions involved in the immuno-PCRsignal amplification assay for detection of SEA and SEB. The Bead Retriever
facilitated recovery of magnetic beads during chemical reactions and SE
recovery during the assays.
88.
iPCR-SA assay detection of SEA (A) or SEB (B) spiked into tryptic soy broth atselect levels. Controls consisted of lowest dilution without added SEA or SEB
antigen (but processed accordingly), without SEA or SEB antibody, use of
water as a sample, and a blank well with PCR reagents only. Inset shows
overlapping melting curves of amplified products of all PCR-positive samples.
89.
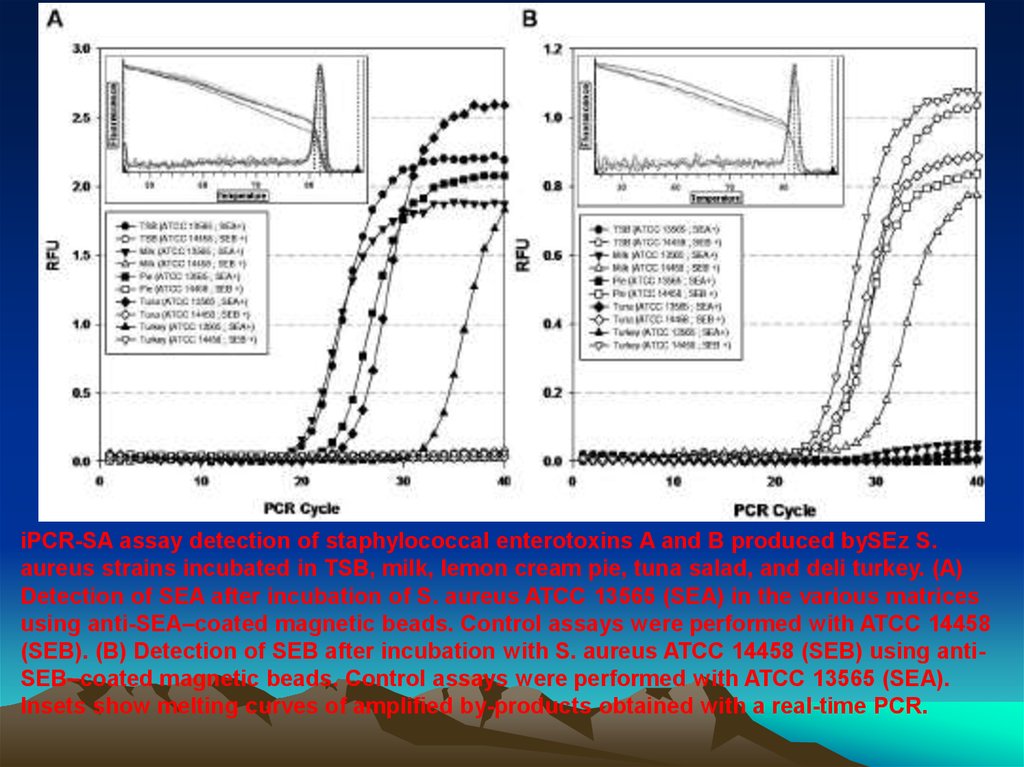
iPCR-SA assay detection of staphylococcal enterotoxins A and B produced bySEz S.aureus strains incubated in TSB, milk, lemon cream pie, tuna salad, and deli turkey. (A)
Detection of SEA after incubation of S. aureus ATCC 13565 (SEA) in the various matrices
using anti-SEA–coated magnetic beads. Control assays were performed with ATCC 14458
(SEB). (B) Detection of SEB after incubation with S. aureus ATCC 14458 (SEB) using antiSEB–coated magnetic beads. Control assays were performed with ATCC 13565 (SEA).
Insets show melting curves of amplified by-products obtained with a real-time PCR.