


 biology
Similar presentations:


G11.4A- Statistics: Standard Deviation, Error and t-test
1. G11.4A- Statistics: Standard Deviation, Error and t-test
CIE Biology JonesP497-500
Learning Objectives
11.2.4.11 explore patterns of modification variability
Success Criteria
1. Calculate standard deviation and error of data.
2. Explain results of standard deviation and error bars.
2.
3.
4.
5.
SamplePopulation
6.
Do you remember? Ecology Practical Term1? T-test and Standard Deviation?
Leaf tip to base
TASK 3 – Leaves on a Tree and t-test data analysis.
Use the t-test to compare the means of two samples of measured data to see whether they are significantly different. The t-test will tell you whether there is a significant difference
between the means of two samples or not.
Leaf tip to base
1 mean of sample 1
2 mean of sample 2
n1 is number subjects in sample 1
n2 is number subjects in sample 2
s1 is the standard deviation of sample 1
s2 is the standard deviation of sample 2
1 mean of sample 1
2 mean of sample 2
n1 is number subjects in sample 1
n2 is number subjects in sample 2
s1 is the standard deviation of sample 1
s2 is the standard deviation of sample 2
1. Go to one of the trees as directed by your teacher.
2. Select one branch. Measure the leaf length from tip to base, and record the length of 10 leaves on the outer portion of the branch, and 10 leaves on the inner portion of the branch.
T-test calculations will be done in the classroom.
7.
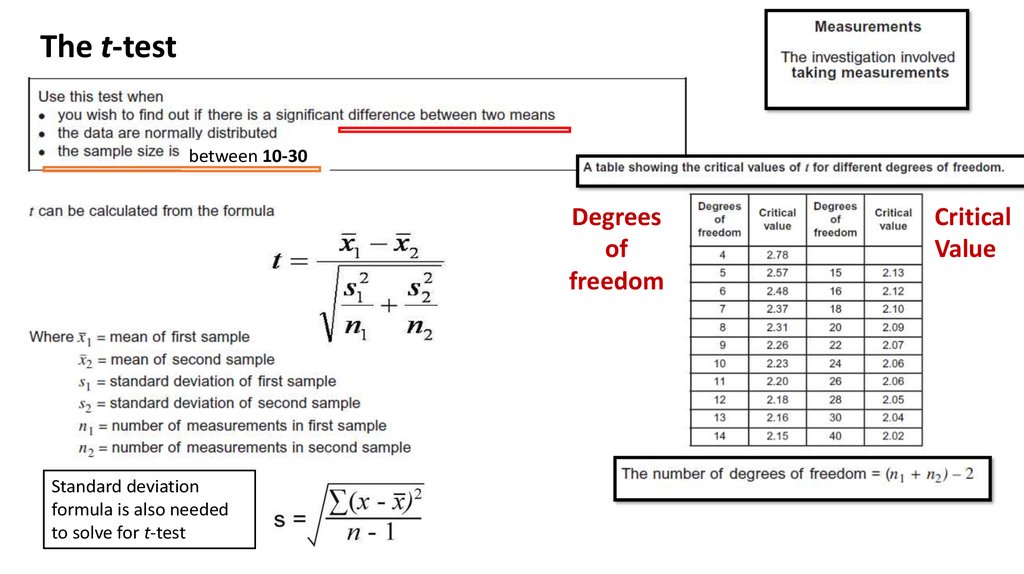
The t-testbetween 10-30
Degrees
of
freedom
Standard deviation
formula is also needed
to solve for t-test
Critical
Value
8.
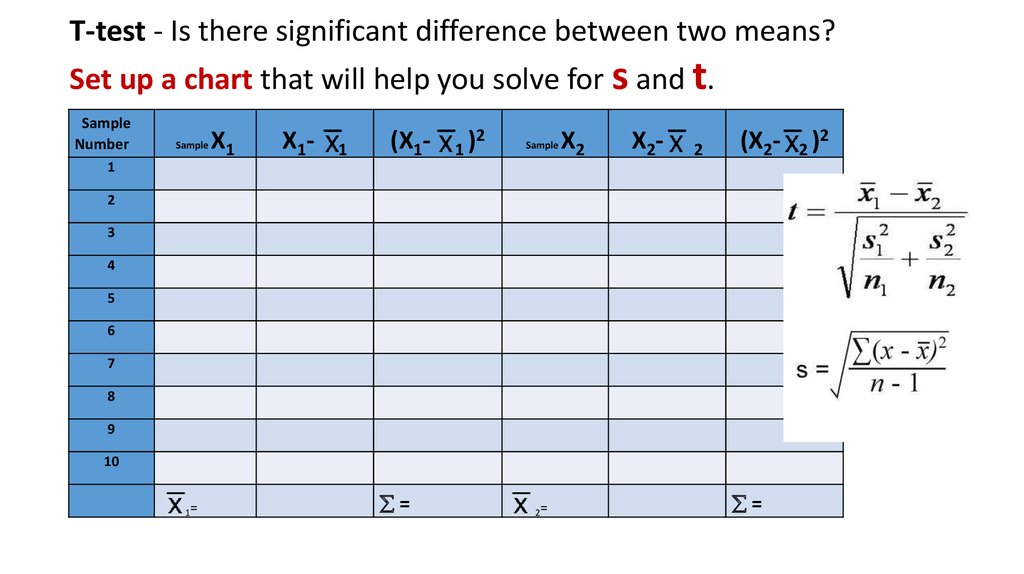
T-test - Is there significant difference between two means?Set up a chart that will help you solve for s and t.
Sample
Number
Sample
X1
X1-
1
(X1-
1)
2
Sample
X2
X2-
2
(X2-
1
2
3
4
5
6
7
8
9
10
1=
=
2=
=
2)
2
9. Standard Deviation
Standard deviation will give the +/-A graphical expression of the distance between numbers.
error value of a measurement.
10.
FemaleMale
21
3
6
27
15
10
1.6
3.2
13
7
mean
SD
2 x SD
Mean + (2 x SD)
Mean - (2 x SD)
There is no overlap in the (±2 SD) bars.
This indicates that the differences in the
means the size of male and females is
unlikely to be due to chance.
Describing the results
We can draw a bar chart of the mean and plot the ± 2
Standard deviations from the mean and look at the
overlap of the bars.
If there is NO overlap
of the error bars
overlap, then there is
IS significant
difference between
the two samples.
Error
Bars
+/-
Note: You cannot
say how ‘unlikely’
this is due to
chance – just that
it is unlikely!
11.
meanSD
2 x SD
Mean + (2 x
SD)
Mean - (2 x
SD)
DATA A (mm)
DATA B (mm)
32.3
9.3
18.6
50.9
48.8
1.7
2.4
51.2
13.7
46.4
Describing the results
We can draw a bar chart of the
mean and plot the ± 2
Standard deviations from the
mean and look at the
There is an overlap in the
(±2 SD) bars.
This indicates that the
differences in the means
between A and B are likely to
be due to chance.
overlap of the bars.
If error bars overlap,
then there is no
significant difference
between the two
samples.
Note: You cannot
say how ‘likely’ this
is due to chance –
just that it is
likely!
A
B
12. Alternative Hypothesis vs Null Hypothesis
Alternative Hypothesis (a hypothesis you want to prove)If the flowers are counted there will be only yellow
flowers.
Null hypothesis
There will be no significant difference between the
expected flower color and the observed flower color.
If leaves are exposed to more sunlight, then they There will be no significant difference in the size of the
will be larger than leaves that receive less sunlight. leaves.
Acceptance or Rejection of the of the Null Hypothesis
Our calculated value of t is less than the
Our calculated value of Chi-squared is much
critical value of t.
larger than the critical value of Chi-squared.
There is more than 5% probability that the
differences in the means (mean of A and the
mean of B) are due to chance.
There is less than 5% probability that the differences
(between the observed and expected data) are due
to chance.
We accept our null hypothesis.
We reject our null hypothesis.
13.
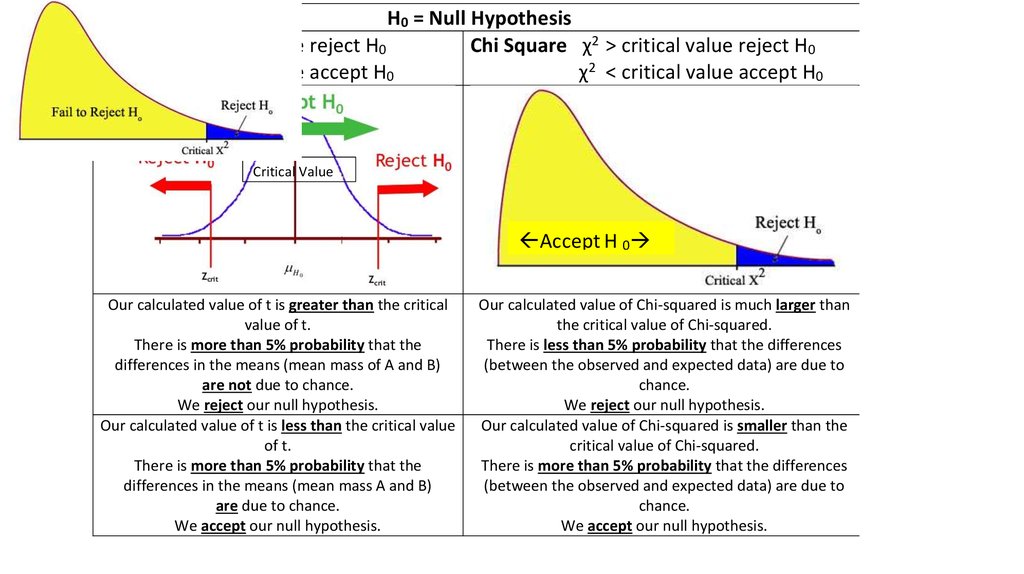
H0 = Null Hypothesist-test t > critical value reject H0
Chi Square χ2 > critical value reject H0
t < critical value accept H0
χ2 < critical value accept H0
Critical Value
Accept H 0
Our calculated value of t is greater than the critical
value of t.
There is more than 5% probability that the
differences in the means (mean mass of A and B)
are not due to chance.
We reject our null hypothesis.
Our calculated value of t is less than the critical value
of t.
There is more than 5% probability that the
differences in the means (mean mass A and B)
are due to chance.
We accept our null hypothesis.
Our calculated value of Chi-squared is much larger than
the critical value of Chi-squared.
There is less than 5% probability that the differences
(between the observed and expected data) are due to
chance.
We reject our null hypothesis.
Our calculated value of Chi-squared is smaller than the
critical value of Chi-squared.
There is more than 5% probability that the differences
(between the observed and expected data) are due to
chance.
We accept our null hypothesis.
14.
15.
16.
Woodland vs garden petalspetal
woodland
garden
Woodland
garden
Standard
deviation
formula
17.
Calculating Standard DeviationStep 1: Find the mean.
Step 2: For each data point, find the
square of its distance to the mean.
Step 3: Sum the values from Step 2.
Step 4: Divide by the number of
data points.
Step 5: Take the square root
18. Calculate Standard Error
19.
Degrees of freedoms for t-testCalculate t-test