


 medicine
Similar presentations:


Wellness and health promotion
1.
Wellness and HealthPromotion
Week 2
Fernando Martinez, Ph.D.
Professor
2.
ObjectivesA. Describe quality of life and list some
measures used to describe quality of
life.
B. List the differences in health status
that cannot be explained by biological
or physiological differences.
C. Define mortality, morbidity and rate.
3.
Quality of LifeGeneral Sense of Happiness and Satisfaction
And Contentment
Hard to Measure
• Personal sense of physical and mental health
• Assessments of “very good”, “good”, “fair” or
“poor”.
• Number of sick days.
4.
How To Lead Flourishing Lives?Scarcity/Poverty: Can cause increased health risks,
high levels of stress, tunneling
(narrow focus) and dysfunction.
Flourishing:
Manageable stress, adequate
resources, caring and respectful
relationships, happiness.
5.
To Increase Life Expectancy andQuality of Life…People Need
Knowledge
Motivation
Opportunities
Life expectancy is the average
number of years lived after
birth.
Resources
6.
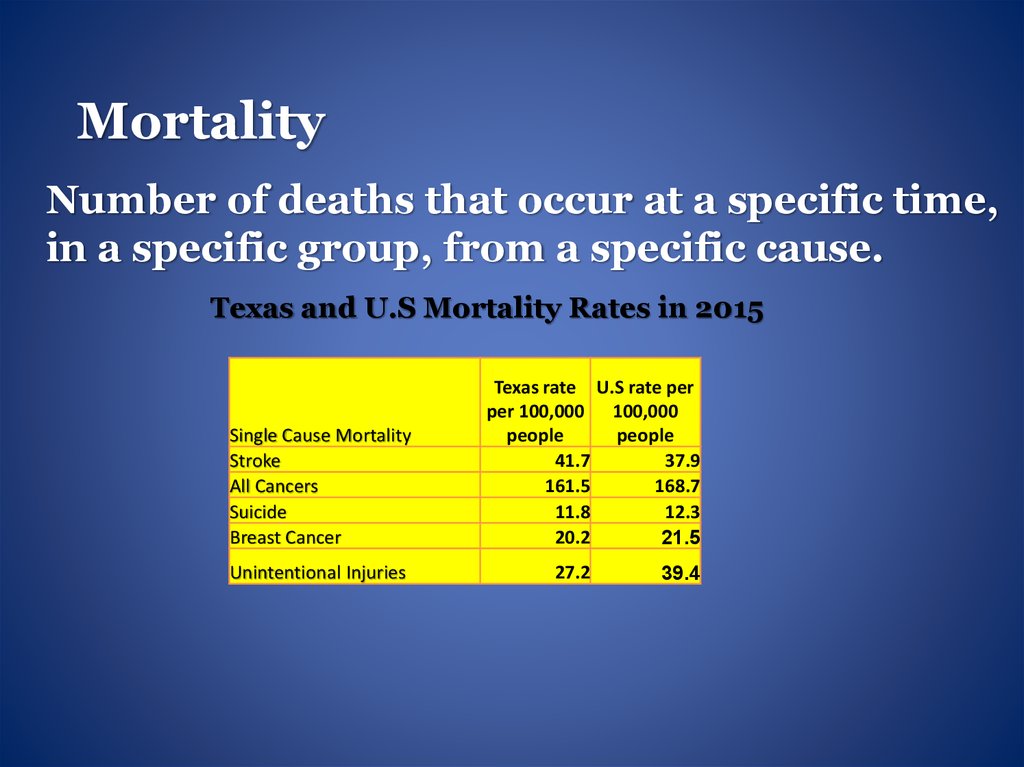
MortalityNumber of deaths that occur at a specific time,
in a specific group, from a specific cause.
Texas and U.S Mortality Rates in 2015
Single Cause Mortality
Stroke
All Cancers
Suicide
Breast Cancer
Unintentional Injuries
Texas rate U.S rate per
per 100,000 100,000
people
people
41.7
37.9
161.5
168.7
11.8
12.3
20.2
21.5
27.2
39.4
7.
MorbidityNumber of people with a specific disease,
during a specific period, in a specific
location.
Disease
Number of Cases per
100,00 Texans in 2015
Tuberculosis
1,222
Chicken Pox
1,874
Mumps
13
Measles
27
Hepatitis A
109
8.
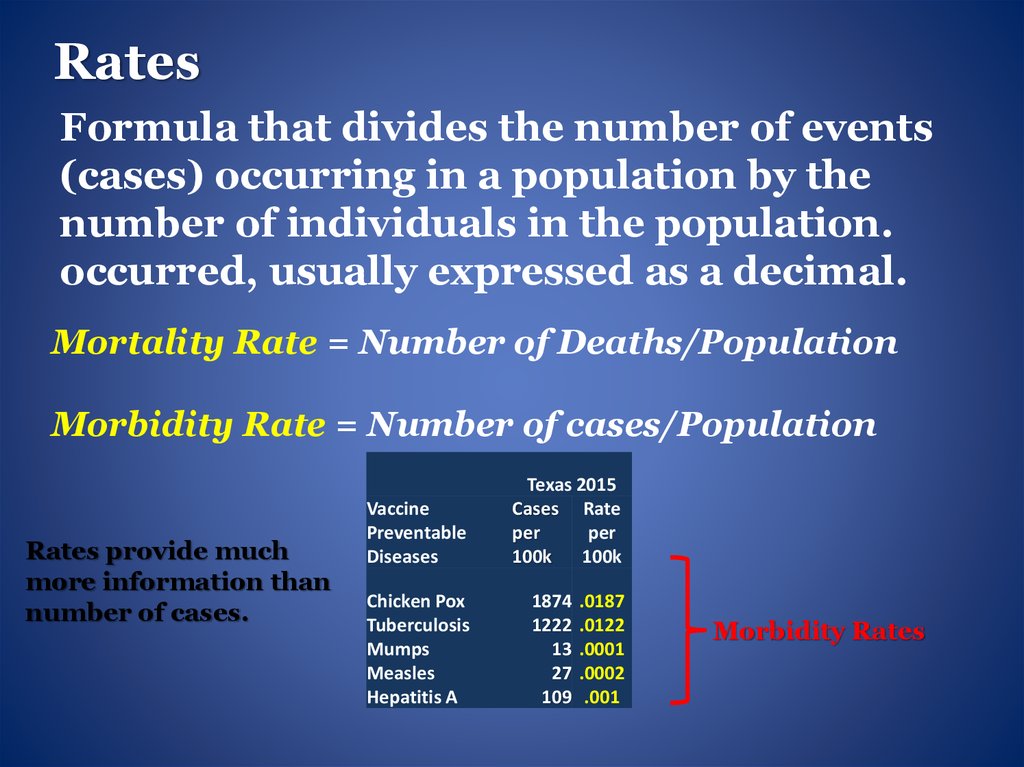
RatesFormula that divides the number of events
(cases) occurring in a population by the
number of individuals in the population.
occurred, usually expressed as a decimal.
Mortality Rate = Number of Deaths/Population
Morbidity Rate = Number of cases/Population
Rates provide much
more information than
number of cases.
Vaccine
Preventable
Diseases
Chicken Pox
Tuberculosis
Mumps
Measles
Hepatitis A
Texas 2015
Cases Rate
per
per
100k 100k
1874
1222
13
27
109
.0187
.0122
.0001
.0002
.001
Morbidity Rates
9.
Health DisparitiesDifferences in the health of people that is not
due to biological or genetic differences are
called disparities.
Disparities are usually caused by:
● gender
● race/ethnicity
● education ● income
● disability
● location
10.
Disparities Due to GenderWomen Generally Have
Longer Life Expectancy Lower Death Rates
Lower Rates of Intentional Injuries
Higher Rates of Lung Cancer
Higher Rates of Alzheimer’s Disease
Higher Rates of Depression
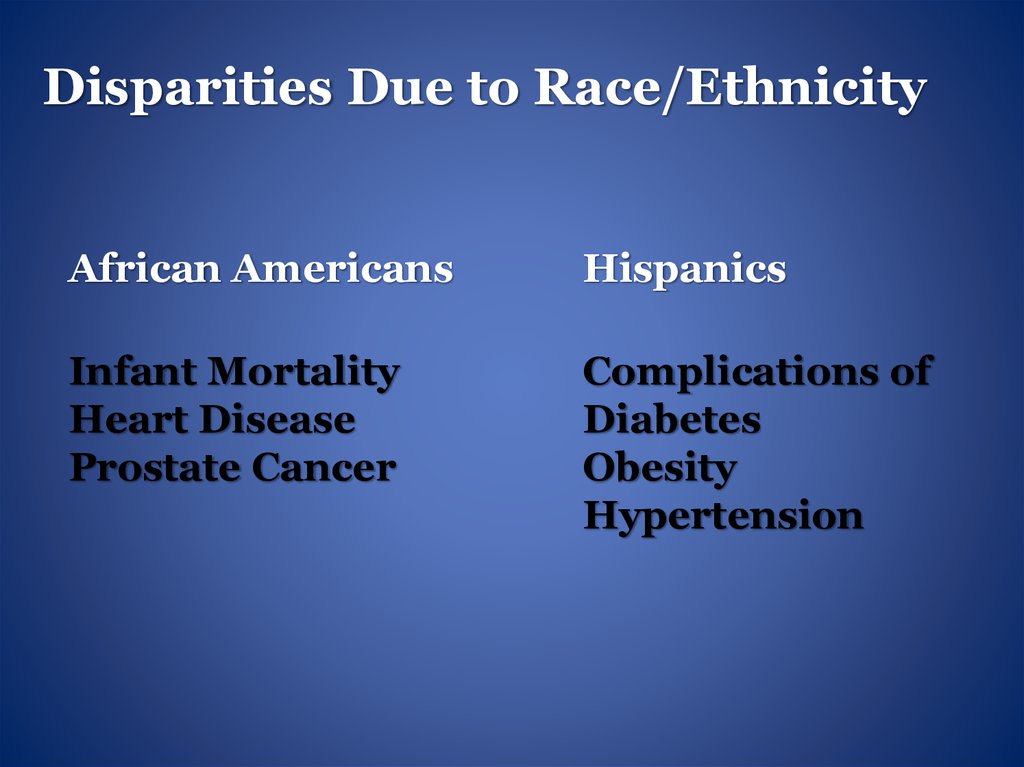
11.
Disparities Due to Race/EthnicityAfrican Americans
Hispanics
Infant Mortality
Heart Disease
Prostate Cancer
Complications of
Diabetes
Obesity
Hypertension
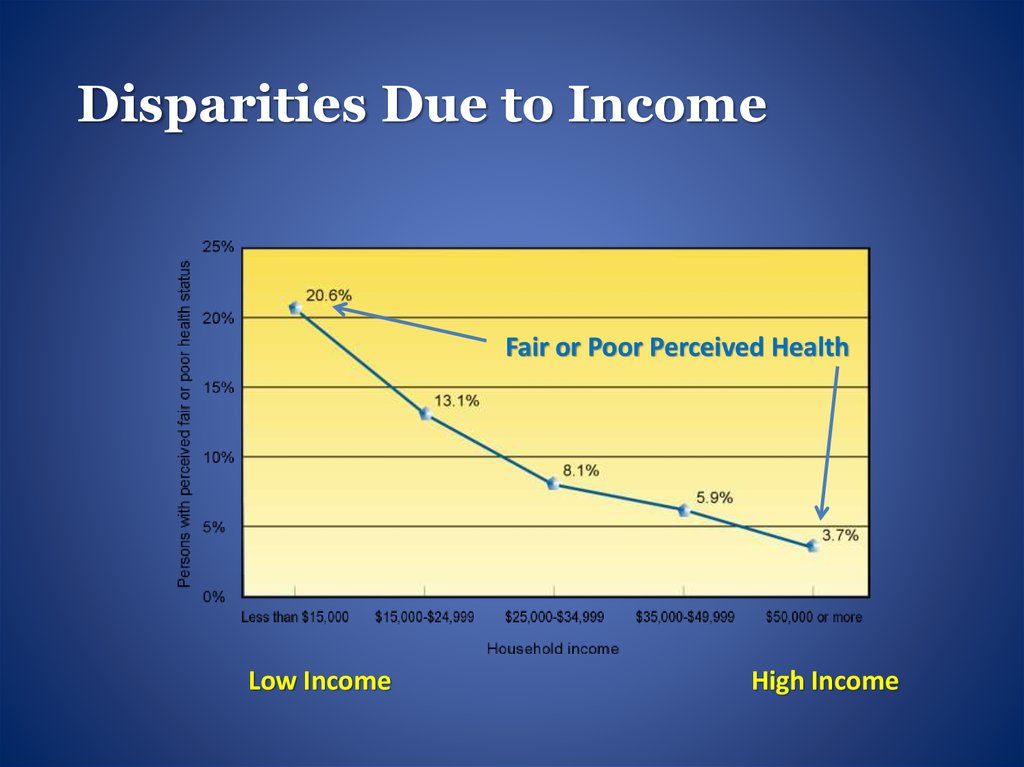
12.
Disparities Due to IncomeFair or Poor Perceived Health
Low Income
High Income
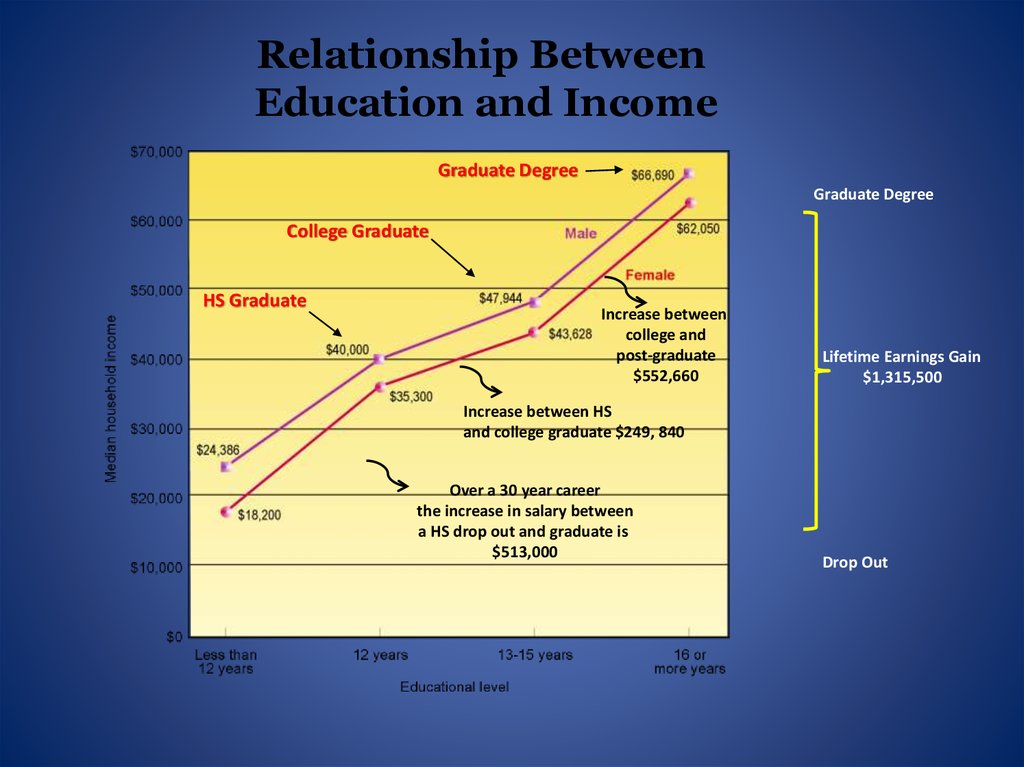
13.
Relationship BetweenEducation and Income
Graduate Degree
Graduate Degree
College Graduate
HS Graduate
Increase between
college and
post-graduate
$552,660
Lifetime Earnings Gain
$1,315,500
Increase between HS
and college graduate $249, 840
Over a 30 year career
the increase in salary between
a HS drop out and graduate is
$513,000
Drop Out
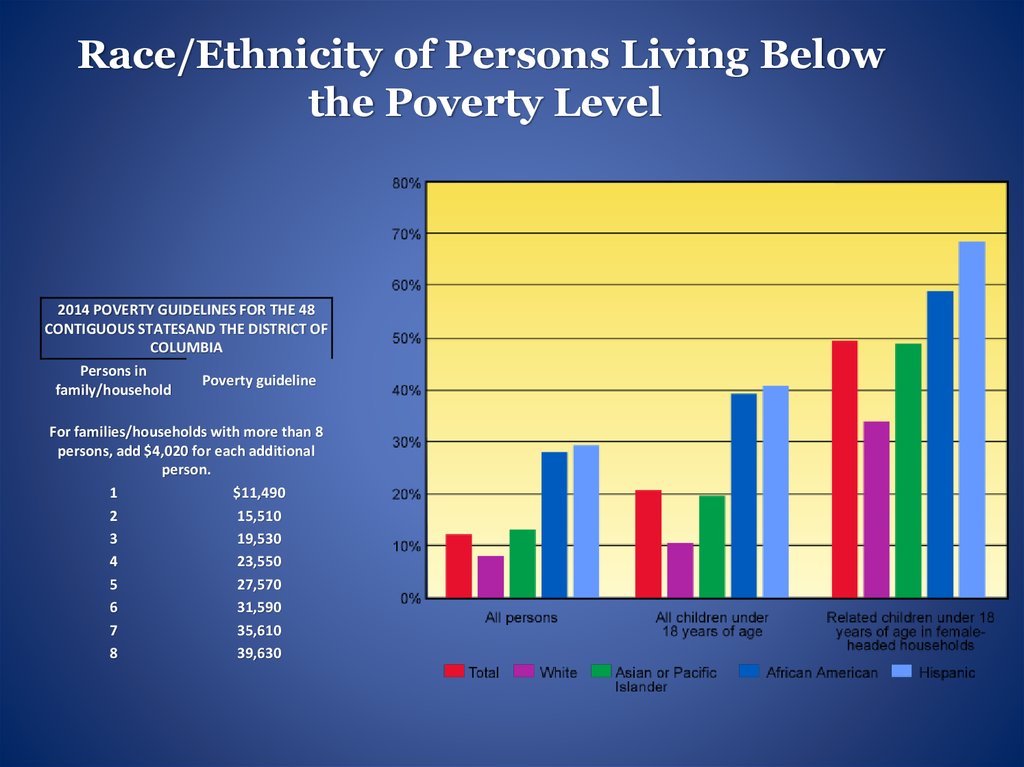
14.
Race/Ethnicity of Persons Living Belowthe Poverty Level
2014 POVERTY GUIDELINES FOR THE 48
CONTIGUOUS STATESAND THE DISTRICT OF
COLUMBIA
Persons in
Poverty guideline
family/household
For families/households with more than 8
persons, add $4,020 for each additional
person.
1
$11,490
2
15,510
3
19,530
4
23,550
5
27,570
6
31,590
7
35,610
8
39,630
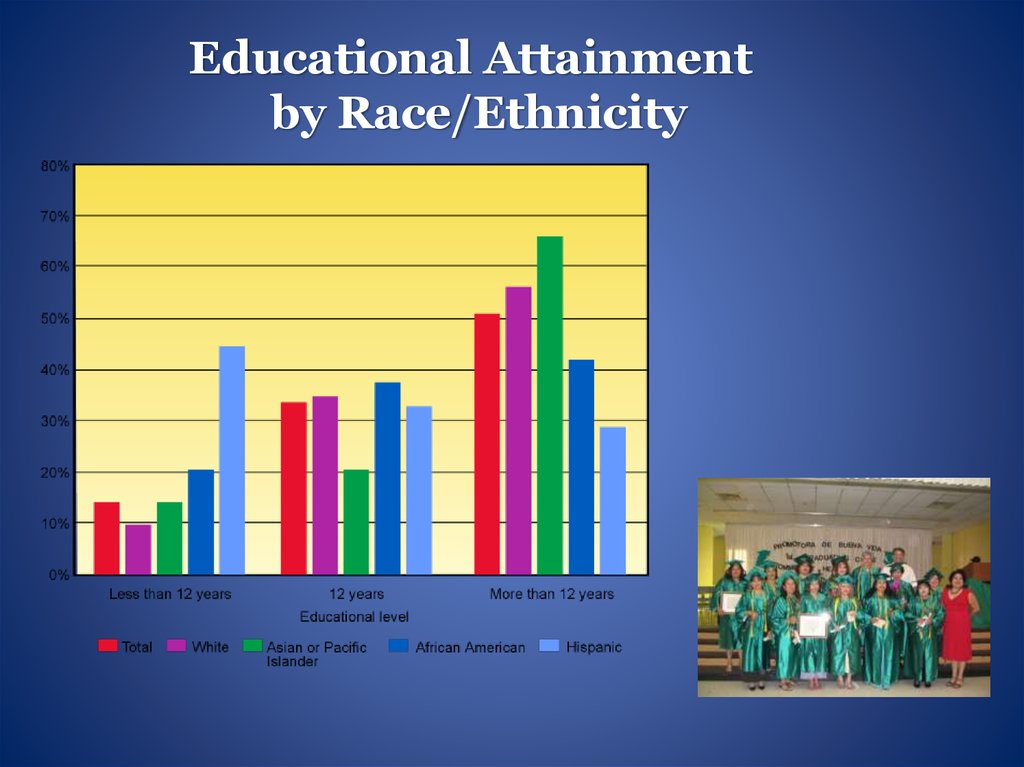
15.
Educational Attainmentby Race/Ethnicity
16.
Disparities Due to DisabilitiesActivity Limitations
Access to Health Care
Weight
Control
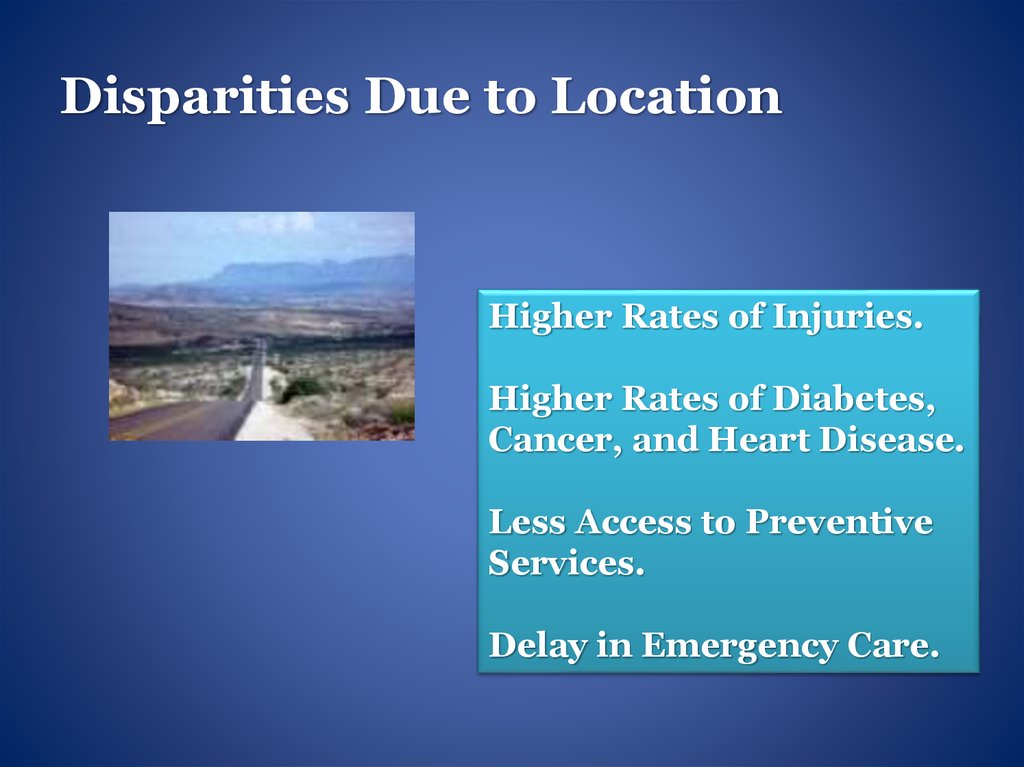
17.
Disparities Due to LocationHigher Rates of Injuries.
Higher Rates of Diabetes,
Cancer, and Heart Disease.
Less Access to Preventive
Services.
Delay in Emergency Care.