


")

")


")

")
 Potential Items to Assess Attitudes Toward Abortion")


")


")


")


")

")
")
 – Fazio (1990)")
 – Fazio (1990)")


")

 psychology
Similar presentations:


Attitudes and Behavior
1. Attitudes and Behavior
2.
Centrality of the Attitude ConstructGordon W. Allport (1968)
“… attitude is probably the most distinctive and
indispensable concept in contemporary social psychology.
No other term appears more frequently in experimental and
theoretical literature."
“This … concept has been so widely adopted that it has
virtually established itself as the keystone in the edifice of
American social psychology.”
3. Why People Have Attitudes?
• Attitudes are necessary and adaptive for humans.They help us adjust to new situations, seeking out those things in our
environment that reward us and avoiding those things that punish us.
Attitudes can even be a matter of life or death, influencing whether
people take health risks or engage in healthy preventive behaviors.
• Attitudes are mainly used to sort things into “good” and
“bad” categories.
4. Definition
• An attitude can be defined as a latent dispositionor tendency to respond with some degree
favorableness
or
unfavorableness
to
a
psychological object (Ajzen, 2005).
5. Types of attitudes
• Global attitudes• Attitudes toward behavior
6. Attitude: Unidimensional Definition
Attitude is a hypothetical, latent construct. It is defined asthe readiness to respond to a psychological object with some
degree of favorableness or unfavorableness.
The evaluative reaction can range from extremely negative to
extremely positive, through the neutral point, on a dimension
such as:
“good – bad”
“pleasant – unpleasant
“in favor – opposed”.
7. Attitude vs. Beliefs
Attitudes differ from beliefs.• Beliefs are pieces of information (facts or opinions) about
something.
• Attitudes are different evaluations toward some object or issue
(e.g., you like or dislike something, you are in favor of or opposed
to some position).
8. Attitude vs. Beliefs
• If you think that a certain person is president or that it is cloudyoutside, that’s a belief.
• Whether you like this person as president, or the clouds, is your
attitude.
Logically, attitudes are for choosing, whereas beliefs are for
explaining.
Beliefs and attitudes both serve interpersonal functions. People need to
influence how others choose, and people also need to explain things to
others.
9. Attitude vs. Affect
Attitude: Evaluation of a psychological object.Affect: Somatic system with evaluative dimension and
an arousal dimension.
10. Tripartite Model of Attitude (Rosenberg & Hovland, 1960)
Tripartite Model of Attitude(Rosenberg & Hovland, 1960)
– Attitude +
– Cognition +
– “Affect” +
– Conation +
11. ABC model of attitudes
• Affective component: this involves a person’s feelings / emotionsabout the attitude object. For example: “I am scared of spiders”.
• Behavioral (or conative) component: the way the attitude we have
influences how we act or behave. For example: “I will avoid
spiders and scream if I see one”.
• Cognitive component: this involves a person’s belief / knowledge
about an attitude object. For example: “I believe spiders are
dangerous”.
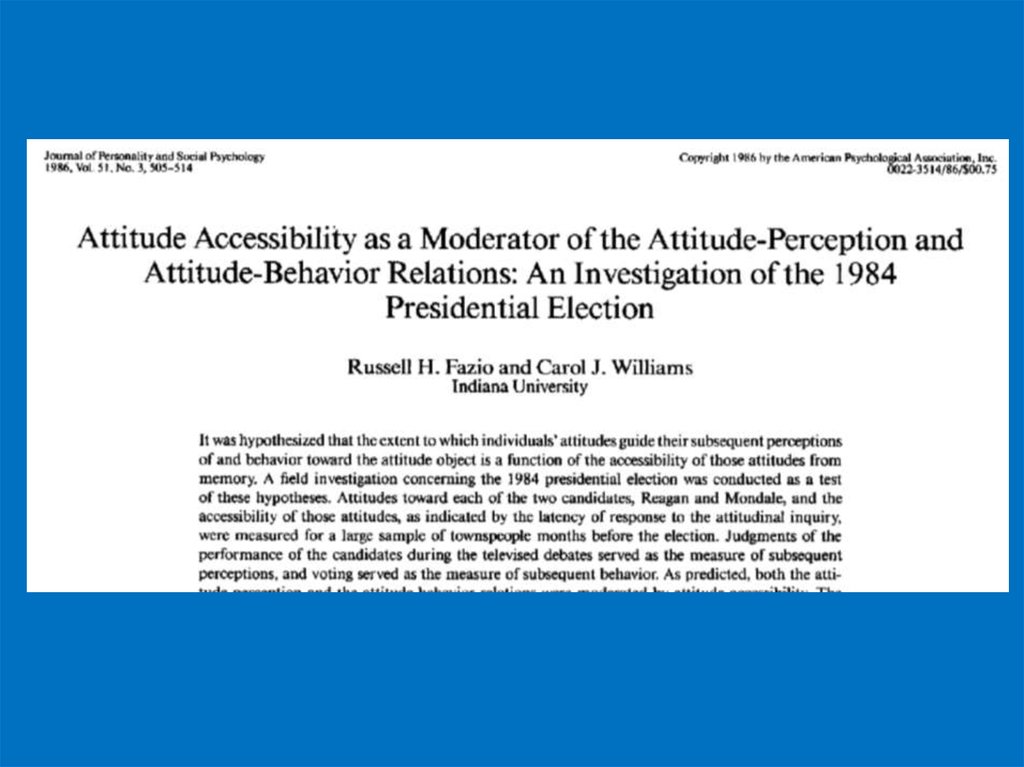
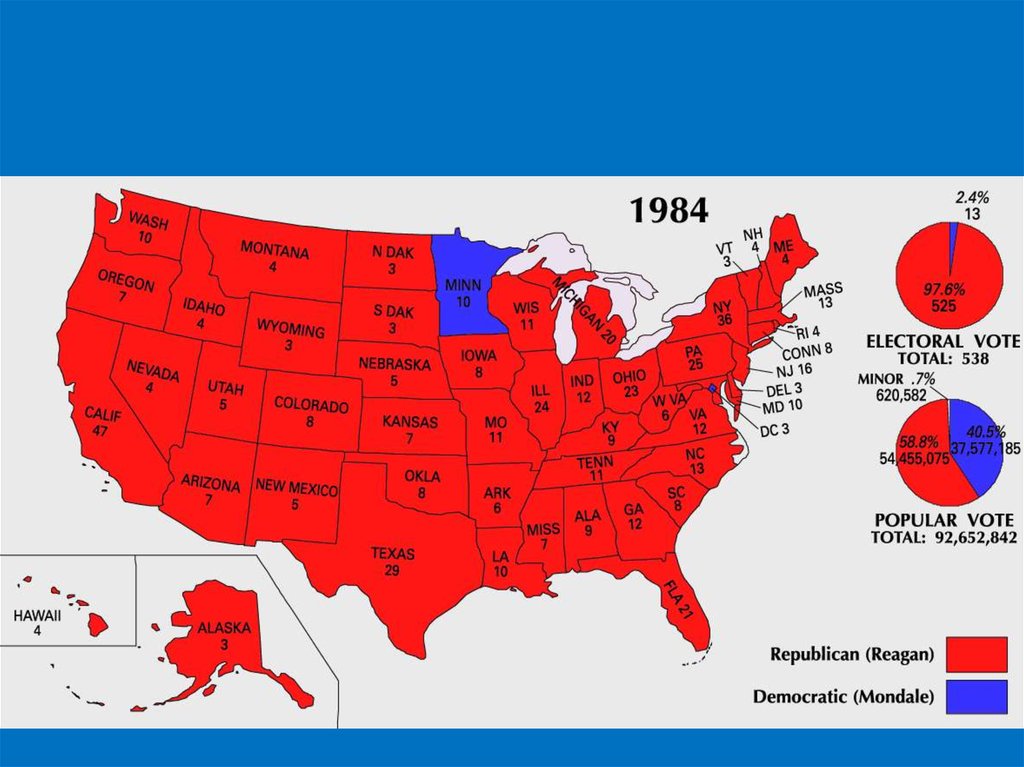
12. Tripartite Model of Attitude (Rosenberg & Hovland, 1960)
Tripartite Model of Attitude(Rosenberg & Hovland, 1960)
– Attitude +
– Cognition +
– “Affect” +
– Conation +
13.
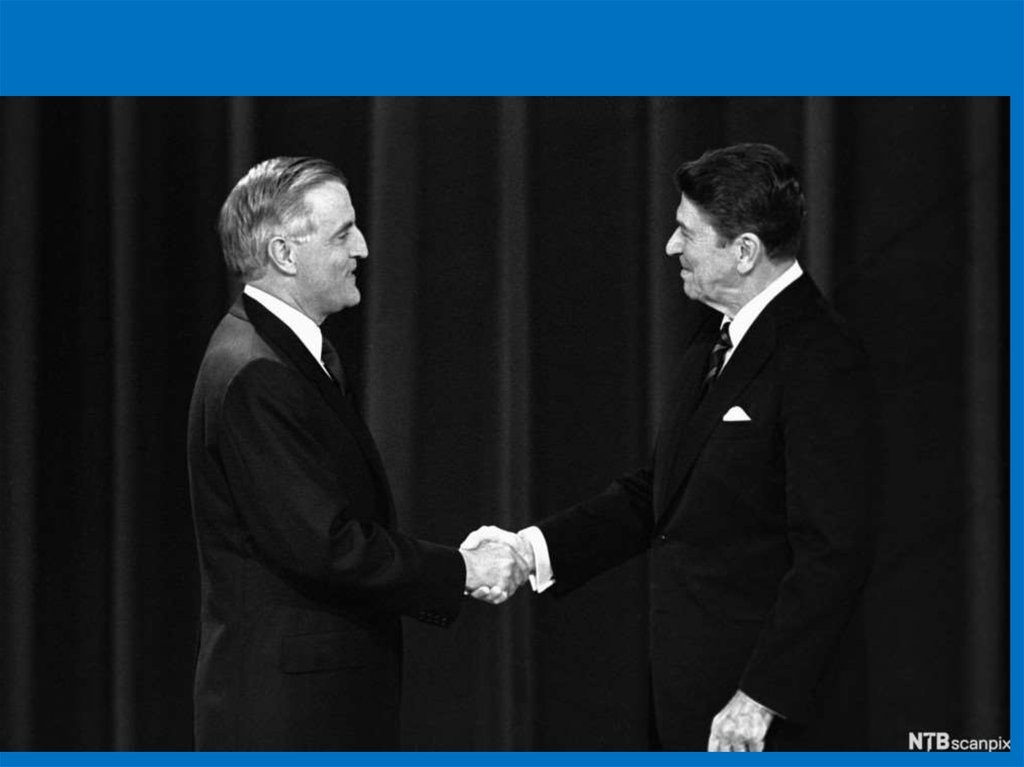
Attitude Measurement14. Direct Evaluations Examples of Single-Item Measures
“Do you approve of the way the President is doing his job?”____ Approve very much
____ Approve
____ Disapprove
____ Disapprove very much
“Were the tasks interesting and enjoyable? . . . Would you rate how you feel
about them on a scale from –5 to +5, where –5 means they were extremely dull
and boring, +5 means they were extremely interesting and enjoyable, and zero
means they were neutral, neither interesting nor uninteresting.” (Festinger &
Carlsmith, 1959)
“My attitude toward being religious is” (Fishbein & Ajzen, 1974)
extremely
extremely
unfavorable :___:___:___:___:___:___:___:___:___:___:___: favorable
“I have high self-esteem” (Robins et al., 2001)
Not very true of me :____:____:____:____:____:____:____: Very true of me
15. Single-Item Measures: Potential Problems
oo
o
o
o
Clerical errors in responding or coding
Momentary distraction
In phone survey: tone of voice while item is being read
Item wording
Momentary mood
16.
17. Effect of Mood: positive feeling state was induced by giving subjects a free gift, and good mood, thus induced, was found to
improve subjects'evaluations of the performance and service records of products they owned.
(Isen, Shalker, Clark, & Karp, 1978)
6,20
6,00
Evaluation
5,80
5,60
5,40
5,20
5,00
4,80
4,60
Positive Mood
Neutral Mood
18. Direct Evaluations: Multi-Item Measures Repeated Evaluations With Variations
Rosenberg (1965) Self-Esteem Scale1. I feel that I am a person of worth, at least on an equal basis with others.
_____ Strongly agree
_____ Agree
_____ Disagree
_____ Strongly disagree
2. I feel that I have a number of good qualities.
3. All in all, I am inclined to feel that I am a failure.
4. I am able to do things as well as most other people.
5. I feel I do not have much to be proud of.
6. I take a positive attitude toward myself.
7. In the whole, I am satisfied with myself.
8. I wish I could have more respect for myself.
9. I certainly feel useless at times.
10. At times I think I am no good at all.
19. Direct Attitude Assessment: Evaluative Semantic Differential
One of the options being considered in the abortion debate is to make abortion illegal inthe United States. Please indicate how you feel about this policy by marking the
appropriate space on each of the following scales.
Making Abortion is
desirable :______:______:______:______:______:______:______:
productive :______:______:______:______:______:______:______:
bad
:______:______:______:______:______:______:______:
harmful
:______:______:______:______:______:______:______:
right
:______:______:______:______:______:______:______:
cautious :______:______:______:______:______:______:______:
inconsistent:______:______:______:______:______:______:______:
ugly
:______:______:______:______:______:______:______:
foolish
:______:______:______:______:______:______:______:
timely
:______:______:______:______:______:______:______:
useful
:______:______:______:______:______:______:______:
progressive :______:______:______:______:______:______:______:
undesirable
destructive
good
beneficial
wrong
rash
consistent
beautiful
wise
untimely
useless
regressive
20. Semantic Differential: Rotated Factor Loadings (Osgood, Suci, & Tannenbaum, 1957)
Semantic Differential: Rotated Factor Loadings(Osgood, Suci, & Tannenbaum, 1957)
1. good-bad
2. large-small
3. beautiful-ugly
4. yellow-blue
5. hard-soft
6. sweet-sour
7. strong-weak
8. clean-dirty
9. high-low
10. calm-agitated
11. tasty-distasteful
12. valuable-worthless
13. red-green
14. young-old
15. kind-cruel
16. loud-soft
17. deep-shallow
18. pleasant-unpleasant
19. black-white
20. bitter-sweet
21. happy-sad
22. sharp-dull
23. empty-full
24. ferocious-peaceful
25. heavy-light
I
II
III
IV
.88
.06
.86
-.33
-.48
.83
.19
.82
.59
.61
.77
.79
-.33
.31
.82
-.39
.27
.82
-.64
.80
.76
.23
-.57
-.69
-.36
.05
.62
.09
-.14
.55
-.14
.62
-.05
.21
.00
.05
.04
-.08
-.30
-.10
.44
.46
-.05
.31
.11
-.11
.07
-.26
.17
.62
.09
.34
.0l
.12
.16
-.09
.20
.03
.08
-.36
-.11
.13
.35
.32
-.18
.23
.14
.28
.01
.20
.00
.52
-.03
.41
-.11
.09
.04
.26
.17
.21
.02
-.03
.02
.04
-.05
.00
.00
.22
.01
.13
.22
-.25
-.12
-.03
.03
.03
-.10
.18
.02
.06
26. wet-dry
27. sacred-profane
28. relaxed-tense
29. brave-cowardly
30. long-short
31. rich-poor
33. hot-cold
34. thick-thin
35. nice-awful
36. bright-dark
37. bass-treble
38. angular-rounded
39. fragrant-foul
40. honest-dishonest
41. active-passive
42. rough-smooth
43. fresh-stale
44. fast-slow
45. fair-unfair
46. rugged-delicate
47. near-far
48. pungent-bland
49. healthy-sick
50. wide-narrow
I
% Total Variance
% Common Variance
33.78
68.55
II
III
7.62
6.24
15.46 12.66
IV
1.52
3.08
I
II
III
IV
.08
.81
.55
.66
.20
.59
-.04
-.06
.87
.69
-.33
-.17
.84
.85
.14
-.46
.68
.0l
.83
-.42
.41
-.30
.69
.26
.07
.02
.12
.44
.34
.03
-.06
.44
-.08
-.13
.47
.08
-.04
.07
.04
.36
.0l
.00
.08
.60
.13
.12
.17
.41
-.03
-.10
-.37
.12
.13
.10
.46
-.06
.19
.26
-.06
.43
-.11
-.02
.59
.29
.22
.70
-.07
.26
.11
.26
.09
-.07
-.14
.01
-.11
.03
-.23
-.16
.07
-.11
.15
.00
.02
.12
.05
.16
-.02
.10
-.11
-.12
.11
.27
-.05
.05
.02
-.11
21.
• The semantic differential technique reveals information onthree basic dimensions of attitudes:
22.
• The semantic differential technique reveals information onthree basic dimensions of attitudes:
• evaluation
23.
• The semantic differential technique reveals information onthree basic dimensions of attitudes:
• evaluation
• potency (i.e. strength)
24.
• The semantic differential technique reveals information onthree basic dimensions of attitudes:
• evaluation
• potency (i.e. strength)
• activity
25.
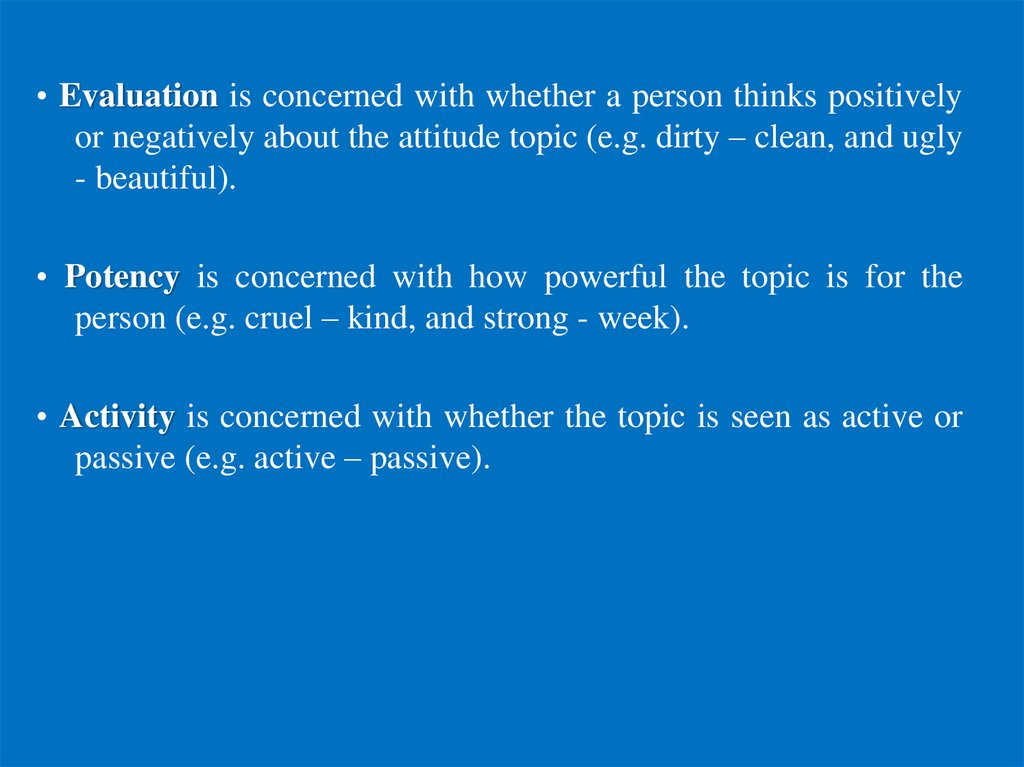
• Evaluation is concerned with whether a person thinks positivelyor negatively about the attitude topic (e.g. dirty – clean, and ugly
- beautiful).
• Potency is concerned with how powerful the topic is for the
person (e.g. cruel – kind, and strong - week).
• Activity is concerned with whether the topic is seen as active or
passive (e.g. active – passive).
26. Semantic Differential: Rotated Factor Loadings (Osgood, Suci, & Tannenbaum, 1957)
Semantic Differential: Rotated Factor Loadings(Osgood, Suci, & Tannenbaum, 1957)
1. good-bad
2. large-small
3. beautiful-ugly
4. yellow-blue
5. hard-soft
6. sweet-sour
7. strong-weak
8. clean-dirty
9. high-low
10. calm-agitated
11. tasty-distasteful
12. valuable-worthless
13. red-green
14. young-old
15. kind-cruel
16. loud-soft
17. deep-shallow
18. pleasant-unpleasant
19. black-white
20. bitter-sweet
21. happy-sad
22. sharp-dull
23. empty-full
24. ferocious-peaceful
25. heavy-light
I
II
III
IV
.88
.06
.86
-.33
-.48
.83
.19
.82
.59
.61
.77
.79
-.33
.31
.82
-.39
.27
.82
-.64
.80
.76
.23
-.57
-.69
-.36
.05
.62
.09
-.14
.55
-.14
.62
-.05
.21
.00
.05
.04
-.08
-.30
-.10
.44
.46
-.05
.31
.11
-.11
.07
-.26
.17
.62
.09
.34
.0l
.12
.16
-.09
.20
.03
.08
-.36
-.11
.13
.35
.32
-.18
.23
.14
.28
.01
.20
.00
.52
-.03
.41
-.11
.09
.04
.26
.17
.21
.02
-.03
.02
.04
-.05
.00
.00
.22
.01
.13
.22
-.25
-.12
-.03
.03
.03
-.10
.18
.02
.06
26. wet-dry
27. sacred-profane
28. relaxed-tense
29. brave-cowardly
30. long-short
31. rich-poor
33. hot-cold
34. thick-thin
35. nice-awful
36. bright-dark
37. bass-treble
38. angular-rounded
39. fragrant-foul
40. honest-dishonest
41. active-passive
42. rough-smooth
43. fresh-stale
44. fast-slow
45. fair-unfair
46. rugged-delicate
47. near-far
48. pungent-bland
49. healthy-sick
50. wide-narrow
I
% Total Variance
% Common Variance
33.78
68.55
II
III
7.62
6.24
15.46 12.66
IV
1.52
3.08
I
II
III
IV
.08
.81
.55
.66
.20
.59
-.04
-.06
.87
.69
-.33
-.17
.84
.85
.14
-.46
.68
.0l
.83
-.42
.41
-.30
.69
.26
.07
.02
.12
.44
.34
.03
-.06
.44
-.08
-.13
.47
.08
-.04
.07
.04
.36
.0l
.00
.08
.60
.13
.12
.17
.41
-.03
-.10
-.37
.12
.13
.10
.46
-.06
.19
.26
-.06
.43
-.11
-.02
.59
.29
.22
.70
-.07
.26
.11
.26
.09
-.07
-.14
.01
-.11
.03
-.23
-.16
.07
-.11
.15
.00
.02
.12
.05
.16
-.02
.10
-.11
-.12
.11
.27
-.05
.05
.02
-.11
27. Inferential Attitude Measures (Thurstone, Likert, Guttman Scaling) Potential Items to Assess Attitudes Toward Abortion
1.2.
3.
4.
It is better to have an abortion than to give birth to an unwanted child.
I have reservations about the easy availability of abortions.
Abortion is equivalent to murder.
The right of the mother to control her own body is more important than any rights of the
unborn fetus.
5. I would be willing to sign a petition to make abortion illegal.
6. The question of abortion involves fundamental human values.
7. The Government should not provide funds for abortion clinics.
8. The decision to have an abortion during early pregnancy should be left up to the mother.
9. Doctors who perform abortions are despicable.
10. If abortion were outlawed, women would obtain abortions with the help of unqualified
people, putting their lives in danger.
11. There are valid arguments on both sides of the abortion debate.
12. If I or my wife had an unwanted pregnancy, I would be willing to abort the child.
13. Abortion is justifiable only when the mother's life is in danger.
14. The Constitution of RF amended to guarantee women's right to freedom of choice in
matters of abortion.
15. When I think about aborting a tiny fetus, I feel disgusted.
28. Likert Scaling:
Construct large number of items.Administer questionnaire: 5-point response scale: strongly
agree (5), agree (4), undecided (3), disagree (2), strongly disagree (1).
Negative items are reverse-scored.
Preliminary attitude score = sum of item scores.
Item selection: Criterion of internal consistency.
Retain items with high (pos or neg) item-total
correlation.
29. Ideal Operating Characteristic Curves for Positive and Negative Likert Scale Items
Probability of agreement+ Item
– Item
–
Attitude
+
30. Attitudes Toward Illegal Immigrants: Sample Items from a Likert Scale (Ommundsen & Larsen, 1997)
Attitudes Toward Illegal Immigrants:Sample Items from a Likert Scale
(Ommundsen & Larsen, 1997)
1. Illegal aliens should not benefit from my tax dollars. (N .68)*
2. Our taxes should be used to help those residing illegally in the United States.
(P .67)
3. There is enough room in this country for everyone. (P .65)
4. Illegal aliens are not infringing on our country's resources. (P .67)
5. Illegal aliens are a nuisance to society. (N .67)
6. There should be open international borders. (P .62)
7. Access to this country is too easy. (N .76)
8. Illegal aliens should receive food stamps. (P .65)
9. Illegal aliens who give birth to children in the United States should be made
citizens. (P .65)
10. The United States should accept all political refugees. (P .59)
11. Illegal aliens cost the United States millions of dollars each year. (N .75)
12. Illegal aliens should be eligible for welfare. (P .66)
*Direction of items: N = negative, P = positive; item – total correlation.
31.
Attitudes and Behavior32. Validation of Attitude Measures: Predictive Validity
Primary criterion for validity of attitude measure:Predictive validity, i.e., prediction of actual behavior.
Question:
Do standard (explicit) attitude measures, such as
Likert scales or the semantic differential, predict
behavior?
33.
34. Other Examples of Attitude-Behavior Relations
Corey (1937)Attitude: Likert scale. Attitude toward cheating.
Behavior: No. items changed on 5 true/false examinations.
Attitude–behavior correlation: r = .02
Weitz & Nuckols (1953)
Attitude: 10-item scale. Attitude toward job.
Behavior: Turnover. Leaving job during subsequent 12-months period.
Attitude–behavior correlation: r = .20
Holman (1956)
Attitude: 12-item scale. Attitude toward football.
Behavior: Attendance of football games over 8 occasions.
Attitude–behavior correlation: r = .41.
Fischer (1971)
Attitude: Likert scale. Attitude toward helping.
Behavior: Joining a hospital companion program.
Attitude–behavior correlation: r = .27.
35. Narrative Review of Over 50 Studies of the Attitude – Behavior Relation
"Taken as a whole, these studies suggest that it isconsiderably more likely that attitudes will be unrelated or
only slightly related to behaviors."
"The present review provides little evidence to support the
postulated existence of stable, underlying attitudes within
the individual which influence both his verbal expressions
and his action."
Alan Wicker, 1969
36.
Attitude – Behavior Relation• Wicker’s conclusions did not come as a surprise to
sociologists who had questioned the importance of personal
dispositions and had emphasized instead social context and
norms as determinants of human action (De Fleur &Westie,
1958; Deutscher, 1969; LaPiere, 1934).
• It did, however, shatter the complacency of many
psychologists who, like Gordon Allport (1968), considered
attitude to be “the most distinctive and indispensable concept
in contemporary American social psychology” (p. 59).
37. Explanation I: Inadequate Attitude Measurement
Major CritiqueAttitudes assess only the evaluative (affective)
component.
We must also assess the cognitive and conative
components of attitude.
38. Prediction of 8 Behaviors from Attitude Toward the Church (Ostrom, 1969)
Mean CorrelationsCognition – Behavior: Mean r = .18
Affect – Behavior: Mean r = .22
Conation – Behavior: Mean r = .24
39. Explanation II: Other Additive Factors
Personality traitsAbility
Motivation
Attitude
Habit
Needs
Social pressure
Other attitudes
Behavior
40. Explanation III: Moderating Variables
Personality• Self-monitoring (Snyder & Swann, 1976)
• Private self-consciousness (Scheier et al., 1978)
• Need for cognition (Cacioppo et al., 1986)
Attitude Attributes
• Cognitive-affective consistency (Norman, 1975)
• Reflection (Snyder & Swann, 1976)
• Involvement (Sivacek & Crano, 1982)
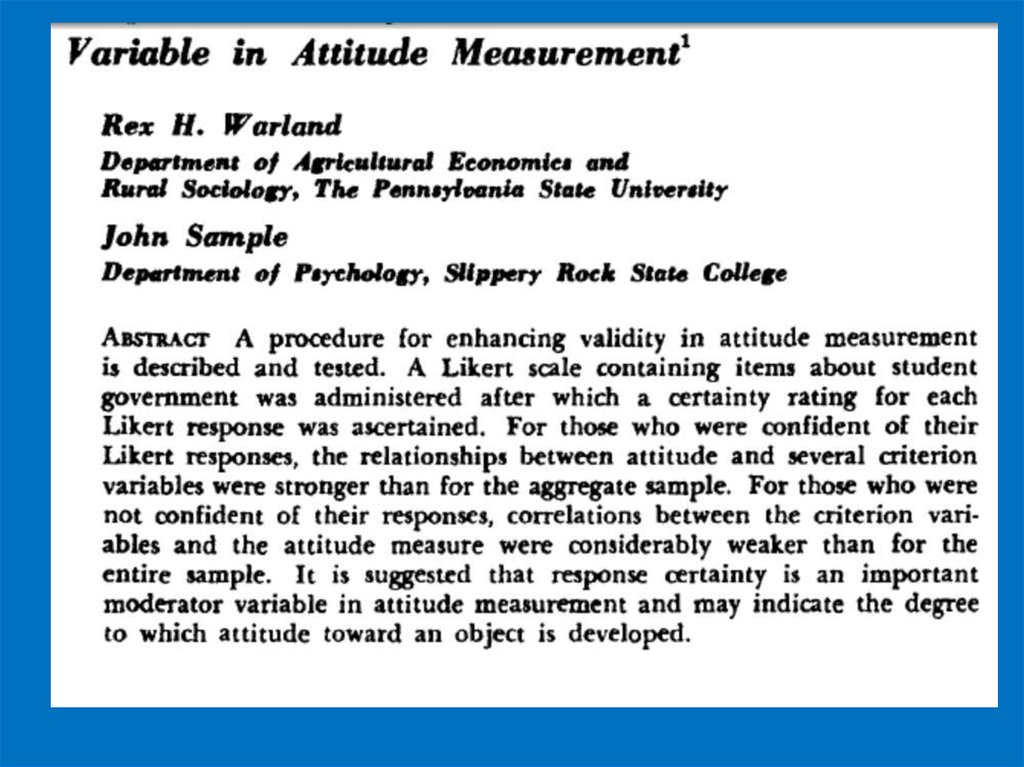
• Confidence (Warland & Sample, 1973)
• Direct experience (Regan & Fazio, 1977; Fazio & Zanno,
1978)
41.
42.
43.
44.
45. Explanation III: Moderating Variables
Personality• Self-monitoring (Snyder & Swann, 1976)
• Private self-consciousness (Scheier et al., 1978)
• Need for cognition (Cacioppo et al., 1986)
Attitude Attributes
• Cognitive-affective consistency (Norman, 1975)
• Reflection (Snyder & Swann, 1976)
• Involvement (Sivacek & Crano, 1982)
• Confidence (Warland & Sample, 1973)
• Direct experience (Regan & Fazio, 1977; Fazio & Zanno,
1978)
46.
47. Effect of Confidence on Attitude-Behavior Correlation – Student Government (Warland & Sample, 1973)
Effect of Confidence on Attitude-BehaviorCorrelation – Student Government
Attitude-Behavior Correlation
(Warland & Sample, 1973)
0,50
0,45
0,40
0,35
0,30
0,25
0,20
0,15
0,10
0,05
0,00
Low
High
Confidence
48. Problems of Moderating Variables Approach
1. High attitude-behavior correlation only for some peopleunder some conditions.
49. Problems of Moderating Variables Approach
1. High attitude-behavior correlation only for some peopleunder some conditions.
2. Higher-order interactions:
“Once we attend to interactions, we enter a hall of mirrors that extends
to infinity. However far we carry our analysis — to third order or
fifth order or any other — untested interactions of a still higher
order can be envisioned” (Cronbach (1975).
50.
51. Problems of Moderating Variables Approach
1. High attitude-behavior correlation only for some people undersome conditions.
2. Higher-order interactions:
“Once we attend to interactions, we enter a hall of mirrors that extends to
infinity. However far we carry our analysis — to third order or fifth
order or any other — untested interactions of a still higher order can
be envisioned” (Cronbach (1975).
“Theoretically, any single instance of behavior can be predicted if all the
right moderator variables are included. This is no more than to say that
behavior is determined, and that if we knew everything that determined
it, we could predict it. However, to do so might require the addition of
so many moderator variables that they would generate interactions of
such complexity as to make the procedure unfeasible and the results
uninterpretable” (Epstein, 1983).
52.
53. Response Biases
• Long before it became evident that attitudes are poorpredictors of behavior, investigators were concerned with the
validity of verbal attitude measures. It was argued that such
measures may be systematically distorted or biased and, thus,
may not reflect a person’s true attitude.
• social desirability
54. The methods available to avoid social desirability bias were of two types:
• 1) Disguised procedures of a verbal nature, such as Hammond’s(1948) error-choice technique or Waly and Cook’s (1965)
plausibility technique, were based on the assumption that when the
purpose of the instrument is not apparent, respondents are less
likely to distort or falsify their answers to attitudinal inquiries.
• 2) Alternatively, physiological reactions (e.g., galvanic skin response, heart
rate) were assumed to prevent bias by assessing involuntary responses over
which the individual has little or no control (for a review, see Kidder &
Campbell, 1970).
55.
The significant factors formed by scales ofSemantic Differential in answers of
Scales
Factor1
«Cohesion
Factor 2
Strong
,228318
«Aggression»
,924212
Industrious
Aggressive
Intelligent
Religious
Cohesive
% Variance
,919047
,357468
,008920
,906662
,507919
,935428
0,60
,990877
,311232
,004725
-,216566
0,21
56.
Graphic representation of modalities on the two factor axes of FAon the evaluation of different groups (Chechens in Stavropol)
C o n q u e ro r
A n t ip a t h e t ic
Chec hens
D a g e s ta n s
A rm e n ia n s
G re e k s
R u s s io n
M e
D e lig h t f u l
C o n q u e re d
Cohesion
57.
Graphic representation of modalities on the two factor axes ofFA on the evaluation of different groups (Cossacks)
T u rk s
Chec hens
Co ssa c k s
K u rd s
C o n q u e ro r
D e lig h t f u l
I am
R u s s ia n
A n t ip a t h e t ic
C o n q u e re d
Peaceful industry
58.
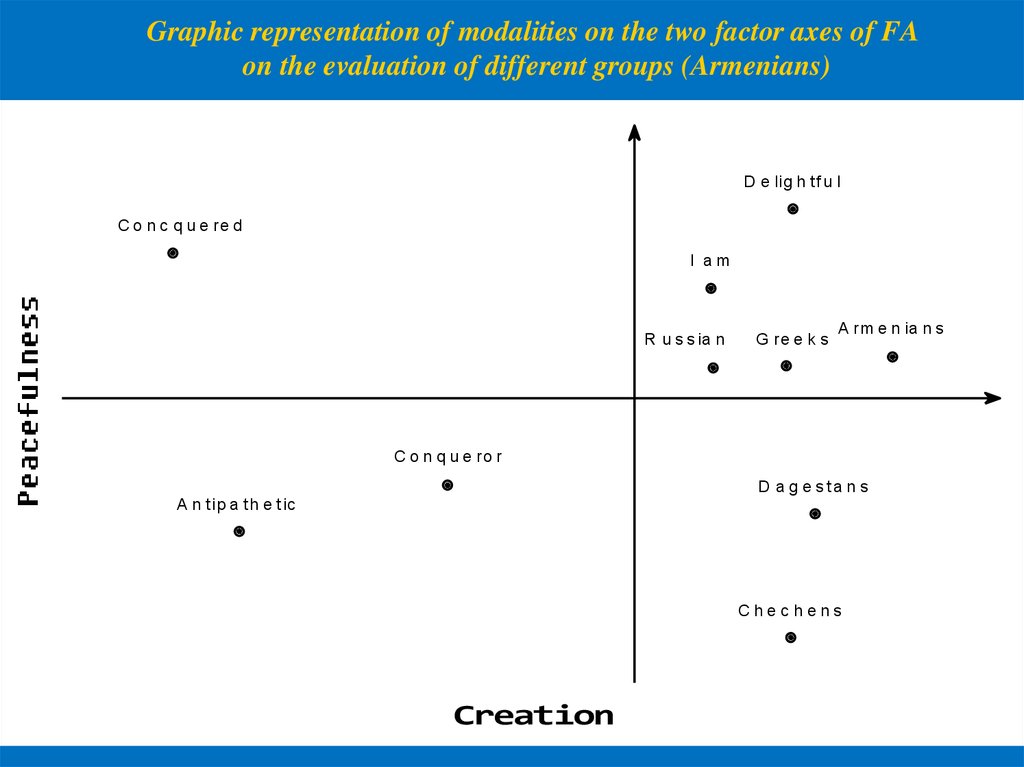
Graphic representation of modalities on the two factor axes of FAon the evaluation of different groups (Armenians)
D e lig h t f u l
C o n c q u e re d
I am
R u s s ia n
G re e k s
A rm e n ia n s
C o n q u e ro r
D a g e s ta n s
A n t ip a t h e t ic
Chec hens
Creation
59.
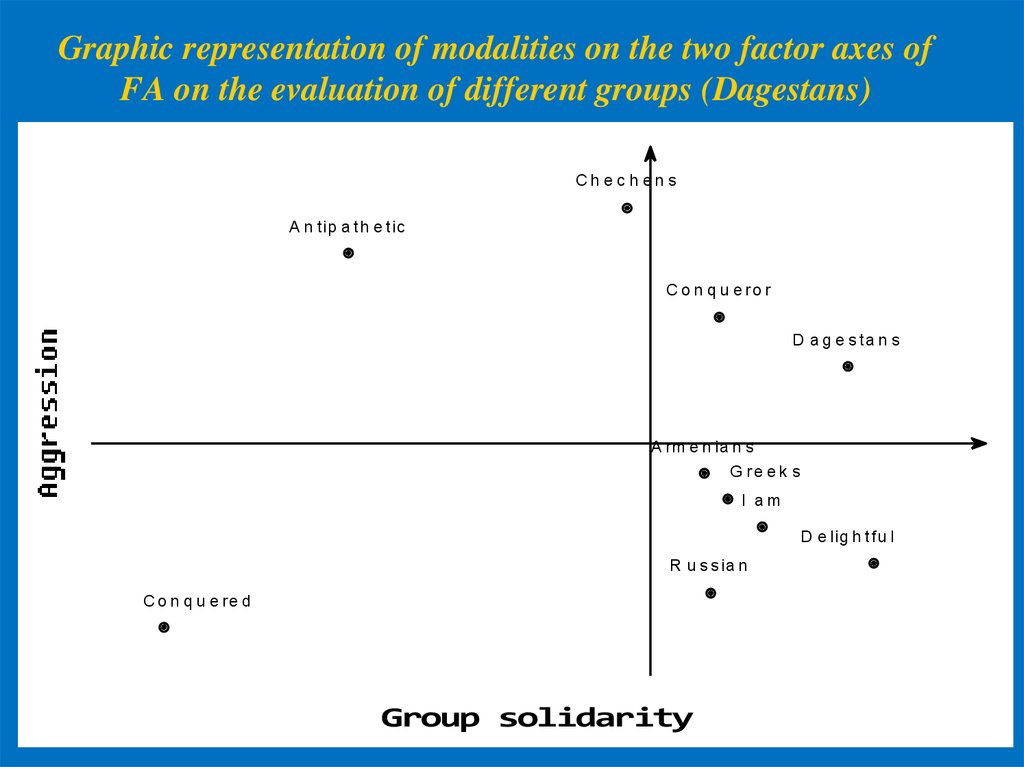
Graphic representation of modalities on the two factor axes ofFA on the evaluation of different groups (Dagestans)
Chec hens
A n t ip a t h e t ic
C o n q u e ro r
D a g e s ta n s
A rm e n ia n s
G re e k s
I am
D e lig h t f u l
R u s s ia n
C o n q u e re d
Group solidarity
60.
Graphic representation of modalities on the two factor axes ofFA on the evaluation of different groups (Russian)
Chec hens
D a g e s ta n s
G re e k s
A rm e n ia n s
D e lig h t f u l
C o n q u e ro r
I am
R u s s ia n
C o n c u e re d
A n t ip a t h e t ic
Peaceful industry
61. The methods available to avoid social desirability bias were of two types:
• 1) Disguised procedures of a verbal nature, such as Hammond’s (1948) errorchoice technique or Waly and Cook’s (1965) plausibility technique, werebased on the assumption that when the purpose of the instrument is not
apparent, respondents are less likely to distort or falsify their answers to
attitudinal inquiries (for a recent version of the plausibility technique, see
Saucier & Miller, 2003).
• 2) Alternatively, physiological reactions (e.g., galvanic skin
response, heart rate) were assumed to prevent bias by assessing
involuntary responses over which the individual has little or no
control (for a review, see Kidder & Campbell, 1970).
62. PREDICTING SINGLE BEHAVIORS
• Investigators are often interested not in a broad multiple-act indexof behavior but with predicting and understanding performance
of particular behaviors.
• Many examples are found in the health domain where investigators
have a substantive interest in understanding and influencing such
behaviors as cigarette smoking or categories of behavior, such as
exercising or eating a low-fat diet. Similarly, in the domain of
environmental protection, investigators are concerned with such
behaviors as recycling of glass, plastic, and paper; or categories of
behavior such as conserving water or reducing the consumption of
energy.
63. Principle of Compatibility
A single behavior can be viewed as involving an actiondirected at a target, performed in a given context, at
a certain point in time (Ajzen & Fishbein, 1977,
1980; Fishbein & Ajzen, 1975).
64. Principle of Compatibility
• For example, we may be interested in understandingwhy people do or do not enroll (action) in a special
course (target) at a master program (context) next time
when it is offered (time).
• In this example, we would have to assess attitude to
enroll in a continuing special course at MP the next time
it is offered or, in the more general case, to enroll in a
continuing education course in the next 2 months.
65. Principle of Compatibility
• The principle of compatibility (Ajzen, 1988; Ajzen &Fishbein, 1977) requires that measures of attitude and
behavior involve exactly the same action, target, context, and
time elements, whether defined at a very specific or at a more
general level.
• To the extent that the indicators used to assess attitude and
behavior comply with the principle of compatibility, they should
correlate highly with each other.
66. PREDICTING SINGLE BEHAVIORS: Principle of Compatibility
AttitudeBehavior
Target
Action
Context
Time
Target
Action
Context
Time
Empirical research has shown that specific behaviors can be
predicted quite well from compatible measures of attitude toward
the behaviors in question
67.
• Manstead, Proffitt, and Smart (1983) reported a study on infantfeeding practices. Toward the end of their pregnancies, women
completed a questionnaire that assessed, among other things, their
attitudes toward breast feeding (as opposed to bottle feeding) their
babies. Six weeks following delivery, a questionnaire sent to each
woman ascertained their actual feeding practices during the
preceding 6 weeks. Attitudes toward the behavior of interest were
found to have a correlation of .67 with the feeding method
employed.
68.
• Many studies have examined the relation between attitudes andbehavior in the domain of physical exercise. For example, Terry
and O’Leary (1995) obtained a measure of attitude toward
exercising for at least 20 minutes, three times a week for the next
fortnight and 2 weeks later, participants indicated whether they
had exercised for at least 20 minutes, three times per week during
the past fortnight. The attitude–behavior correlation was .53.
69. In a meta-analysis of 8 studies that manipulated level of compatibility while holding all other variables constant (Kraus,
1995), the prediction of behavior from attitude toward the behaviorresulted in a correlation of .54, whereas the correlation between
general attitudes and the single behaviors was only .13
Mean Correlation
0,6
0,54
0,4
0,2
0,13
0
General attitudes
Attitude toward the
behavior
70. Intention and behaviour
71. Intentions as Predictors of Behavior
• The previous discussion indicates that, consistent with the principle ofcompatibility, performance of specific behaviors can perhaps be best
explained by considering the proximal attitude toward the behavior
rather the more distal attitude toward the object at which the
behavior is directed.
• Carrying this idea further, a number of theorists have proposed that
the intention to perform a behavior, rather than attitude, is the
closest cognitive antecedent of actual behavioral performance.
• This implies that we should be able to predict specific behaviors
with considerable accuracy from intentions to engage in the
behaviors under consideration.
72. Intentions as Predictors of Behavior
• Many studies have substantiated the predictive validity ofbehavioral intentions. When appropriately measured, behavioral
intentions account for an appreciable proportion of variance in
actual behavior.
• Meta-analyses covering diverse behavioral domains have reported
mean intention–behavior correlations of 0.45 – 0.62.
73.
The respondents were asked the following question: “Are youthinking about starting your own business within the forthcoming
two years?” The options of answers were following: “Yes”,
“Maybe” and “No”.
Next, we selected respondents for further analysis.
- 269 respondents answered this question either “Yes”, or “Maybe”.
74.
• One year later, we re-interviewed by telephone the“intenders”. The purpose of this survey was to ascertain
whether or not the respondents in fact opened their own
business. We asked the respondents who did not open their
business the reason for this.
We managed to locate and re-interview 163 respondents
(out of the original 269) - 61% of the ”intenders.” Of these,
38 (23, 3%) opened their own business. The remaining 106
respondents - 39% of the “intenders” - either changed their
contact details or refused to participate in the study a second
time.
75. Low Intention–Behavior Relations
• However, notwithstanding these encouraging findings, there isalso considerable variability in the magnitude of observed
correlations, and relatively low intention–behavior correlations
are sometimes obtained.
• Several factors may be responsible for low relations between
intentions and behavior.
76. Intention – Behavior Gap: 6 Studies in Health Domain (Sheeran, 2002)
Median % across studies100
Behavior: No
90
Behavior: Yes
80
70
60
50
40
30
20
10
0
No
Intention
Yes
77. Reasons for Failure to Carry Out Intention
Low control (INT-BEH moderated by control).Forgetting – Failure of “prospective memory.”
Motivation can be high.
Procrastination (postpone something)
Low or moderate motivation. Fails to exceed threshold needed to
overcome inertia or distaste for activity.
Ambivalent motivation. Approach-avoidance conflict.
Change of mind – due to new information or re-evaluation
of existing information; person no longer motivated to
perform the behavior.
Behavior on single occasion. New information prior to behavior.
Repeated behavior. New information due to feedback.
Hypothetical vs. Real – Different types of information
accessible. Motivation high in hypothetical, low in real.
78.
Attitudes and BehaviorAttitudes toward specific behaviors are good predictors of
single actions.
General attitudes usually do not provide a good basis for
predicting and explaining single behaviors with respect
to the attitude object;
Correlations of single behaviors with general attitudes tend
to be modest at best.
79.
Attitudes and BehaviorNevertheless, many investigators continue to be interested in
broad attitudinal dispositions and their possible effects on
specific behaviors.
• New models of relation between attitude and behavior appeared
as a result of more careful study of the relation between them.
These models took into account various other psychological
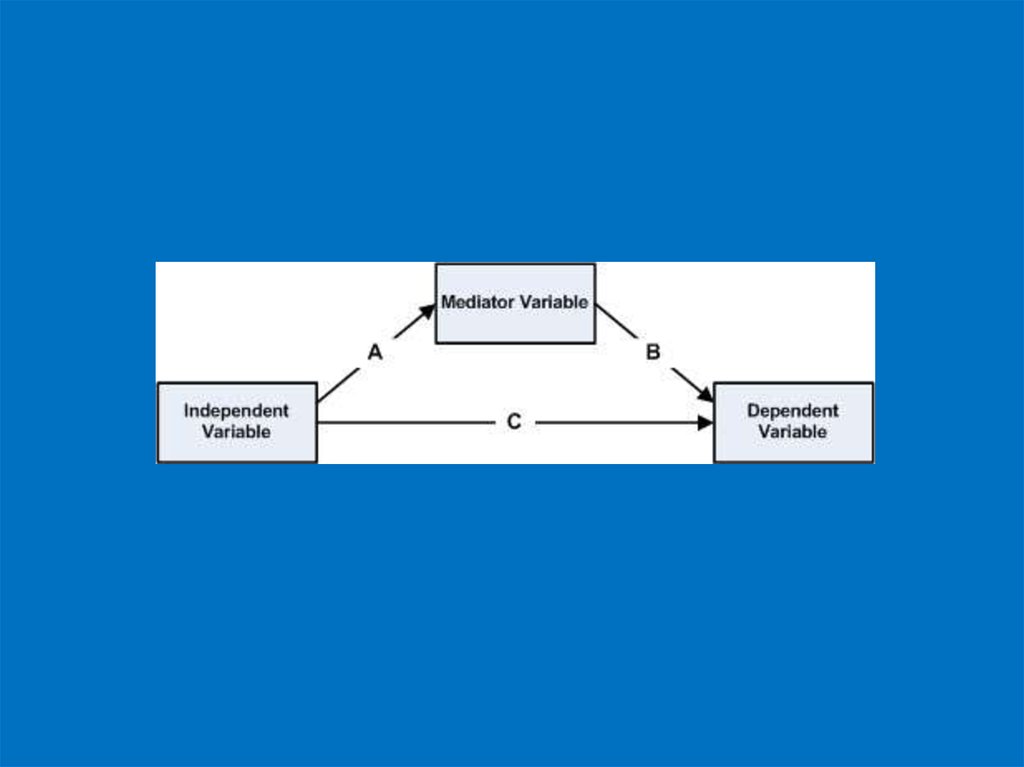
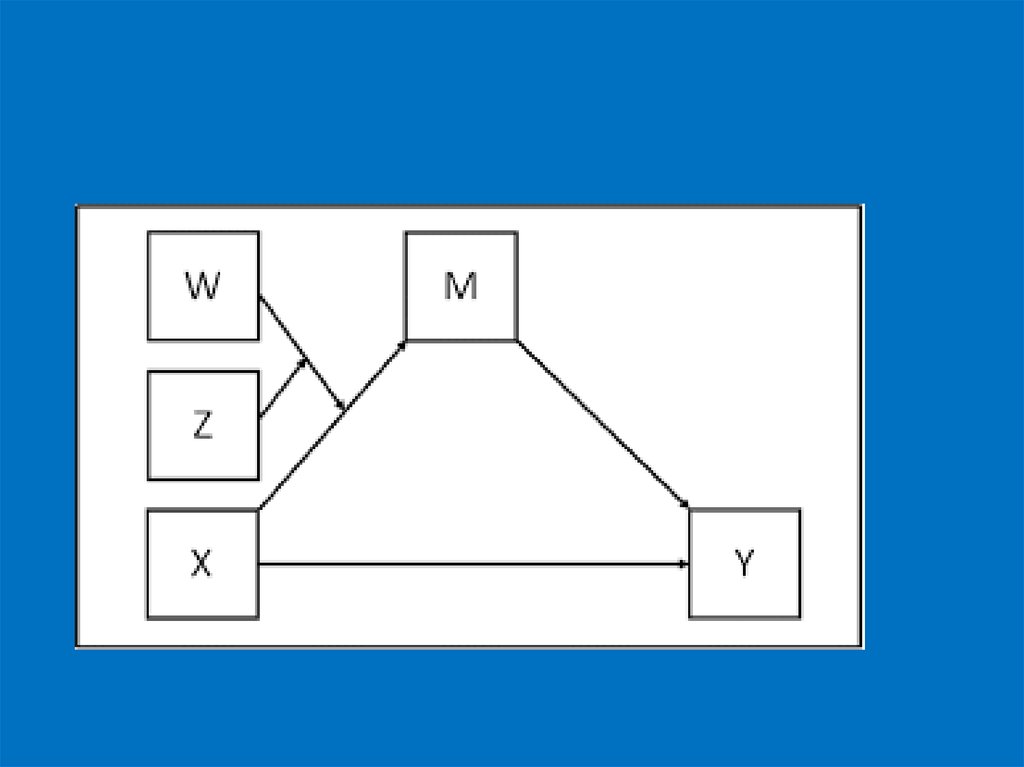
factors and processes which are mediators and moderators of
the relation between attitudes and behavior.
80. From General Attitudes to Specific Behaviors: Automatic and Deliberative Processes (Fazio, 1990)
The most direct and sophisticated attempt to
deal with the processes whereby general
attitudes may influence performance of specific
behaviors can be found in Fazio’s MODE
model.
Russell H. Fazio
Ohio State University
• The acronym MODE is used to suggest that
“motivation and opportunity act as determinants
of spontaneous versus deliberative attitude-tobehavior processes” (Fazio, 1995, p. 257).
81. From General Attitudes to Specific Behaviors: Automatic and Deliberative Processes (Fazio, 1990)
Attitude is the link in memory between an object and anevaluation.
The stronger is the link, the stronger is the attitude.
Direct experience, repeated attitude expressions, and other
factors produce strong attitudes.
Attitude strength is indicated by low response latency.
Attitude must be activated from memory to influence behavior.
Only strong attitudes are automatically activated.
Biased processing results are consequences of strong attitudebehavior correlation.
82. The MODE Model (Motivation and Opportunity as Determinants) – Fazio (1990)
The MODE Model (Motivation and Opportunity asDeterminants)
YES
Deliberative
Processing
Mode
Motivation/
Ability
to Process
– Fazio (1990)
NO
Spontaneous
Processing
Mode
Strong
Attitude
NO
YES
Beliefs About
the Behavior
Automatic
Attitude
Activation
No Automatic
Attitude
Activation
AttitudeConsistent
Behavior
AttitudeConsistent
Behavior
Behavior
Unrelated to
Attitude
83. The MODE Model (Motivation and Opportunity as Determinants) – Fazio (1990)
• Thus, automatic attitude activation occurs when a strong link hasbeen established in memory between the attitude object and a
positive or negative evaluation.
• The degree of accessibility (i.e., attitude strength) is usually
operationalized by measuring the latency of responses to
attitudinal questions: the faster is the response, the more
accessible the attitude is assumed to be.
84. Empirical Support for the MODE Model
• Studies that were designed to test directly the MODE model’spredictions concerning the attitude-to-behavior process have
focused on behavior in a deliberative processing mode. The
results of these studies are also generally consistent with the
model.
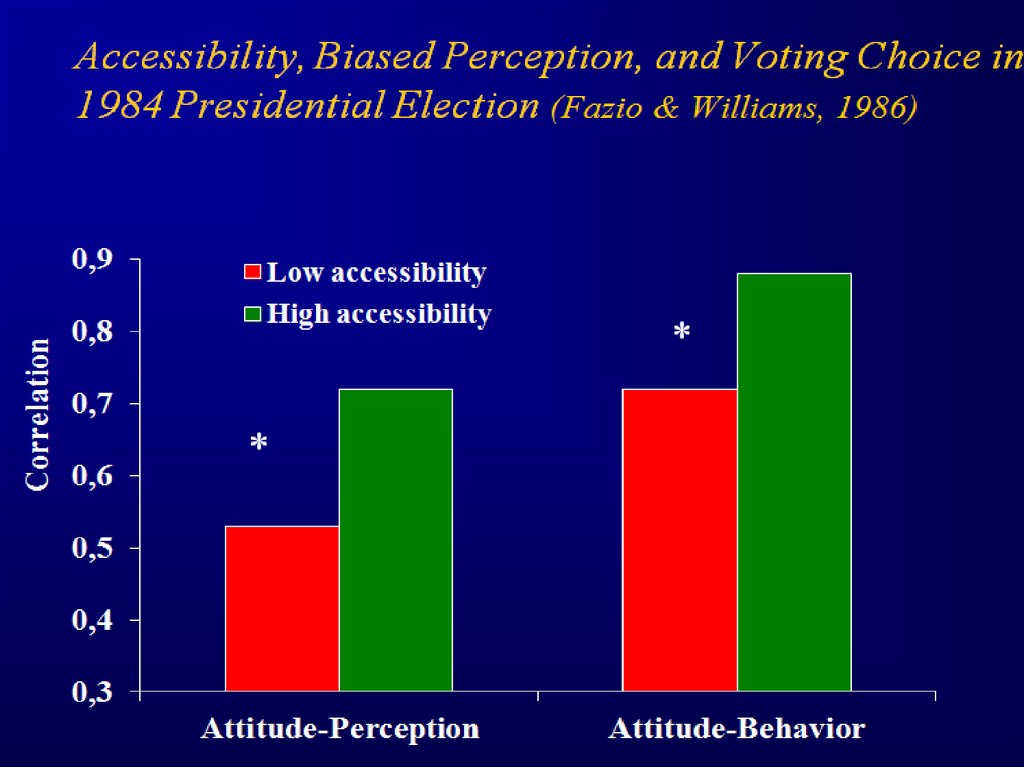
85. Empirical Support for the MODE Model
• Fazio and Williams (1986) predicted voting choice in the 1984presidential election from attitudes toward the two major
candidates (Reagan and Mondale) assessed several months earlier.
• In addition to attitude valence, the investigators also assessed the
accessibility of these attitudes by asking participants to respond as
quickly as possible to the attitude questions and by recording
response latencies. As it was expected the prediction of voting
choice was significantly better for participants with relatively
accessible (low latency) attitudes toward the candidates than for
participants with relatively inaccessible attitudes.
86.
87. Ronald Reagan
88. Walter Mondale
89. Experiment
• A total of 245 voting age residents of the Bloomington, Indiana areaparticipated in the initial part of the study.
• Twenty-five of these individuals responded to an advertisement in the local
newspaper.
• Another 16 people were recruited and interviewed at the public library.
• The majority of the sample, the remaining 204 individuals, were shoppers at
a local mall who agreed to participate in a political survey.
• The subjects were paid $3.00 for participating in the survey. All interviews
were conducted during June and July of 1984.
90. Experiment
• The first five statements were intended to serve as practice items toacquaint subjects with the procedure. The experimenter monitored the
subjects' performance during these trials to ensure that subjects did
understand the procedure.
• Of the remaining 20 statements, 5 were factual items (e.g., "The capital of
Indiana is Terre Haute") and 15 were opinion items concerning attitudes
toward such issues as school prayer, gun control, and nuclear power plants
in addition to the two major-party candidates for the presidency.
These two critical statements were "A good president for the next 4
years would be Ronald Reagan" and "A good president for the next 4
years would be Walter Mondale"
91. Experiment
• The answers of the participants of that experiment was recorded on atape recorder, which allowed in the future to measure the latent time
of answer expectancy.
• The participants had to fill a special blank in which they should have
written down personal data: name, family name, address and phone
number to receive money for the answers. Therefore, the researchers
softly-softly received personal information about the participants, which
helped them in the future to get in touch with the participants on the next
two stages of the research.
92. Experiment
• The next phase concerned judgments of the candidates'performances during the nationally televised debates. The
first debate involved the presidential candidates and was
held on October 7; the second involved the vicepresidential candidates and was held on October 11. It was
judgments of these two debates that served as the
researchers perception measures.
93. Experiment
• The day after the second debate, subjects were mailed a letter from the PoliticalBehavior Research Laboratory on psychology department letterhead. The letter
asked for help in a study being conducted concerning public perceptions of the
performance of the participants in the two debates that had been held thus far. It
further explained that if individuals would complete and return the enclosed
stamped postcard by October 25, they would receive a check for $2.00. In
addition, subjects were urged to complete the postcard questionnaire regardless of
whether they had only read or heard about the debates or whether they had
actually watched the debates. The postcard contained an item concerning the
presidential debate.
94. Experiment
• Subjects were asked to endorse one of five statements: "Reagan wasmuch more impressive," "Reagan was slightly more impressive,"
"The two candidates performed equally well," "Mondale was
slightly more impressive” or "Mondale was much more impressive."
A similarly worded item concerned the vice-presidential debate.
95.
96.
97. Experiment
• The final phase of the investigation concerned voting behavior.Beginning the day after the election, an attempt was made to
contact by telephone all the individuals who had participated in
the initial survey. One hundred sixty-three individuals were
reached and were asked whether they had voted and, if so, for
whom. Eight of these people chose not to reveal their votes. Two
other respondents had voted for candidates other than Reagan or
Mondale and their data were not included in subsequent analyses.
98.
99. The Role of Attitude Strength: Two Possibilities
Response latency is an indicator of attitude strength.“Attitude strength” is multifaceted. Any of its facets can
moderate the attitude-behavior relation.
MODE model:
Accessibility is the crucial facet.
Accessibility increases bias and thus produces attitudeconsistent.
Alternative explanation: Stability is the crucial facet.
Strong attitudes are more stable over time and therefore
more predictive of later behavior.
100. Stability of Intentions
• Perhaps more important, if intentions change after they areassessed, they will tend to be poor predictors of later behavior.
The time interval between measurement of intention and
assessment of behavior is often taken as a proxy for stability
because it is assumed that with the passage of time, an
increasing number of events may cause intentions to change.
• Meta-analyses of intention–behavior correlations show the
expected pattern over time, although the effect is not always
significant.
101. Stability of Intentions
• Instead of relying on time interval as an indication of stability,some studies have assessed stability of intentions directly, and
these studies have consistently found that the intention–behavior
correlation declines substantially when intentions are unstable.
102. Stability of Intentions
In one of these investigations (Sheeran, Orbell, & Trafimow,1999), undergraduate college students twice indicated their
intentions to study over the winter vacation, 5 weeks apart.
After returning from the winter vacation, they reported on how
many days a week they had actually studied.
103. Changes in Intentions Prior to Behavior (Sheeran, Orbell, & Trafimow, 1999)
Changes in Intentions Prior to Behavior(Sheeran, Orbell, & Trafimow, 1999)
Behavior: Self-reported studying during winter vacation (number of days).
Intention: Measured twice, 5 weeks apart prior to winter vacation.
Overall intention-behavior correlation: .38**
Results of moderated regression analysis:
Stable intention (r = .58)
Unstable intention (r = .08)
104. Stability of Intentions
• For participants whose intentions remained relatively stable during the5-week period prior to the vacation, the intention–behavior correlation
was .58, whereas for participants with relatively unstable intentions, it
was .08. Similar results were reported with respect to attending a
health screening appointment and eating a low-fat diet (Conner,
Sheeran, Norman, & Armitage, 2000).