


 economics
Similar presentations:


Indicators of economic efficiency
1. Indicators of economic efficiency
INDICATORS OFECONOMIC EFFICIENCY
How do we measure the health of our
economy?
2.
3.
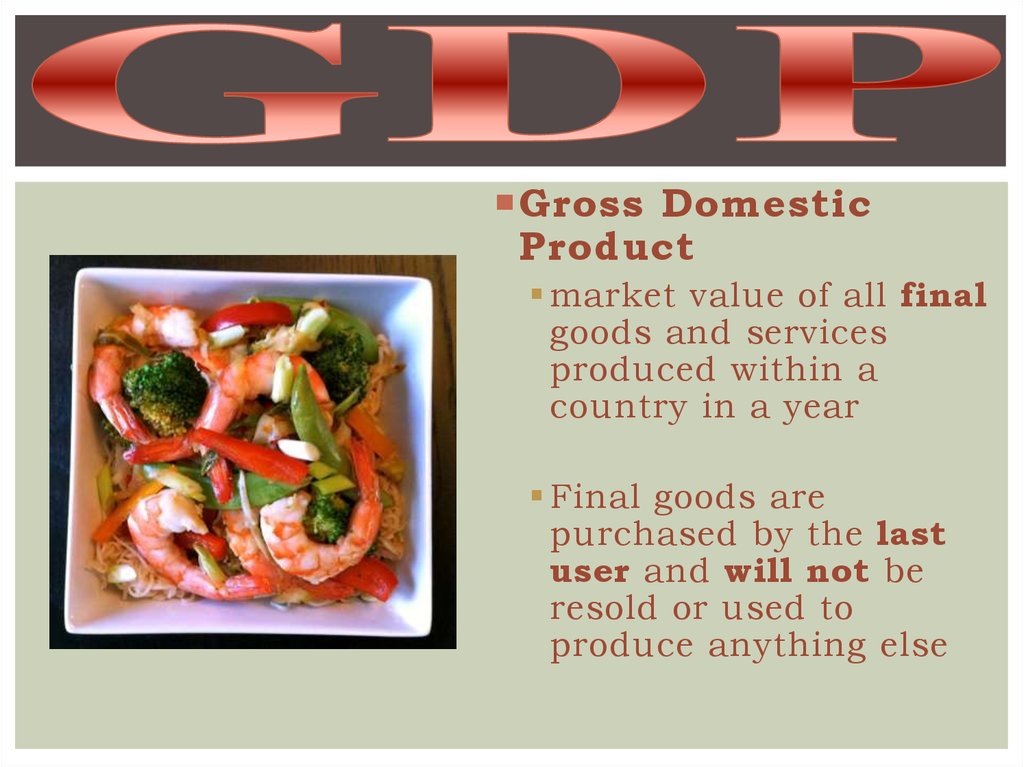
Gross DomesticProduct
market value of all final
goods and services
produced within a
country in a year
Final goods are
purchased by the last
user and will not be
resold or used to
produce anything else
4. NOT Counted in GDP
NOT COUNTED IN GDPIntermediate goods
Resources of any kind
Used goods
Ex: Used cars, purchase of an older home, thrift store clothing,
Craigslist, Ebay
Illegal goods/services
Ex: Drugs, theft etc.
Purely financial transactions
Ex: Investment in stocks or savings
Transfer Payments
Ex: Social Security, Food Stamps
Barter
Ex: Babysitting for yardwork
5. 4 Components of GDP
4 COMPONENTS OF GDPC: consumer spending
Daily spending on goods and services
I: business investment spending
Machinery, factories, equipment etc.
6.
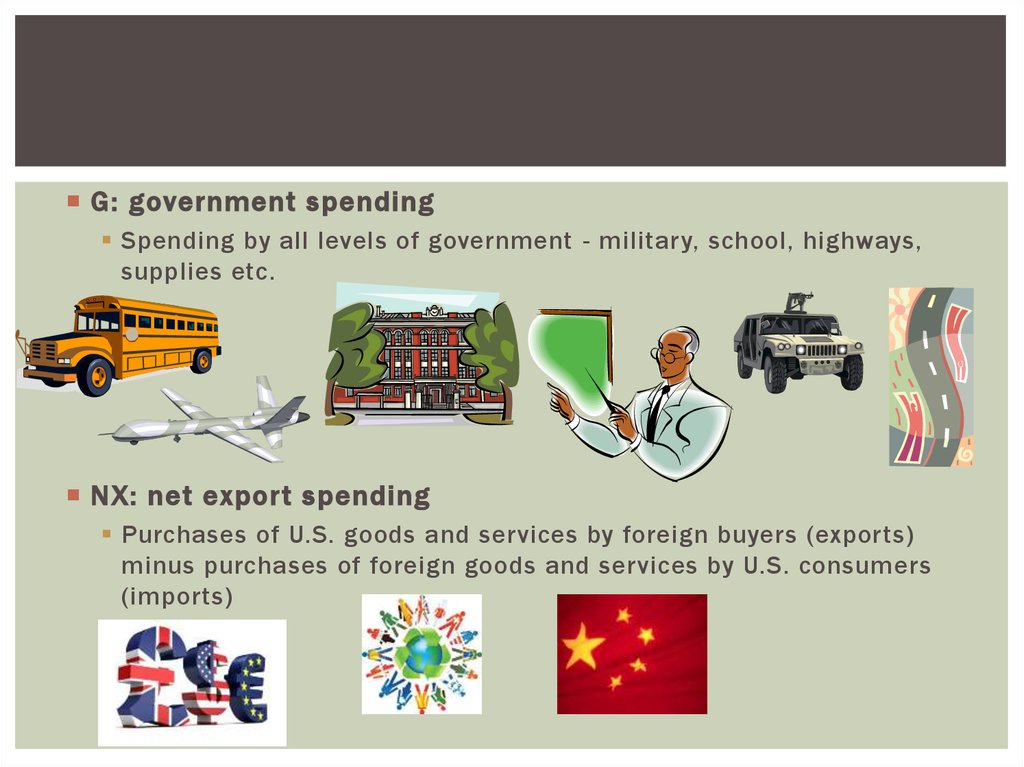
G: government spendingSpending by all levels of government - military, school, highways,
supplies etc.
NX: net export spending
Purchases of U.S. goods and services by foreign buyers (exports)
minus purchases of foreign goods and services by U.S. consumers
(imports)
7. GDP= C+I+G+NX
Example:In 2000, estimates in trillions of
dollars
GPP = C +
I +
G
+
$10.04 = $6.81 + $1.87 + $1.75 + ($1.13-$1.52)
NX
8.
Unemployment RatePercentage of labor force who is not
working
Labor Force: everyone 16 – 65 who is
working or actively looking for work
3 types of unemployment
9. Frictional
FRICTIONALPeople are out of work temporarily
Seasonal work
Changing jobs
Looking for 1 st job
This is acceptable unemployment
10. Structural
STRUCTURALUnemployment because your job skills
are no longer needed
Ex. Technology replaces workers so people
are laid off
People can go back to school and learn
new skills
11. Cyclical
CYCLICALPeople are unemployed due
to fluctuations in the
business cycle
As the economy declines,
people lose their jobs
Worst kind of
unemployment, can not
easily fix. Economy must
recover first.
12.
Consumer Price IndexIndex of all goods and services produced in a country
Measured by a market “basket” of all goods and
services that are commonly bought year after year by
the typical urban household
13. Effects of Changing CPI
EFFECTS OF CHANGING CPIInflation
Rising price levels
purchasing power of the dollar falls
Dollar buys less
Deflation
Falling price levels
purchasing power of the dollar rises
Dollar buys more
14.
Hyperinflation: rapid inflationex. Germany after WWII
Stagflation: rising prices with
falling GDP and rising
unemployment
15. Relationship between GDP, Unemployment and CPI
RELATIONSHIP BETWEEN GDP,UNEMPLOYMENT AND CPI
As GDP rises, unemployment rates fall and prices
begin to rise
As GDP falls, unemployment rises and prices begin
to decline
16. 4 Stages of the Business Cycle
4 STAGES OF THE BUSINESS CYCLEThe 1st stage: when the
economy has economic
growth
GDP is rising
17. Business Cycle
BUSINESSCYCLE
2nd stage: GDP is
at it’s maximum
18. Business Cycle
BUSINESSCYCLE
6 months
or more of
a
contraction
is called a
recession
If the
recession
3rd stage:is
bad
enough,
it
GDP
is falling
is a
depression
19. Business Cycle
BUSINESSCYCLE
The bottom of the
contraction where
GDP stops falling
20. Business Cycle – 4 stages
BUSINESS CYCLE – 4 STAGES21.
Aggregate means “total”Total demand for ALL FINAL goods
and services in the economy
from all people in the economy
for all prices levels
22. Components
COMPONENTSAggregate demand consists of:
consumer spending (C)
investment spending (I)
government spending (G)
net export spending (NX).
If any component increases, GDP increases, AD curve shifts
right.
If any component decreases, GDP decreases, AD curve
shifts left
23. THE CURVE
High price level leads to lower quantity of aggregate demandP stands for price levels in the
economy
AD is aggregate demand – total
demand for all final goods and
services in the economy
Q is real GDP (output) of all final
goods and services
24. Aggregate Supply
AGGREGATE SUPPLYTotal production of ALL FINAL goods
and services in the economy
from all poducers in the economy
for all prices levels